2459
Non-invasive assessment of renal function using intravoxel incoherent motion imaging taking account of renal tubular water and relaxation times1Division of Medical Physics, Tohoku University, Graduate school of medicine, Sendai, Japan, 2Department of Advanced MRI Collaboration Research, Tohoku University, Graduate school of medicine, Sendai, Japan, 3Department of Radiology, Tohoku University hospital, Sendai, Japan, 4Division of Nephrology, Endocrinology, and Vascular Medicine, Tohoku University, Graduate school of medicine, Sendai, Japan
Synopsis
Renal IVIM imaging taking account of water in the urinary tubules and relaxation times was performed in patients with renal-artery stenosis. Several estimated parameters were significantly correlated with the functional parameters obtained by renal scintigraphy (water fraction with the time to peak height (Tmax) on the renogram curve of renal scintigraphy, parenchymal diffusion coefficient with the glomerular filtration rate (GFR), and transverse relaxation time of flowing blood with GFR).
Introduction
Intravoxel incoherent motion (IVIM) imaging has been studied for evaluating renal blood perfusion and parenchymal water diffusion.1,2 In renal IVIM, however, we should take account of the water component in renal tubules separately from the water in flowing blood. Relaxation times (T1 and T2) of each component should also be included in IVIM models. In this study, we used a three-compartment model that is consisted of renal parenchyma, blood vessels and tubules. We have applied the model to analyze IVIM images acquired in patients with renal-artery stenosis (RAS) to see the applicability for assessing renal pathology.Methods
This retrospective study included 14 consecutive patients with RAS (Table 1) who were scheduled for endovascular interventions. All patients underwent IVIM imaging during the routine MRI examinations. A 3T MR scanner (Achieva dStream, Philips Medical Systems) with 32ch ds-Torso and 32ch Posterior coils was used for the examinations. Spin-echo echo-planar diffusion weighted imaging (SE-DWI) and fluid attenuated inversion recovery (FLAIR)-DWI with short and long TE were imaged in coronal plane under free breathing. Basic imaging parameters were: slice thickness = 8 [mm], number of slice = 1, acquisition matrix = 65x112 , FOV = 230 [mm], number of signal averaged = 15, b = 0, 250, 500 [s mm-2]. Imaging parameters of FLAIR-DWI were: TR/TEshort/TElong = 5500/59/84 [ms] and TI =2000[ms]. Imaging parameters for SE-DWI were: TR/TEshort/TElong = 3000/59/84 [ms].Seven parameters (three for renal parenchymal component: apparent diffusion coefficient (Dt), longitudinal relaxation rate (R1t = 1/T1t), transverse relaxation rate (R2t = 1/T2t); two for flowing blood component: fraction (fb) and transverse relaxation rate (R2b); and fraction of urinary tubular water (fw)) were estimated pixel by pixel basis based on fitting of three-compartment model with non-linear least squares method to the 12 image data: SE- and FLAIR-DWI with different 2 TE- and 3 b -values. We assumed the following parameters with reference of published paper: apparent diffusion coefficient (Db,) and longitudinal relaxation rate (R1b) of blood, apparent diffusion coefficient (Dw), longitudinal (R1w) and transverse (R2w) relaxation rate of water in renal tubules. The MRI signal from each component was assumed to decay exponentially by diffusion and transverse relaxation: Exp[-D b]Exp[- R2 TE] and assumed to recover to thermal equilibrium by longitudinal relaxation. The residue time of flowing blood in the imaging slice was assumed to be 3.5 s.3 This means that blood with thermal equilibrium enters the imaging slice during TR and TI at the specific rate. Cortical and medullary regions were drawn based on FLAIR-DWI image and R1t map.
Spearman's correlation analysis was performed to evaluate the estimated parameters by comparing to quantitative indices of renal scintigraphy with technetium-99m diethylenetriamine pentaacetic acid (99mTc-DTPA) done less than 10 weeks before MRI study. P < 0.05 was considered statistically significant.
Results
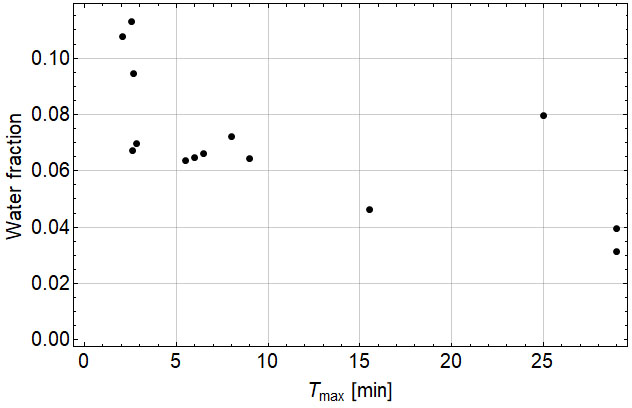
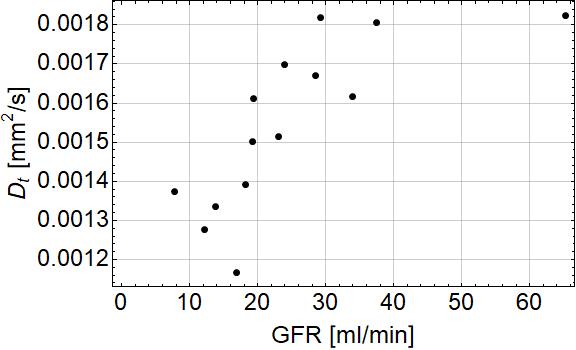
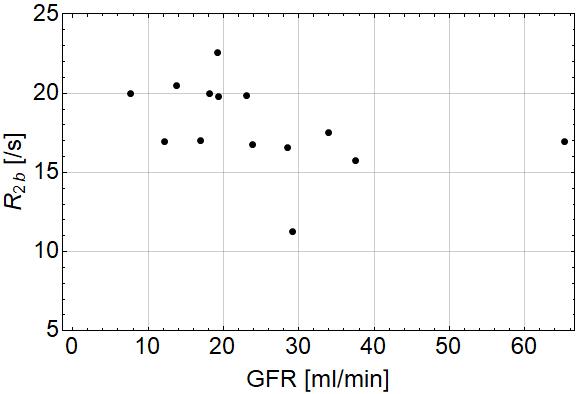
The water fraction, fw of affected kidney was negatively correlated with the time to peak height (Tmax) on the renogram curve of renal scintigraphy (Figure 1, P = 0.00306 for cortex and medulla averaged). The parenchymal diffusion, Dt of affected kidney was correlated with the glomerular filtration rate (GFR) obtained by renal scintigraphy (Figure 2, P = 2×10⁻⁷ for cortex). R2b of affected kidney was negatively correlated with GFR (Figure 3, P =0.016 for medulla).Discussion
Consistent with our results, previous reports have shown correlation between Dt and GFR.1,2 In addition to this correlation, this study showed negative correlations of fw with Tmax and R2b with GFR. R2b is known to correlate negatively with blood oxygenation. These relations may be useful for assessing renal pathology.We assumed Db = 0.01 mm2/s for this model. Our simulation studies (not shown) indicate that the assumption of fixed Db may affect the estimated parameters, especially, fb and Dt. Change in the b-value of 250 to a larger one e.g. 300-400 s/mm2 may alleviate this problem.
Conclusion
Renal IVIM imaging taking account of water in the urinary tubules and relaxation times was performed in patients with renal-artery stenosis. Several estimated parameters were significantly correlated with the functional parameters obtained by renal scintigraphy. This preliminary study indicates that renal IVIM imaging taking account of water in the urinary tubules and relaxation times may add a new way for assessing renal pathology noninvasively in clinical decision-making.Acknowledgements
This work was supported by JSPS KAKENHI Grant Number JP18K07663.References
1. Caroli A, Schneider M, Friedli I, et al. Diffusion-weighted magnetic resonance imaging to assess diffuse renal pathology: a systematic review and statement paper. Nephrol Dial Transpl. 2018;33:ii29–ii40.
2. Jiang K, Ferguson C, Lerman L. Noninvasive Assessment of Renal Fibrosis by Magnetic Resonance Imaging and Ultrasound Techniques. Transl Res. 2019;209:105–120.
3. Wright K, Chen Y, Saybasili H, et al. Quantitative High-Resolution Renal Perfusion Imaging Using 3-Dimensional Through-Time Radial Generalized Autocalibrating Partially Parallel Acquisition. Invest Radiol. 2014;49:666–674.
Figures