2457
Multiparametric MR imaging in diabetic nephropathy: New insights to evaluate early diabetic nephropathy noninvasively1Radiology, Kawasaki Medical School, Kurashiki, Japan, 2Kawasaki Medical School, Kurashiki, Japan, 3Philips Japan, Minato-ku, Japan
Synopsis
The purpose of this study was to identify the changes in multiparametric magnetic resonance imaging (MRI) findings in early diabetic nephropathy. Measurements were made of the renal cortex and renal medulla T2 values, T2* values and R2* values, as well as optimal TI, inverted TI value in SSFP with ssIR pulse with multi TI. Also, renal cortical thickness and renal length were measured, representing morphological changes. Significant differences were seen between the healthy and early diabetic nephropathy groups in values of T2 and inverted TI. This study suggests the possibility that MRI using the T2 value and inverted TI of SSFP with an ssIR pulse can be used to evaluate early diabetic nephropathy non-invasively and in a short period of time.
Body of the abstract
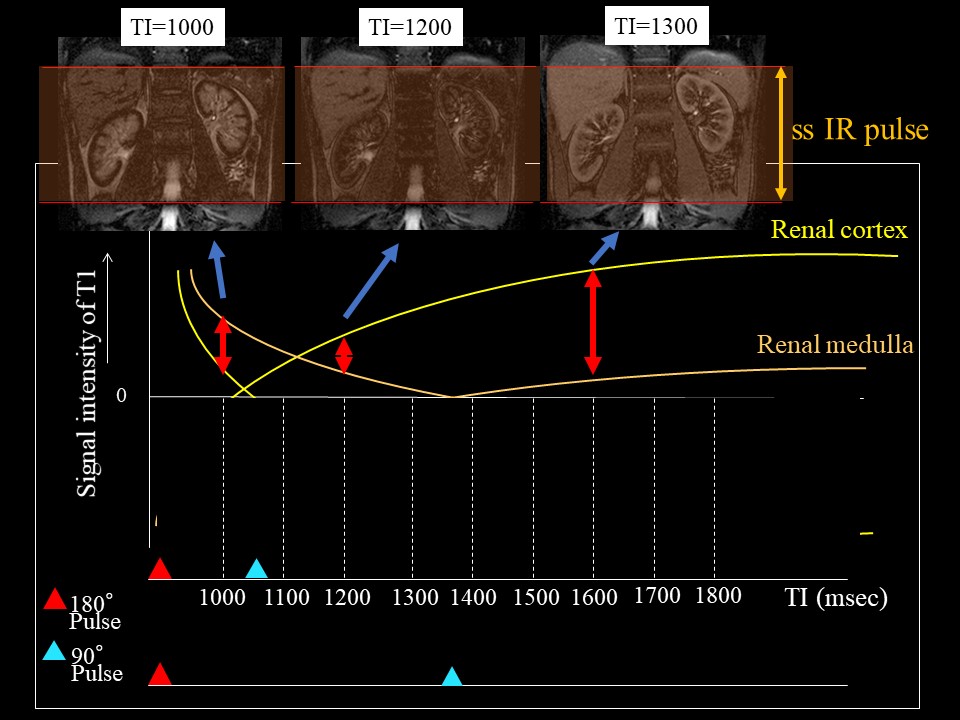
IntroductionThe incidence of diabetic nephropathy is increasing, and it has recently become the most common underlying disorder in dialysis patients. Early stage diabetic nephropathy is difficult to diagnose with regular kidney function tests, and at present, the severity is determined based only on microalbuminuria. More accurate diagnosis requires evaluation with multiple tests. In order to perform these tests in a larger number of early stage diabetic patients who have few symptoms, the tests should ideally include those that can be performed non-invasively and in a short period of time. Recent studies of MR imaging have shown that water content level of tissue could be evaluated sensitively with T2 mapping 1). Steady-state free precession (SSFP) with spatially selective inversion recovery (ss IR) pulse using multi inversion time (TI) is able to distinct renal corticomedullary differentiation (Fig.1)2). T2* mapping and R2*mapping may be able to estimate oxygenation3). The purpose of this study was to identify the changes in multiparametric magnetic resonance imaging (MRI) findings in early diabetic nephropathy.
Methods
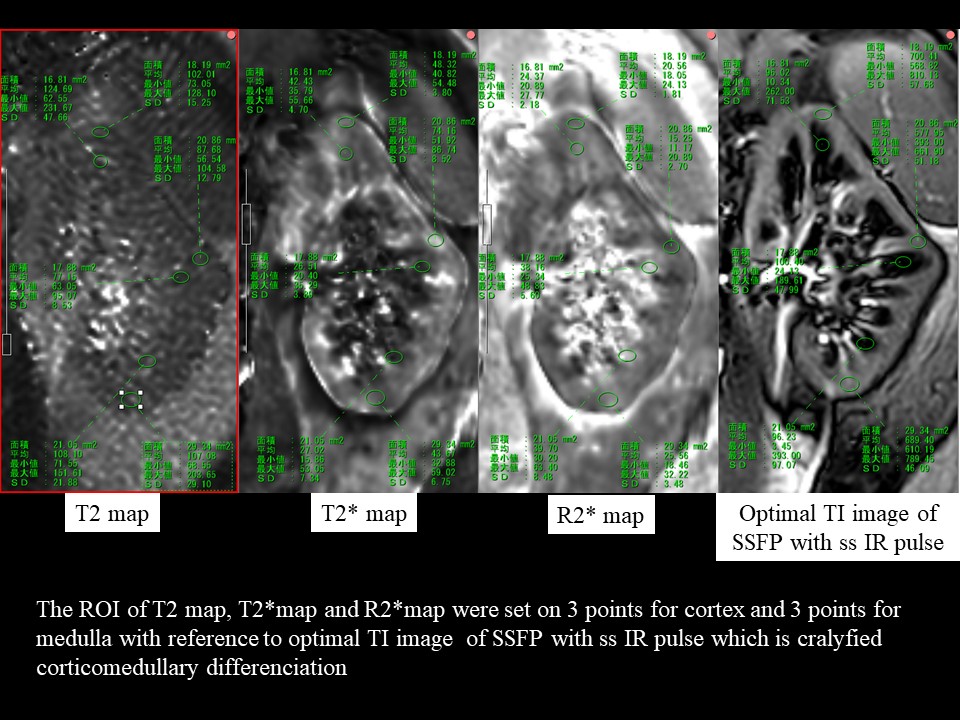
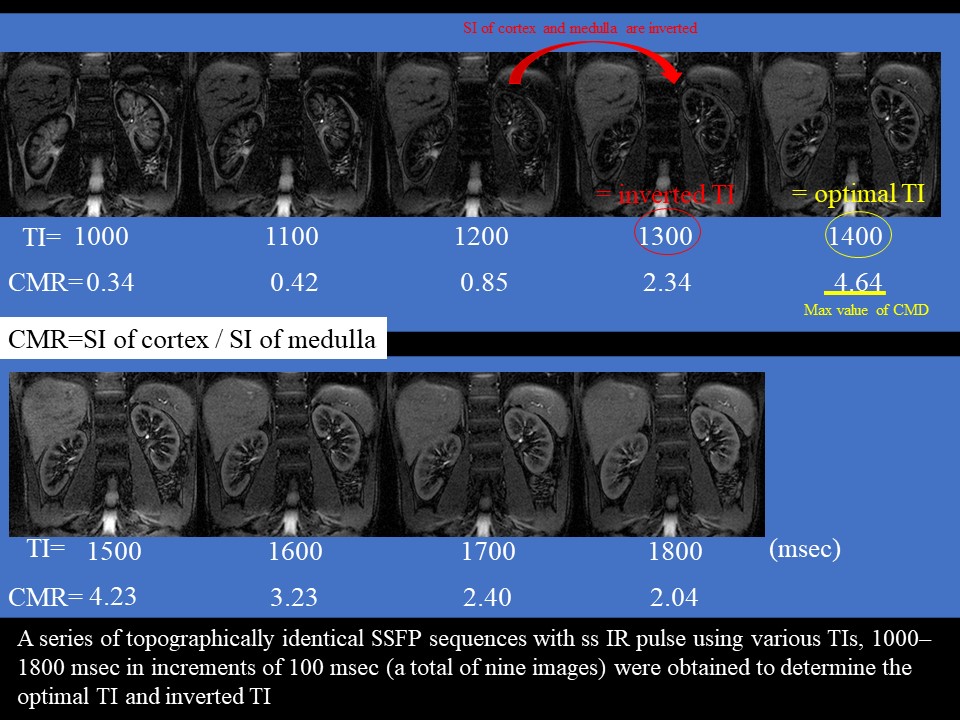
The study subjects (N=16) included 11 patients hospitalized with diabetes between December 2018 and September 2019 who had diabetic nephropathy and who consented to participate in this study (Stage 1: 3 patients, Stage 2: 4 patients, Stage 3: 2 patients, Stage 4: 2 patients), and 5 healthy volunteers. The subjects were divided into three groups: healthy group (healthy volunteers, n=5), early diabetic nephropathy group (diabetic nephropathy stage1 and 2, n=7) and advanced diabetic nephropathy group (diabetic nephropathy stage3-4, n=4). All subjects underwent non-contrast MRI using a 3-Tesla MRI machine. Measurements were made of the renal cortex and renal medulla T2 values, T2* values, R2* values (Fig.2), optimal inversion time (TI) (= TI of maximum corticomedullary contrast ratio (CMR = signal intensity (SI) of cortex / SI of medulla)) and inverted TI value (value of TI that inverts the renal cortex and renal medulla SI) in steady-state free precession (SSFP) with a special selective inversion recovery (ssIR) pulse with multi TI (TI = 1000, 1100, 1200, 1300, 1400, 1500, 1600, 1700, 1800 msec) (Fig. 3), as well as renal cortical thickness and renal length, representing morphological changes. Each of these values was compared among three groups: a healthy group, an early diabetic nephropathy group, and an advanced diabetic nephropathy group.
Results
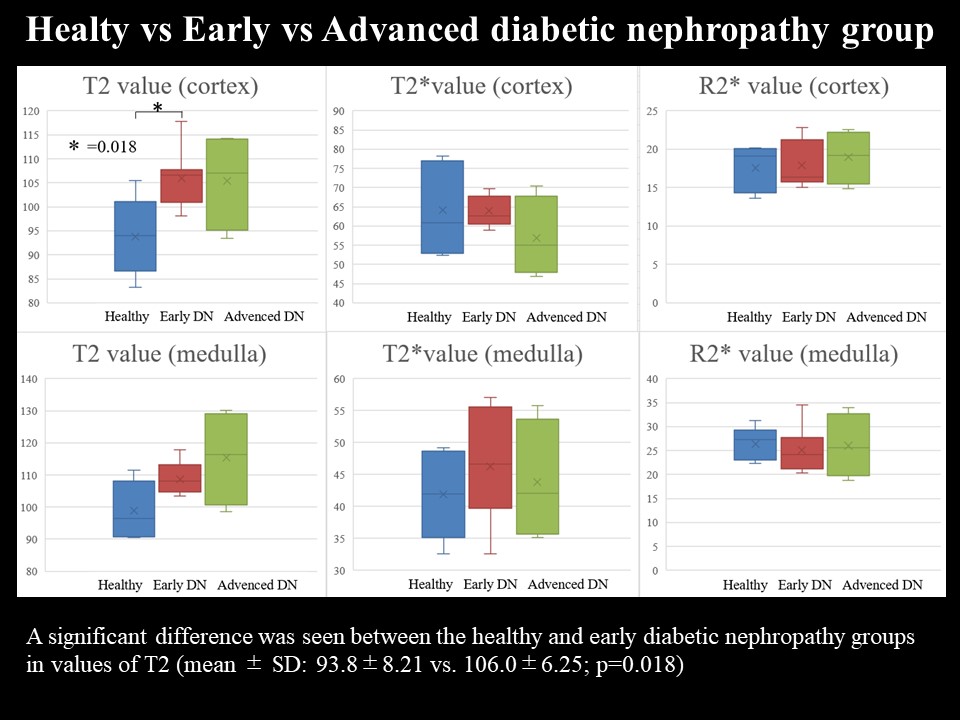
A significant difference between the three groups was only seen in the value of inverted TI of SSFP with a ssIR pulse with multi TI (mean ± standard deviation (SD): 1200±35.4 vs. 1293±53.5 vs. 1300±70.7; p=0.036). In two-group comparisons, significant differences were seen between the healthy and early diabetic nephropathy groups in values of T2 (mean ± SD: 93.8±8.21 vs. 106.0±6.25; p=0.018) and inverted TI (mean ± SD: 1200±35.4 vs. 1293±53.5; p=0.018). A significant difference in renal cortical thickness was seen between the early diabetic nephropathy group and advanced diabetic nephropathy group (mean ± SD: 8.16±2.19 vs. 5.68±1.40; p=0.042, respectively) (Fig.4,5).
Discussion
In chronic renal impairment other than diabetic nephropathy, the estimated glomerular filtration rate index used to evaluate kidney function gradually decreases as renal impairment progresses. Morphological changes indicating a gradual decrease in renal cortical thickness and renal length are also seen. In diabetic nephropathy, on the other hand, these indicators are unreliable and, in fact, show an increasing trend in the early stage, making diagnosis of early diabetic nephropathy difficult. These changes are caused by glomerular hypertension, and conversely are characteristic changes in early diabetic nephropathy. Glomerular hypertension is thought to produce enlargement of the glomeruli and edematous changes in surrounding tissue. In other words, the water content in tissue increases. Values of T2 and inverted TI, which showed significant differences between the healthy group and early diabetic nephropathy group in this study, are both images that can exquisitely capture tissue water content, such as edematous changes. Thus, they might be sensitive indicators of the changes due to glomerular hypertension that are characteristic of early diabetic nephropathy. In future, it will be necessary to conduct further investigations with greater numbers of patients.
Conclusion
This study suggests the possibility that MRI using the T2 value and inverted TI of SSFP with an ssIR pulse, which can sensitively capture edematous changes in the renal cortex, can be used to evaluate early diabetic nephropathy non-invasively and in a short period of time.
Acknowledgements
NoneReferences
1. Wolf M, de Boer A, Sharma K, et al. Magnetic resonance imaging T1- and T2-mapping to assess renal structure and function: a systematic review and statement paper. Nephrol Dial Transplant. 2018 Sep 1;33(suppl_2):ii41-ii50.
2. Noda Y, Ito K, Kanki A, et al. Measurement of renal cortical thickness using noncontrast-enhanced steady-state free precession MRI with spatially selective inversion recovery pulse: Association with renal function. J Magn Reson Imaging. 2015 Jun;41(6):1615-21.
3. Hall ME, Jordan JH, Juncos LA, et al. BOLD magnetic resonance imaging in nephrology. Int J Nephrol Renovasc Dis. 2018 Mar 13;11:103-112.
4. Parving HH, Mauer M, Ritz E. Diabetic nephropathy. In: Brenner BM, ed. Brenner and Rector’s The Kidney. 8th ed. Philadelphia, PA: Saunders Elsevier, 2007; 1265-1298
Figures
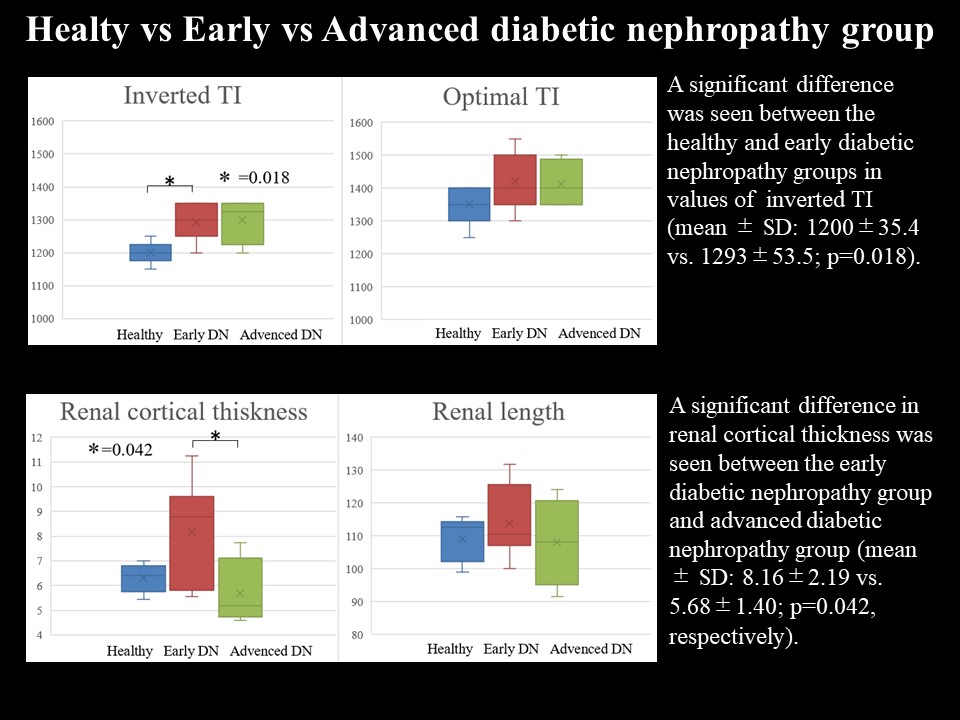
A significant difference was seen between the healthy and early diabetic nephropathy groups in values of inverted TI (mean ± SD: 1200±35.4 vs. 1293±53.5; p=0.018).
A significant difference in renal cortical thickness was seen between the early diabetic nephropathy group and advanced diabetic nephropathy group (mean ± SD: 8.16±2.19 vs. 5.68±1.40; p=0.042, respectively).