2456
Evaluate the efficiency of T1 Mapping and amide proton transfer imaging in differentiating chronic kidney disease and healthy volunteers.1The First Affiliated Hospital of Dalian Medical University, dalian, China, 2Clinical Science, Philips Healthcare, Beijing, China
Synopsis
To evaluate the joint diagnosis value of T1 Mapping and amide proton transfer imaging in the chronic kidney disease and healthy volunteers.
SYNOPSIS
To evaluate the joint diagnosis value of T1 Mapping and amide proton transfer imaging in the chronic kidney disease and healthy volunteers.INTRODUCTION
The global burden of kidney disease is significant, as >10% of the world’s adult population has chronic kidney disease (CKD)[1]. Quantitative magnetic resonance imaging approaches, such as mapping techniques, could potentially discriminate histological changes in kidneys non-invasively. T1 Mapping is a new magnetic resonance technique that directly measures tissue T1 (spin-lattice) relaxation properties[2].Amide proton transfer (APT) imaging is one subset of the endogenous chemical exchange saturation transfer (CEST) imaging and magnetization transfer (MT) techniques. It can assess the changes in the intracellular protein concentration and PH by detecting the proton exchange between the amide protons in endogenous mobile proteins and bulk-water protons[3,4].Previous studies have shown that T1 Mapping and APT imaging have been used in renal disease respectively. In this study, we aimed to evaluate the efficiency of T1 mapping and amide proton transfer imaging in differentiating chronic kidney disease and healthy volunteers.METHODS
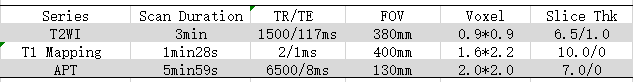
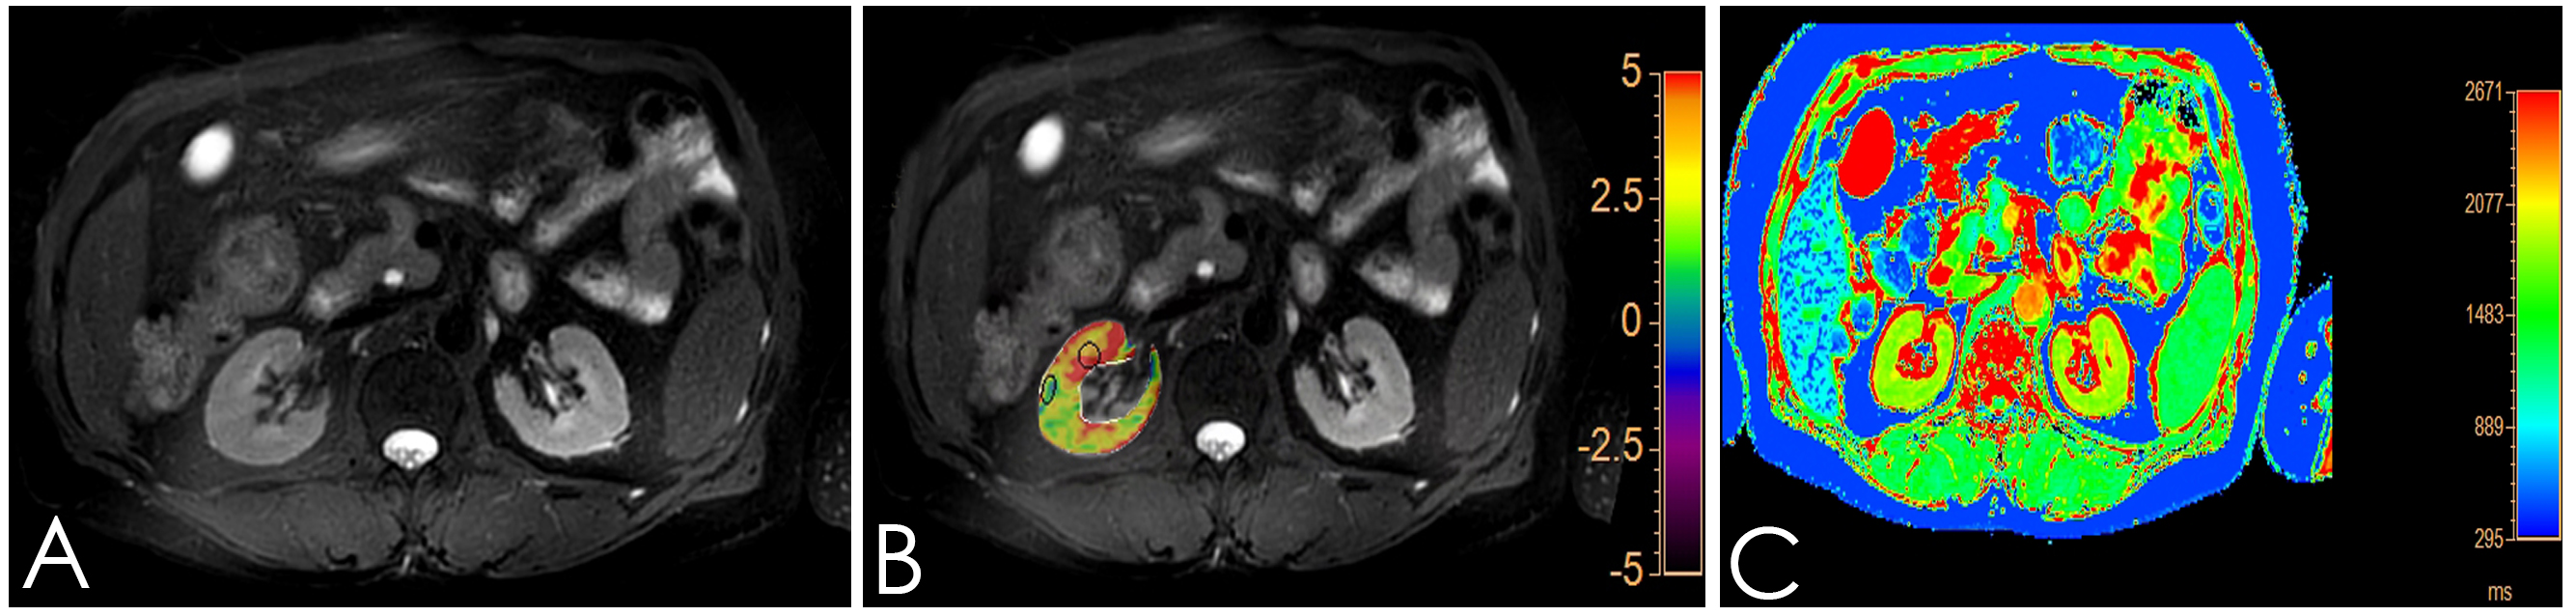
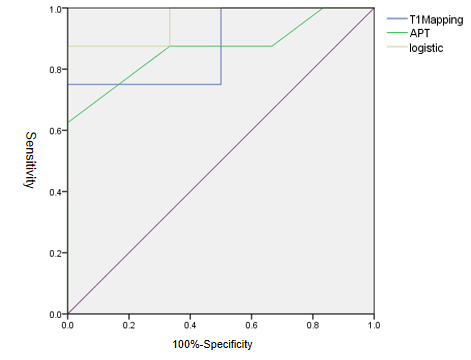
Institutional review board approval and informed consent were obtained. From April to October 2019, 6 healthy male volunteers and 8 chronic kidney disease were scheduled for kidney APT and T1 Modified Look-Locker Inversion recovery (MOLLI) MR imaging on a 3T MR scanner (Ingenia 3.0T CX; Philips Healthcare, Best, the Netherlands) equipped with dual radiofrequency (RF) transmission subsystem with a 16 channel abdominal coil. Exclusion criteria: (1) Renal space occupying lesion; (2) There was focal abnormal signal on the T2WI or Zoom DWI images.All 14 volunteers were enrolled in the study eventually. Scanning sequences: axial T2-weighted imaging (T2WI) 、T1 MOLLI (for T1 mapping) and 3D-amide proton transfer weighted imaging (3D-APT), shown in Table 1. After all data were transferred to the Intelli Space Portal(Philips Healthcare), two radiologists with 2 and 5 years of MR diagnostic experience respectively performed the image measurements independently. The T1 Mapping and APT images were fused with T2WI before data measurement, and a circular ROI (diameter: about 10mm) was placed on the maximum level of the fused image on cortex and medulla of the right kidney, as shown in Figure 1. The average value of the ROI measured by the two observers was calculated for statistical analysis.The data were analyzed using SPSS version 23.0 with intraclass correlation coefficient (ICC) >0.75 indicating good consistencies. According to whether the data is in compliance with normality,Independent sample t test and Mann-Whitney U test were used to analyze the difference between the mean values of T1 relaxation and APT values obtained by the two observers. The receiver operating characteristic curve (ROC) was used to analyze the diagnostic performance. The combined efficacy of T1 Mapping and APT was analyzed by binary logistic regression analysis, and the phase diagnostic efficacy AUC values and the corresponding sensitivity and specificity were calculated,as shown in Figure 2.RESULTS
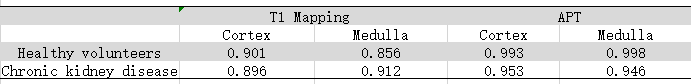
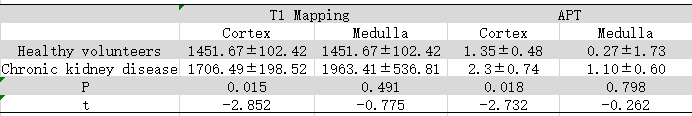
The consistency of T1 Mapping and APT imaging measured by two observers was good (ICC>0.75), shown in Table 2. The T1 Mapping value and APT imaging in chronic kidney disease group were significantly higher than those in healthy volunteer group in the cortex(shown in Table 2, P<0.05).T1 Mapping imaging of cortex obtained an area-under-curve (AUC) for ROC study of 0.875 with sensitivity of 75.0% and specificity of 83.3%. And AUC of cortex APT imaging is 0.875,with sensitivity of 87.5% and specificity of 66.7%.When combining T1 Mapping and APT imaging of cortex, results obtained an area-under-curve (AUC) for ROC study of 0.958 with sensitivity of 75.0% and specificity of 83.3% for differentiating chronic kidney disease from healthy volunteers.DISCUSSION AND CONCLUSIONS
In this study, T1 Mapping and amide proton transfer imaging was first applied to the joint diagnosis of differentiating chronic kidney disease from healthy volunteers. And we found that joint diagnostic performance was better than each imaging,which is expected further application for related research on renal disease diagnosis. Only the renal cortex was statistically different between the two groups,and may have a certain degree of connection with the sample size of this study.Acknowledgements
Thanks for all my teachers.References
1.Levin A, Tonelli M, Bonventre J. et al. Global kidney health 2017 and beyond: a roadmap for closing gaps in care, research, and policy. Lancet 2017; 390: 1888–1917
2.Ilona A,Elisabeth H.M,Aiko P.J, et al. Reproducibility of Native T1 Mapping for Renal Tissue Characterization at 3T.Journal of Magnetic Resonance Imaging,DOI: 10.1002/jmri.26207.
3. Togao O, Hiwatashi A, Keupp J, et al. Scan-rescan reproducibility of parallel transmission based amide proton transfer imaging of brain tumors[J]. Magn Reson Imaging, 2015,42(5):1346-53.
4. Dula AN, Arlinghaus LR, Dortch RD, et al. Amide proton transfer imaging of the breast at 3 T: establishing reproducibility and possible feasibility assessing chemotherapy response[J].Magn Reson Med, 2013,70(1):216-24.
Figures