2454
Is diffusion-weighted imaging effective in differentiating chromophobe renal cell carcinoma and oncocytoma as per cell grade?1Department of Diagnostic Radiology, The Cancer Institute Hospital of the Japanese Foundation for Cancer Research, Tokyo, Japan
Synopsis
Although the prognosis of chromophobe renal cell carcinoma (CHRCC) is more favorable than that of other RCC subtypes, it is a malignant tumor with possible metastasis. On the other hand, there is only one confirmed case of renal oncocytoma metastasis. This study assessed the apparent diffusion coefficient (ADC) value derived from diffusion-weighted imaging to differentiate renal oncocytoma from CHRCC according to cell grade. The ADC values were significantly different between low-grade and high-grade CHRCCs and between oncocytoma and high-grade CHRCC. Thus, the ADC value is useful for differentiating oncocytoma from high-grade CHRCC but not for differentiating oncocytoma from low-grade CHRCC.
INTRODUCTION
Although the prognosis of chromophobe renal cell carcinoma (CHRCC) is more favorable than that of other RCC subtypes, it is a malignant tumor with the potential for metastasis and death1. On the other hand, there is only one confirmed case of renal oncocytoma metastasis2. Both these entities are derived from the intercalated cells of the collecting duct system, with overlapping morphological and histological features3. Renal oncocytoma with nuclear atypia is easily misdiagnosed as CHRCC, whereas the latter is often misdiagnosed as oncocytoma. Because of the benign behavior of oncocytoma, it commonly requires only imaging follow-up or less invasive therapeutic options4. However, CHRCC is associated with a mortality rate of 10%1 and thus requires surgical intervention5. It is therefore important to accurately distinguish these two types of tumors prior to treatment, and this might assist in determining the appropriate treatment method and help avoid unnecessary ablative or extirpative treatment. To date, no report has compared CHRCC with oncocytoma according to the grade of CHRCC cells. Therefore, the purpose of this study was to assess the apparent diffusion coefficient (ADC) value derived from diffusion-weighted imaging (DWI) for differentiating oncocytoma from CHRCC according to cell grade.METHODS
DWI was performed in 40 patients with CHRCC (n = 29) or oncocytoma (n = 11), using a single-shot spin-echo echo-planar imaging fat-suppressed pulse. All tumors were pathologically confirmed. All abdominal magnetic resonance imaging studies were performed using a phased-array body coil on three scanners at 3.0 T (Magnetom Skyra, Siemens Healthcare, Erlangen, Germany; Discovery MR750, GE Healthcare, Waukesha, WI, USA; and Vantage Titan, Canon Medical Systems, Tochigi, Japan). Imaging protocols varied slightly for the different scanners, as well as over the course of the study period, but all included free-breathing DWI using b values of 0 and 800 s/mm2. The parameters were as follows: repetition time/echo time, 2200/50–13000/70 ms; matrix, 96 × 112–224 × 192; section thickness, 3.6–6 mm; gap, 1.8–3 mm; field of view, 300–380 mm; and averages, 3–5. Separate image series were acquired with diffusion weighting in the axial direction using tridirectional diffusion gradients. ADC maps were automatically generated by the scanner. Mean ADC values were obtained within a single round or oval manually drawn region of interest (ROI) on ADC maps calculated with the b values mentioned previously. The ROI was placed at the solid portion of the tumor where a low ADC was visualized using image number and table position along with anatomical landmarks to ensure location consistency. The ROI size was variable, and it was drawn as large as possible depending on the lesion size in a homogeneous low ADC region with avoidance of cystic degeneration, necrosis, and hemorrhage. Wilcoxon rank sum test was used to estimate differences in terms of ADC value between these tumors. The difference was found to be significant (p < 0.05). To differentiate among low (Fuhrman I–II) and high (Fuhrman III–IV) grade CHRCCs and oncocytoma using ADC values, areas under the curve and cut-off values were determined using receiver operating characteristic (ROC) curve analysis. Sensitivity, specificity, and accuracy were calculated.RESULTS
According to the Fuhrman classification system, among the 29 CHRCC cases, 20 (69%) were low grade (0 grade I and 20 grade II) and 9 (31%) were high grade (9 grade III and 0 grade IV). There was no significant difference in the ADC value between oncocytoma and low-grade CHRCC. However, the ADC value was significantly higher for low-grade CHRCC than for high-grade CHRCC (1.30 ± 0.35 vs. 0.84 ± 0.33 × 10⁻³ mm2/s, p < 0.01; Fig. 1). Additionally, the ADC value was significantly higher for oncocytoma than for high-grade CHRCC (1.55 ± 0.41 vs. 0.84 ± 0.33 × 10⁻³ mm2/s, p < 0.01; Fig. 2). Using the cut-off value of ADC of 1.03 × 10⁻³ mm2/s, we could discriminate oncocytoma from high-grade CHRCC; sensitivity and specificity were 100% and 88.9%, respectively. The area under the ROC curve was 0.94 for distinguishing between oncocytoma and high-grade CHRCC, and the diagnostic accuracy was 95%. We show representative cases of oncocytoma, low-grade CHRCC, and high-grade CHRCC in fig. 3.DISCUSSION AND CONCLUSION
The ADC value cannot be used to differentiate renal oncocytoma from low-grade CHRCC but can be used to differentiate oncocytoma from high-grade CHRCC.Acknowledgements
No acknowledgementsReferences
1. 2004 WHO classification of the renal tumors of the adults. Lopez-Beltran A, Scarpelli M, Montironi R, et al. Eur Urol. 2006;49:798-805.
2. Metastatic renal oncocytoma. Oxley JD, Sullivan J, Mitchelmore A, et al. J Clin Pathol. 2007 Jun;60(6):720-2.
3. Discriminant nuclear features of renal oncocytoma and chromophobe renal cell carcinoma. Analysis of their potential utility in the differential diagnosis. Tickoo SK, Amin MB. Am J Clin Pathol. 1998;110:782-7.
4. Imaging spectrum of renal oncocytomas: a pictorial review with pathologic correlation. Ishigami K, Jones AR, Dahmoush L, et al. Insights Imaging. 2015;6:53-64.
5. EAU guidelines on renal cell carcinoma: 2014 update. Ljungberg B, Bensalah K, Canfield S, et al. Eur Urol. 2015;67:913-24.
Figures
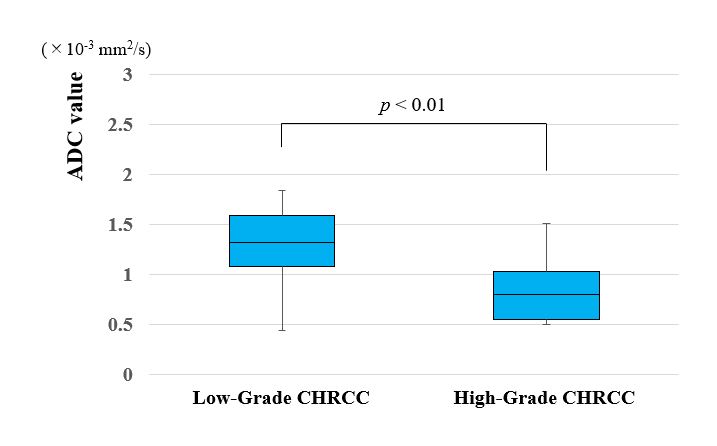
Figure 1. Comparison of ADC value between low-grade CHRCCs and high-grade CHRCCs.
Box-and-whisker plots show ADC value for low-grade CHRCCs and high-grade CHRCCs. Lower and upper hinges of the boxes denote the 25th and 75th percentiles, respectively. The median value (50th percentile) of each distribution is indicated by a line. Whiskers on either side extend to the most extreme data point. ADC was significantly higher for low-grade CHRCCs than for high-grade CHRCCs (p < 0.01).
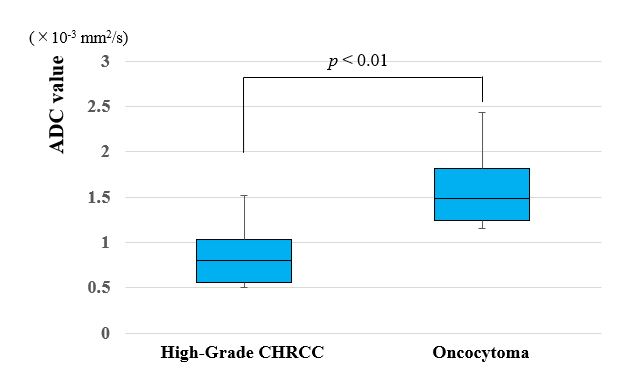
Figure 2. Comparison of ADC value between high-grade CHRCCs and oncocytomas.
Box-and-whisker plots show ADC value for high-grade CHRCCs and oncocytomas. ADC was significantly lower for high-grade CHRCCs than for oncocytomas (p < 0.01).
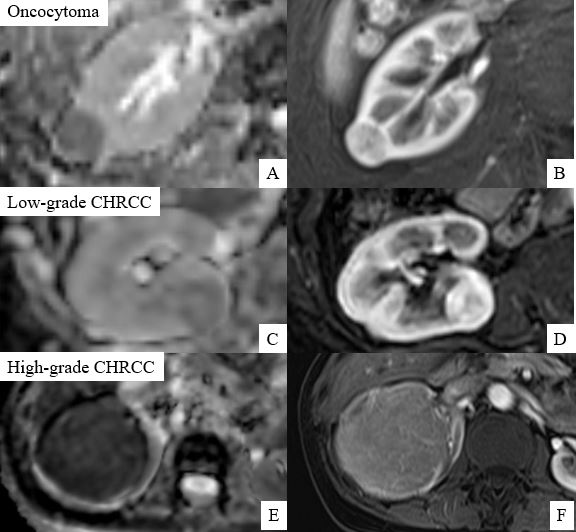
Figure 3. Representative cases of oncocytoma, low-grade CHRCC, and high-grade CHRCC
A, C, E. ADC map; B, D, F. dynamic MRI (cortico-medullary phase)