2451
Mean or Extremum? Comparison of Two Strategies to Extract Orientation-Dependent Texture Features in Radiomics Studies
Jing Zhang1, Yang Song1, Yu-dong Zhang2, Xu Yan3, Yefeng Yao1, and Guang Yang1
1Shanghai Key Laboratory of Magnetic Resonance, Department of Physics, East China Normal University, shanghai, China, 2Department of Radiology, The First Affiliated Hospital with Nanjing Medical University,, Nanjing, China, 3MR Scientific Marketing, Siemens Healthcare, shanghai, China
1Shanghai Key Laboratory of Magnetic Resonance, Department of Physics, East China Normal University, shanghai, China, 2Department of Radiology, The First Affiliated Hospital with Nanjing Medical University,, Nanjing, China, 3MR Scientific Marketing, Siemens Healthcare, shanghai, China
Synopsis
Texture features plays an important role in radiomics. To make the texture features rotation-invariant, pyradiomics computes the texture features along all directions and use their mean values. In this study, we demonstrated that maximum and minimum values of these features along different directions, which is also rotation-invariant, may provide added value to radiomics studies. We trained models using mean, maximum and minimum values of texture features along different directions to classify clinically significant (CS) prostate cancer (PCa) and non-CS PCa on PROSTATEx dataset. We found that using extremum instead of mean texture features improved the performance of model.
INTRODUCTION
Radiomics is a high-throughput method to extract features from medical images and associate them with clinical diagnosis and prognosis1. Radiomics have been used in cancer classification and prognosis with great success and texture features have been proved to be useful for the classification of many lesions2. Pyradiomics , an open-source toolbox for radiomics feature extraction, extracts texture features from 13 different directions and exports their mean values3. This spatial averaging makes the orientation dependent texture features rotation-invariant, thus more stable. However, if a texture feature is only prominent along certain direction, averaging will make the feature less conspicuous. Since the maximum and minimum values of the texture are also rotation-invariant and will not obscure features prominent along certain directions, we compared models built with mean, maximum and minimum values of texture features in this study.METHODS
Data: PROSTAETx data set (https://doi.org/10.7937/K9TCIA.2017.MURS5CL) was used in this study. PROSTATEx was a multi-parametric Magnetic Resonance Imaging (mp-MRI) dataset on prostate cancer acquired with Siemens 3T scanners, Modalities used in this study included T2W(TSE,0.5×0.5×3.6mm3),DWI(SSEP,2×2×3.6mm3,b=800s/mm2)and ADC map. 185 cases included 252 cancer lesions (CS/NCS=68/184) whose boundaries were marked by professional radiologists. We randomly selected 177 patients (CS/NCS= 48/129) as the training set and 75 patients (CS/NCS=20/55) as the independent test set for model evaluation.Texture Feature: We extracted gray level co-occurrence matrix (GLCM) and gray level run length matrix (GLRLM) features with 13 directions from all sequence images by pyradiomics on python3.6 (Figure 1). We calculated the mean, minimum and maximum values as texture features to build the respective models. To compare the effectiveness of mean and extremum values, we built models sole from mean values, maximum values and minimum values respectively and compared their performances.
Model building and evaluation: The workflow is illustrated in Figure 2. We applied recursive feature elimination (RFE) for feature selection, logistic regression (LR) for classification, and 5-fold cross-validation in the machine learning pipeline. The models were evaluated on the test dataset using receiver operating characteristic (ROC) curve and area under ROC curve (AUC).
RESULTS
AUC values of all models built with mean and extremum values are listed in Table 1. We found that for GLCM, the optimal classification model was built from mean features in DWI, with AUC of 0.744, and for GLRLM, the optimal model comes from maximum features in ADC, with AUC of 0.774.DISCUSSION
Many radiomics studies depend on pyradiomics toolbox for feature extraction. So mean values of the orientation dependent texture are mostly used. Using mean values makes these features rotation invariant so they no longer depend on the direction of the lesion or the patient being scanned. However, our experiments showed models built from mean values did not always perform best. At least, in our simplified experiments on PROSTATEx dataset, extremum values produced better models than mean values. Thus, extremum values may be included in the radiomics studies. It is understandable the using mean values is more powerful if the texture feature is distributed equally in all directions. It the texture feature is only prominent in one or a few directions, the use maximum values will be a better choice. For example, for 2D scan in MRI, the inter-slice resolution was lower than the intra-slice resolution, using extremum values of 3D texture features may be better than using mean values. The maximum value, minimum value and mean value all have their own unique characteristics, so we could compare those values of texture feature carefully for radiomics future studies.CONCLUSION
By comparing the models built solely from mean, maximum and minimum values of texture features along different directions, we found at least in certain cases, extremum values can be used instead of mean values for texture feature extraction. To get the optimal radiomics model for a specific problem, we need to wisely compare their performances and choose wisely.Acknowledgements
This project is supported by National Natural Science Foundation of China (61731009, 81771816).References
- Lambin, Philippe; Rios-Velazquez, Emmanuel; Leijenaar, Ralph; Carvalho, Sara; van Stiphout, Ruud G. P. M.; Granton, Patrick; Zegers, Catharina M. L.; Gillies, Robert; Boellard, Ronald (2012-03-01). "Radiomics: Extracting more information from medical images using advanced feature analysis". European Journal of Cancer.
- G. Litjens, O. Debats, J. Barentsz, N. Karssemeijer and H. Huisman. "Computer-aided detection of prostate cancer in MRI", IEEE Transactions on Medical Imaging 2014;33:1083-1092
- Van Griethuysen, J. J. M., Fedorov, A., Parmar, C., Hosny, A., Aucoin, N., Narayan, V., Beets-Tan, R. G. H., Fillon-Robin, J. C., Pieper, S., Aerts, H. J. W. L. (2017). Computational Radiomics System to Decode the Radiographic Phenotype. Cancer Research, 77(21), e104–e107.
Figures
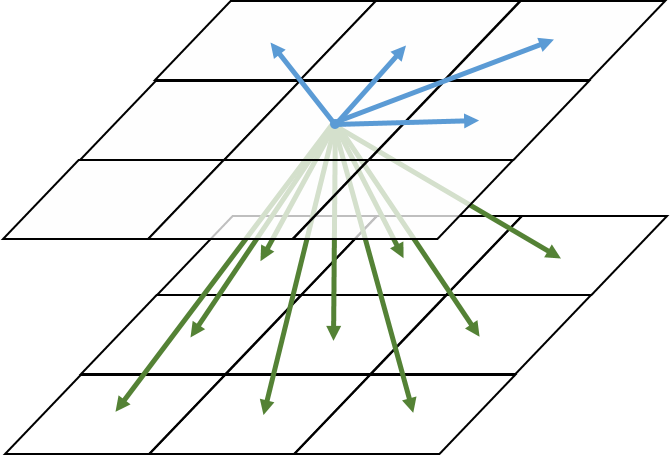
Figure 1 Texture features can be calculated along 13 directions: 4
in-plane directions, 9 inter-slice directions. To make the texture feature
rotation-invariant, mean value of 13 feature values are used in pyradiomics.
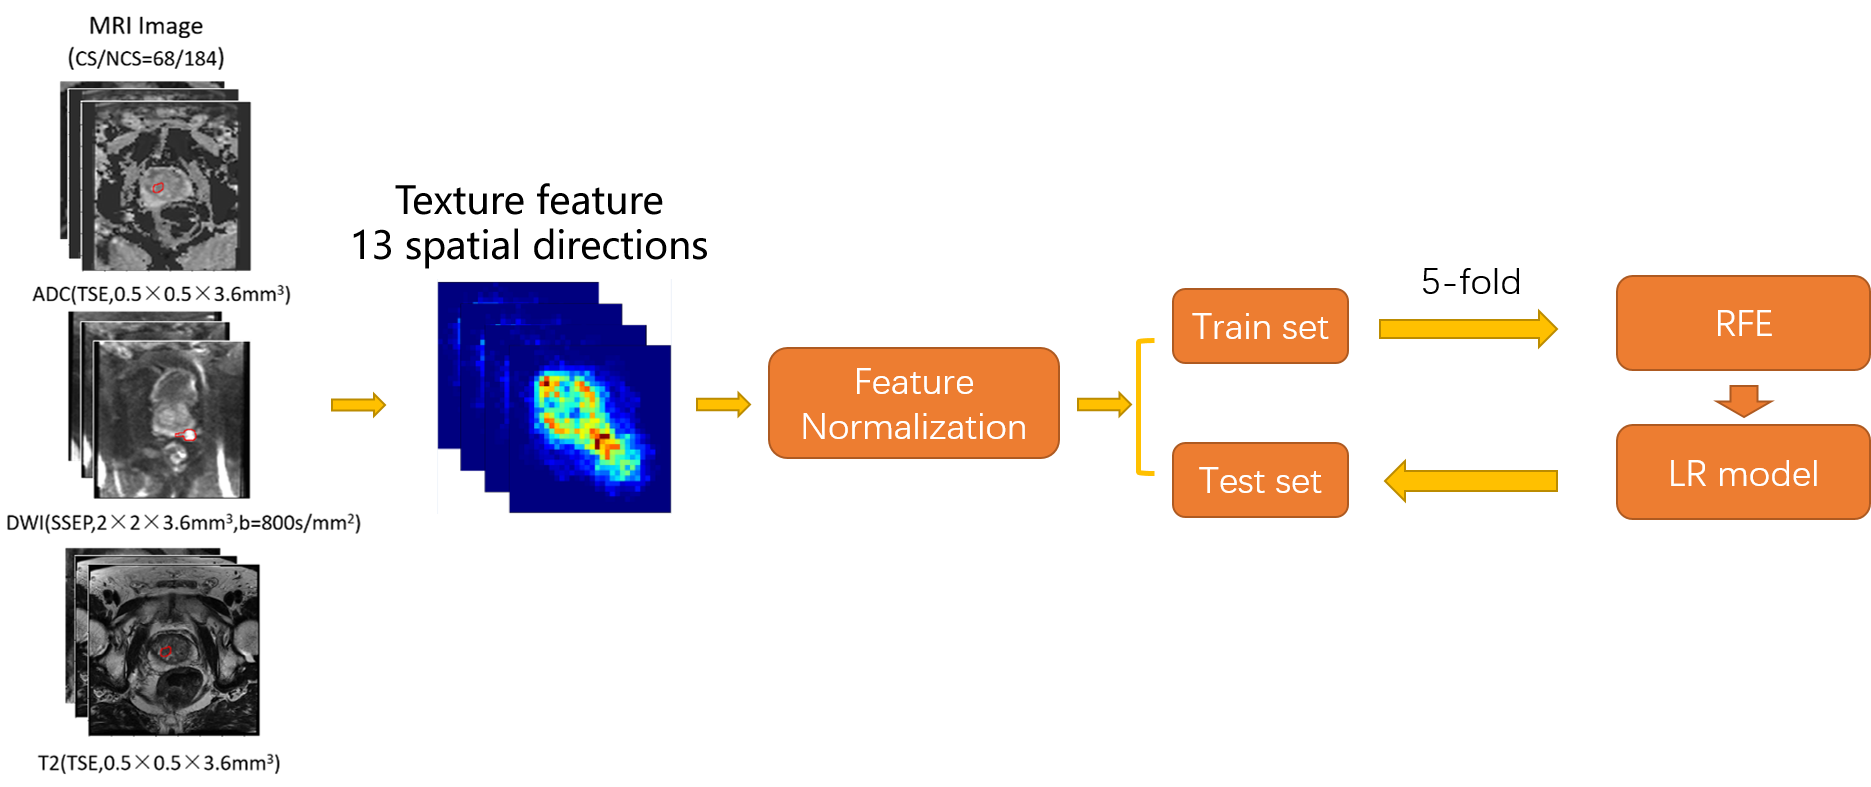
Figure 2
workflow for Analysis. It includes 2 main parts: the texture feature extracted
from original preprocess and classification model building.

Table
1 AUC
values in test cohort for models built with maximum, mean, and minimum values
of GLCM and GLRLM features of ADC, DWI and
T2 respectively.