2449
Automated diagnosis of prostate cancer from dynamic contrast-enhanced MRI using a Convolution Neural Network–based deep learning approach1Department of Radiology, Zhongnan Hospital of Wuhan University, Wuhan University,, Wuhan, China, 2Department of Radiology, Zhongnan Hospital of Wuhan University, Wuhan University, Wuhan, China, 3MR Collaborations, Siemens Healthcare Ltd, Shenzhen, China, 4Zhongnan Hospital of Wuhan University, Wuhan University, Wuhan, China
Synopsis
The aim of this study was to evaluate the diagnostic performance of a convolutional neural network (CNN)-based deep learning technique for the differentiation of prostate cancer (PC) using dynamic contrast agent–enhanced magnetic resonance imaging (DCE-MRI) data. Our patient study demonstrated that the quantitative image features derived from the DCE-MR images based on the self-defined CNN model can be effective in distinguishing PC from the normal, and the automated extraction of Ktrans, TDC, DR, and DY features can significantly promote PC diagnosis. The high performance of the proposed CNN-based deep learning method statistical analysis demonstrated its potential for improving PC diagnosis.
Purpose
The aim of this retrospective study was to evaluate the diagnostic performance of a convolutional neural network (CNN)-based deep learning technique for the differentiation of prostate cancer (PC) using dynamic contrast agent–enhanced magnetic resonance imaging (DCE-MRI) data [1-3].Materials and Methods
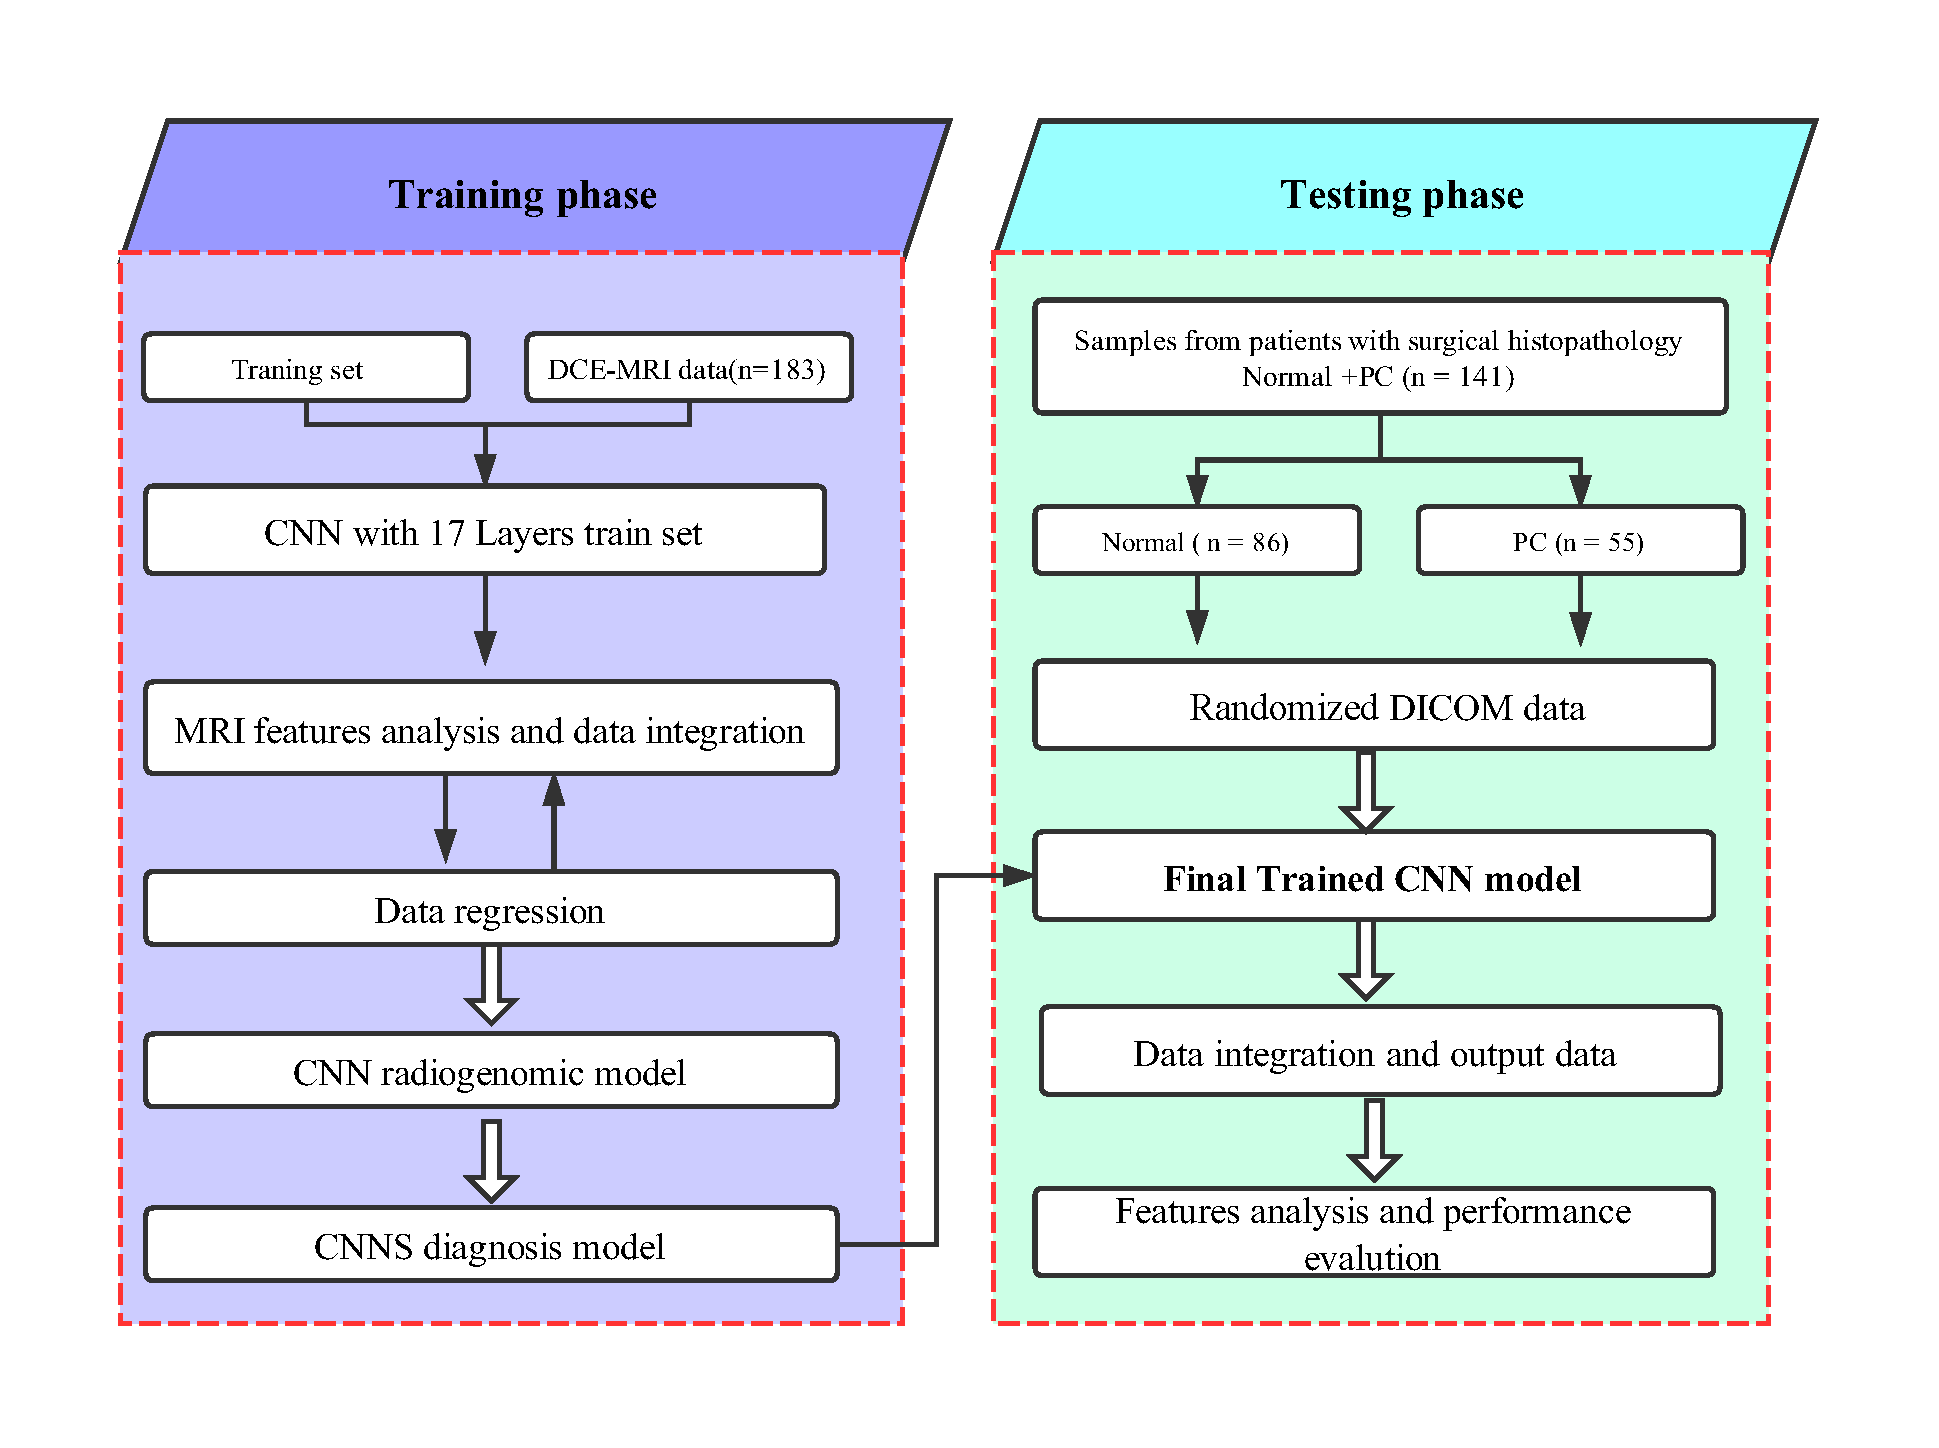
This study was HIPAA-compliant and approved by the local institutional review board. All the MR scans were performed on a 3T MAGNETOM Prisma scanner (Siemens Healthcare, Erlangen, Germany) with an 18-channel phased-array body coil coupled with a spine coil. Three hundred and twenty-four patients were enrolled and randomly divided into the training (n = 183, including 112 benign prostatic hyperplasia(BPH) and 71 PC) and testing (n = 141, including 86 normal and 55 PC) groups in this study. Axial free-breathing DCE-MR images of the entire prostate, in addition to T2-weighted images, T1-weighted images, and free-breathing DWI images, were acquired using T1 VIBE with the following scanning parameters: FOV= 260 × 260 mm2, TR/TE = 5.08/1.77 ms, slice thickness = 3 mm, flip angle = 15°, imaging matrix = 192 × 153, bandwidth = 260 Hz/Px, and acquisition time (TA) = 4.44 minutes. A user-defined CNN model was trained to detect the PC (Fig. 1), and a multi-parameter was validated. Fourteen parameters were extracted, including the transfer constant (Ktrans), rate constant (Kep), extravascular extracellular space (Ve), delay constant (DC), start time to enhance (STTE), time-to-peak (TTP), maximum inflow slope (MIS), average inflow slope (AIS), maximum outflow slope (MOS), average outflow slope (AOS), and tumor location. The spatial positional relationship between lesion centroid and image centroid was defined as DR, the distance from lesion centroid to the X-axis was defined as DX and to the Y-axis was defined as DY. All parameters were calculated and compared between the two groups by using an independent samples t test. The accuracy of the DCE MR imaging parameters derived from the CNN model with or without combination was analyzed using the receiver operating characteristic curve (ROC) and logistic regression analysis. The corresponding area under the ROC curve (AUC) and beta coefficient were also calculated.Results
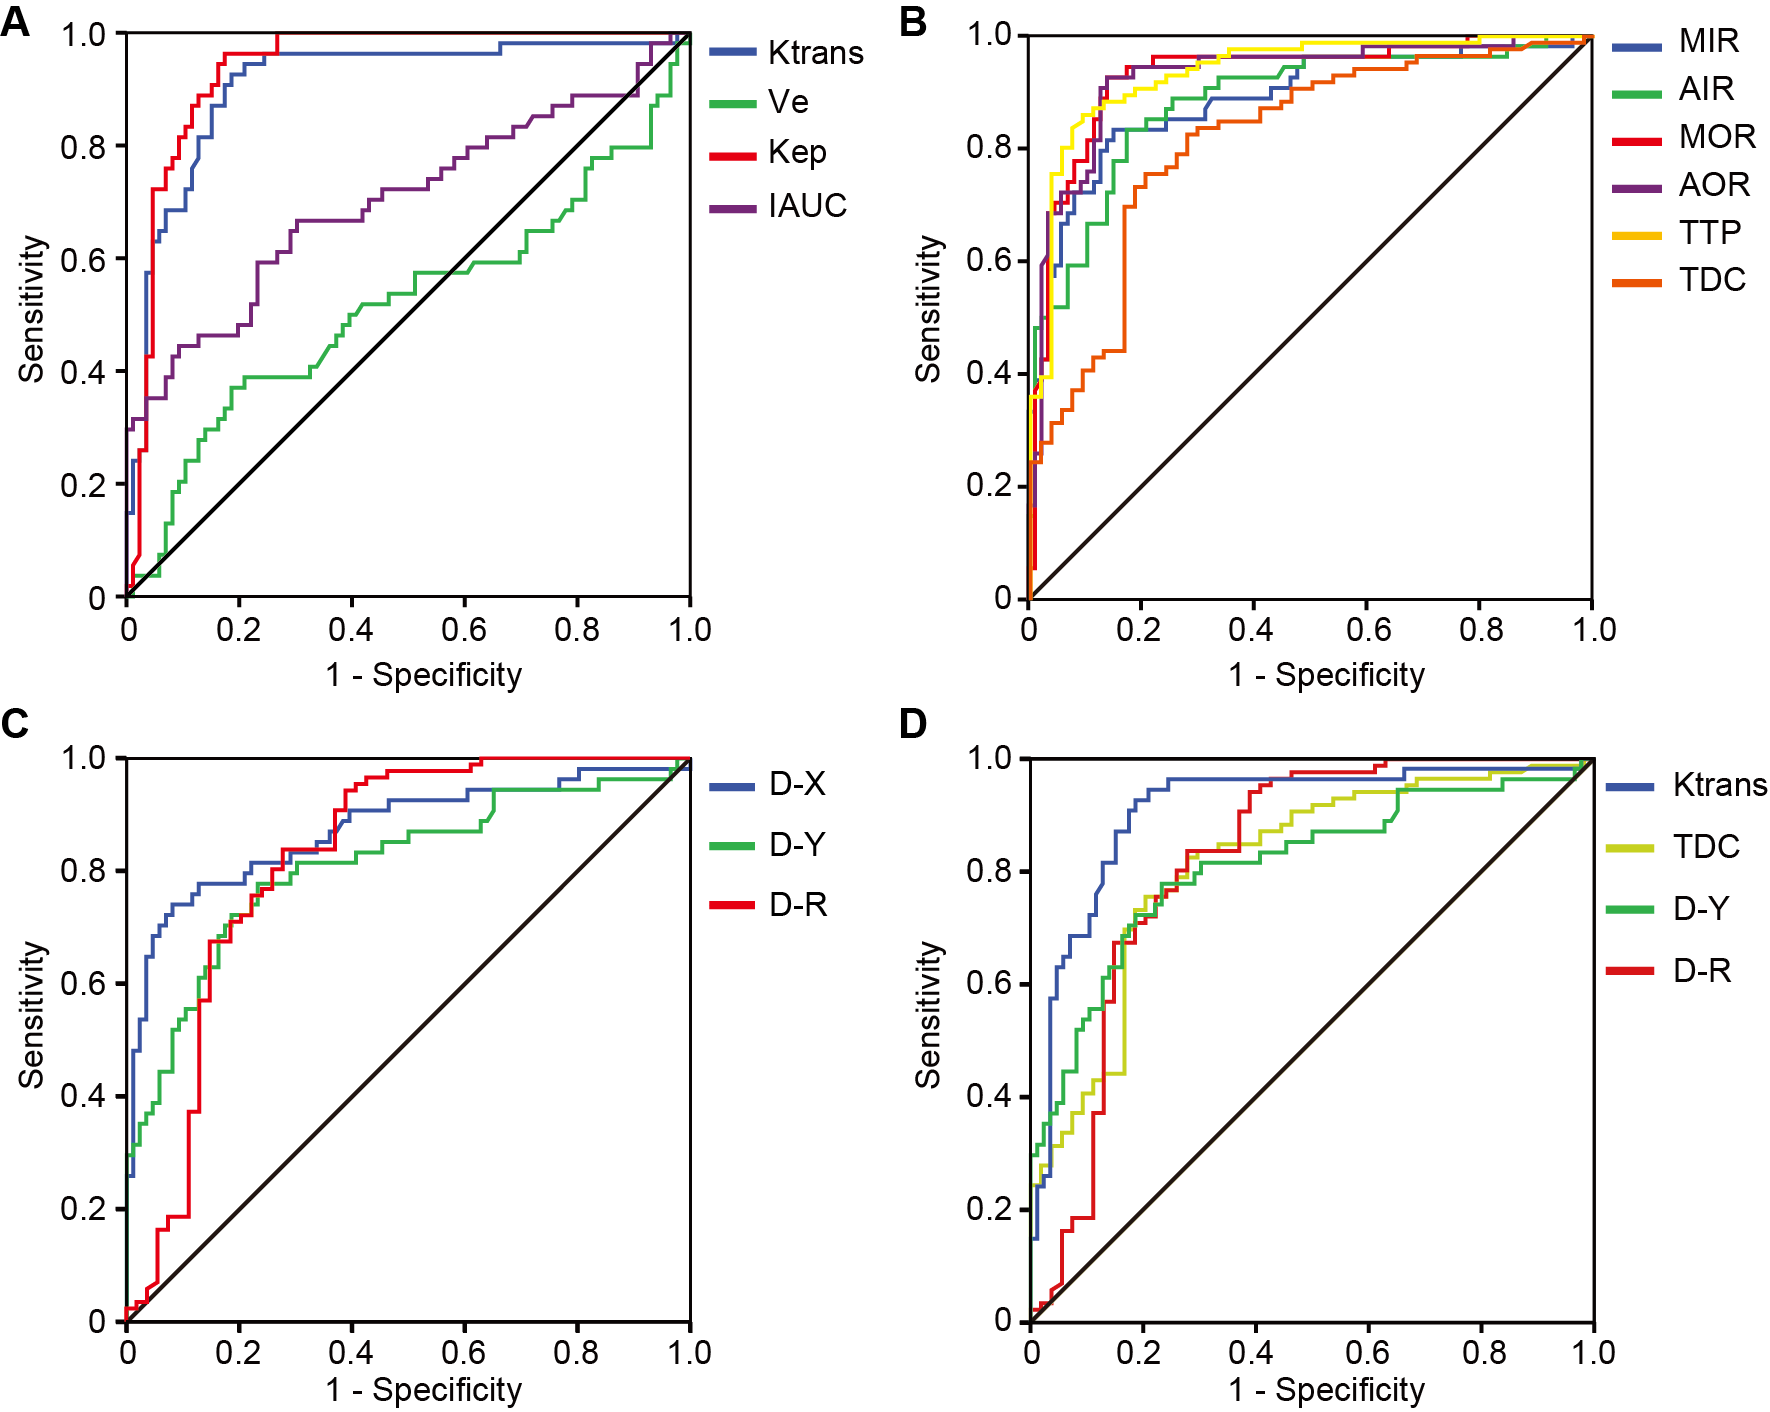
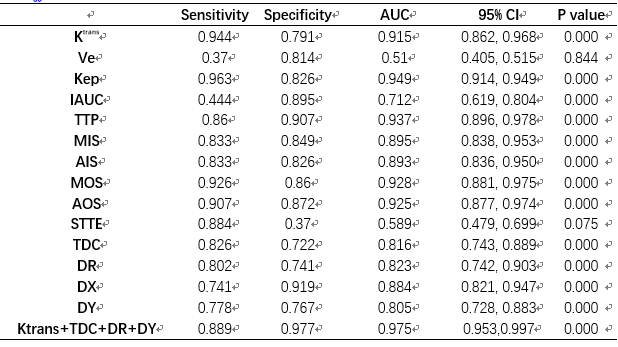
The differences of the Ktrans, Ve, Kep, IAUC, TTSE, TTP, MIS, AIS, MOS, AOS, TDC, DR, DX, and DY in differentiating PC from normal using the CNN model are summarized in Table 1. Here, it is notable that the Ve and TTSE parameters are no different in normal and PC; however, the other twelve parameters all show a difference in distinguishing PC from the normal (P < 0.05). The ROC and logistic regression showed that Ktrans, Kep, DR, and DY are significantly different; the AUC values of the four effective features were 0.915, 0.949, 0.823, and 0.805, respectively (Fig.2).Conclusion
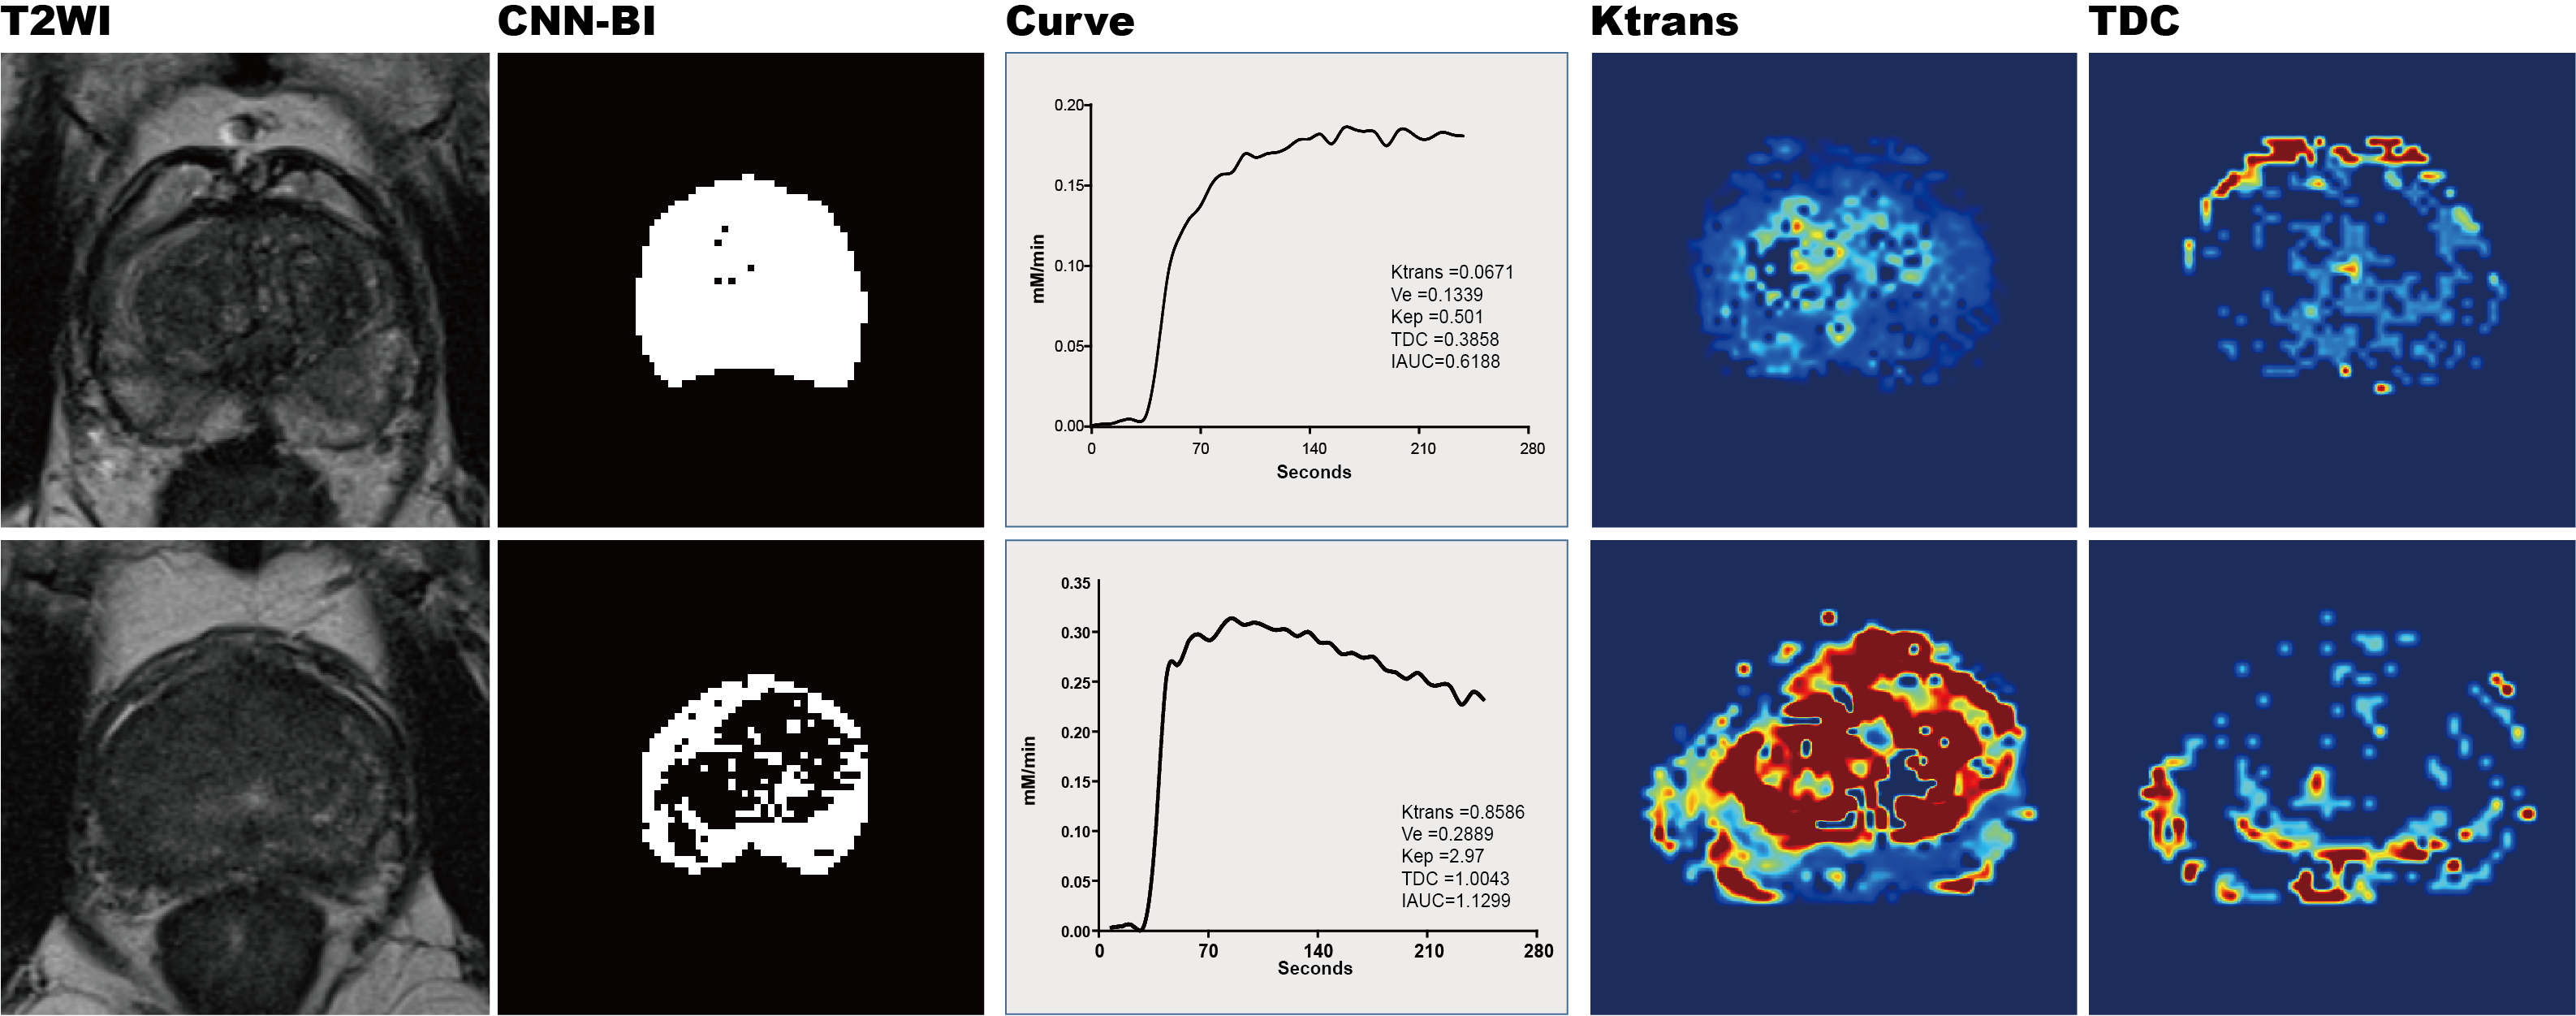
This study presented a CNN-based deep learning technique for the diagnosis of PC. Our preliminary patient study demonstrated that the quantitative image features derived from the DCE-MR images based on the self-defined CNN model can be effective in distinguishing PC from the normal, and the automated extraction of Ktrans, TDC, DR, and DY features can significantly promote the PC diagnosis. The high performance of the proposed CNN-based deep learning method statistical analysis demonstrated its potential for improving the PC diagnosis.Acknowledgements
The author(s) disclosed receipt of the following financial support for the research, authorship, and/or publication of this article.
This study has been supported by the National Natural Science Foundation of China (under Grant No. 81771819 and 815717344), National key research and development plan of China (Project 2017YFC0108803).
References
1. Elidrissi Errahhali M, Elidrissi Errahhali M, Ouarzane M, Boulouiz R, Bellaoui M. Cancer incidence in eastern Morocco: cancer patterns and incidence trends, 2005-2012. BMC Cancer. 2017;17(1):587.
2. Mazaheri Y, Akin O, Hricak H. Dynamic contrast-enhanced magnetic resonance imaging of prostate cancer: A review of current methods and applications. World journal of radiology. 2017;9(12):416-425.
3. Ishioka J, Matsuoka Y, Uehara S, et al. Computer-aided diagnosis of prostate cancer on magnetic resonance imaging using a convolutional neural network algorithm. BJU Int. 2018.
Figures