2447
Prostate cancer: Inter-reader Agreement and Diagnostic Performance with PI-RADS Version 2.1 at Multiparametric MRI
Li Zhang1, Longchao Li1, and Min Tang1
1Department of MRI, Shaanxi Provincial People’s hospital, Xi’an, China
1Department of MRI, Shaanxi Provincial People’s hospital, Xi’an, China
Synopsis
In 2019, the updated version of PI-RADS Version 2.1 was introduced. This version did not change the entire framework, but made several modifications to address limitations and simplify the scoring system. Between 442 patients, both readers had 96 discordant cases in terms of five-point Version 2.1 scoring. Version 2.1 provides high accuracy for detecting clinically significant PCa with category 4 as the threshold. Both readers have good inter-reader reliability. However, agreement for TZ was lower than for PZ lesions.
Purpose
In 2019, the updated version of PI-RADS Version 2.1 was introduced [1]. However, as a new scoring system, the clinical utility of Version 2.1 has not been validated. Thereby, the purpose of our study was to analyze whether PI-RADS Version 2.1 helps improve diagnostic accuracy and reduce inter-reader variability of prostate cancer (PCa) at Multiparametric MRI (mpMRI).Methods
In all, 442 consecutive patients underwent mpMRI at 3.0 T and subsequent systematic plus targeted biopsies were included. PSA value and the score of PI-RADS Version 2.1 based mpMRI were investigated. Two readers independently analyzed the images with PI-RADS Version 2.1. The inter-reader agreement was calculated using kappa statistics, and the diagnostic performance of PI-RADS Version 2.1 was analyzed in the area under of Receiver Operating Characteristic curve (AUC-ROC), sensitivity and specificity.Results
For cancer, the overall AUC was 0.908 for reader 1 and 0.897 for reader 2, respectively. For clinically significant PCa, the AUC was 0.942, 0.928 for reader 1 and reader 2, respectively. With PI-RADS Version 2.1 score≥4 as a threshold, the sensitivity and specificity were 94.3% and 77.7% for reader 1 and 92.2%and 76.6% for reader 2, respectively. ROC analysis showed that an AUC-ROC of 0.879 and 0.877(reader 1), 0.847 and 0.865 (reader 2) for the Peripheral Zone (PZ) and the Transition zone (TZ) lesions, respectively. The diagnostic concordance for PCa and clinically significant PCa was good (kappa=0.732-728). Inter-reader agreement for TZ lesions (kappa=0.633) was lower than for PZ (kappa =0.768).Discussion
The finding of our study revealed that Version 2.1 has an excellent level of inter-reader agreement (ICC 0.808(0.784-0.830).The inter-reader agreement using kappa coefficients was also good (k =0.728) for clinically significant PCa. Our results have shown that the new version of PI-RADS 2.1 allowed for good diagnostic performance in predicting PCa and clinically significant PCa. It was obvious that when we set Version 2.1 category of 4 as the best threshold, the current symptomatic method could achieve high sensitivity and specificity for both readers. These results support the idea that the new Version 2.1, as a more user-friendly tool, allows for comparable or better reproducibility in analyzing PCa than with the previous PI-RADS Version 1 or 2, or Likert scoring [2].Conclusion
It was demonstrated that used the PI-RADS Version 2.1 helps to rule out clinically significant PCa accurately. Version 2.1 score of 4 or greater seems to be associated with the presence of clinically significant PCa. Both readers have good inter-reader reliability, but the agreement for TZ lesions was lower than for PZ lesions. Prospective studies will be necessary to validate the clinical use of Version 2.1 in the future.Acknowledgements
No acknowledgement found.References
[1]Turkbey B, Rosenkrantz AB, Haider MA, et al. Prostate imaging reporting and data system version 2.1: 2019 update of prostate imaging reporting and data system version 2. Eur Urol 2019 Mar 18https://doi.org/10.1016/j.eururo.2019.02.033. [2]MoritzKS, Thomas LB, René A, et al. Assessment of PI-RADS v2 for the Detection of Prostate Cancer.Eur J Radiol 2016; 85:726-731.Figures
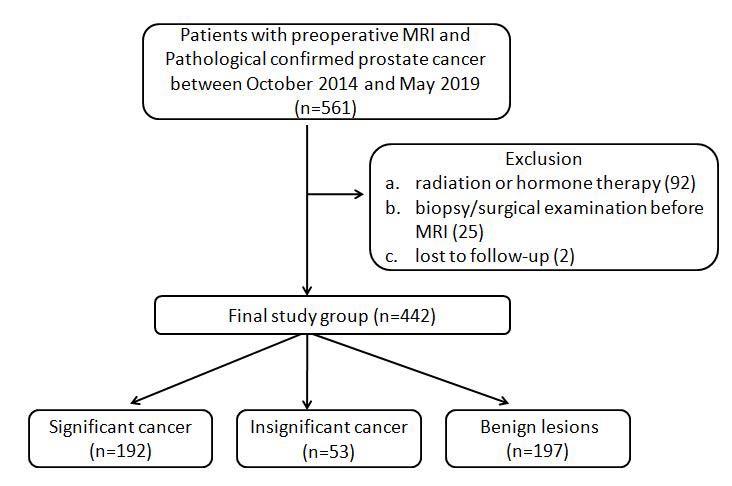
Figure
1. The flowchart of subject selection in this study.
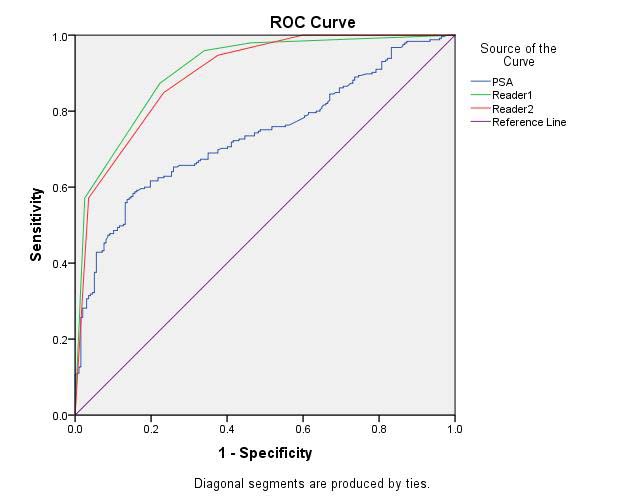
Figure 2.ROC curves. a. all
cancers
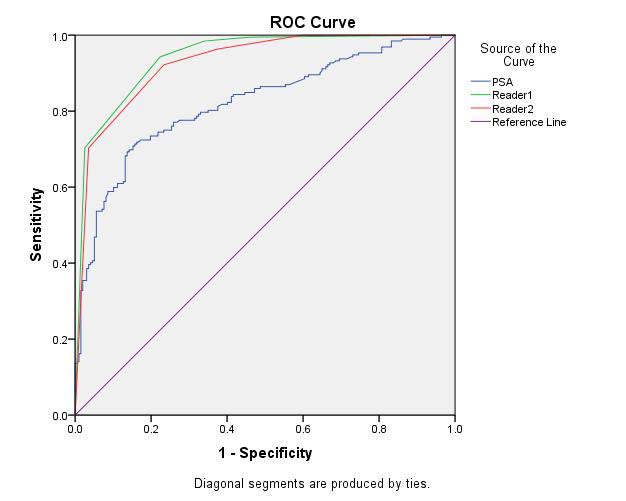
Figure 2.ROC curves. b. clinically significant cancers
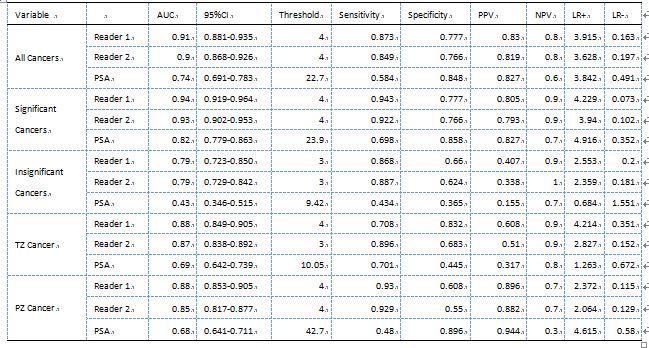
Table
1 AUC analysis
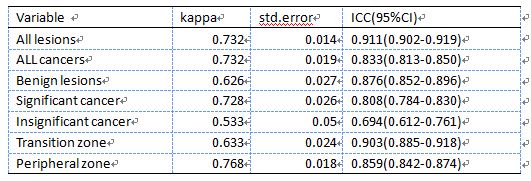
Table 2 Inter-reader reliability