2444
Quantitative Approach by the Simultaneous Acquisition of ADC and T2 Values Using Echo-Planar Imaging Sequence for Prostate Cancer Detection1Radiology, Kumamoto Saishun Medical Center, Kumamoto, Japan, 2Department of Medical Imaging, Faculty of Life Sciences, Kumamoto University, Kumamoto, Japan
Synopsis
We propose a sequence to simultaneously acquire apparent diffusion coefficient (ADC) and T2 values for detecting prostate cancer. ADC and T2 values of prostate cancer can simultaneously be acquired using not only a diffusion-weighted image, but also multiple echo time (TE) images without motion-probing gradient using echo-planar imaging (EPI). Moreover, the quantitative ADC and T2 maps can be produced in approximately 5 min. Combining ADC and T2 values was effective in differentiating between prostate cancer and the normal peripheral zone. Our rapid quantification imaging technique improves the accuracy of the diagnosis of prostate cancer.
Purpose
Multi-parametric magnetic resonance imaging (MRI) has become the standard for prostate cancer diagnosis.1), 2) Diffusion-weighted imaging (DWI) not only shows prostate cancer as a hyperintense lesion, but also simultaneously acquires the apparent diffusion coefficient (ADC) for quantitative assessment of prostate cancer. T2-weighted image (T2WI) shows prostate cancer as a hypointense lesion.3) A recent study reports that the use of T2 values is useful in prostate cancer detection.1),4) Generally, T2 values need to acquire images at multiple TEs using spin-echo (SE) imaging. Owing to the fact that SE images at multiple TEs take longer times, it is difficult to acquire T2 values of prostate in clinically acceptable times.4) The ADC value can be estimated using EPI images acquired with and without motion probing gradient (MPG) pulse. Moreover, the T2 value can be estimated by the EPI images acquired with the multiple TE without MPG pulse. By the combination of the EPI imaging at multiple conditions, ADC and T2 values can be simultaneously acquired in clinically acceptable times. Therefore, the purpose of this study was to evaluate the usefulness of sequence to enable simultaneous acquisition of ADC and T2 values in approximately 5 min for detecting prostate cancer.Materials and Methods
All examinations in this study were performed using a 1.5T whole-body clinical systems (Ingenia, Philips Healthcare, Best, The Netherlands). The study was approved by the local IRB, and written informed consent was obtained from all subjects.Phantom study
We employed a Multi CAGN Phantom (Kato Medience, Japan). T2 values of the phantoms ranged from 73.0 ms to 210.8 ms. First, the phantom was imaged using EPI and SE sequences, respectively. Imaging parameters of the EPI images were as follows: TR/TE (ms) = 5000/45, 70, 100, 130, 160, 200; FOV (mm) = 200; slice thickness (mm) = 4 mm; matrix size = 80 × 110; slices = 20; b value (s/mm2) = 0; scan time = 4 min 45 s. Imaging parameters of the SE images were as follows: TR/TE (ms) = 5000/30, 60, 90, 120, 150, 180, 210, 240; FOV (mm) = 300; slice thickness (mm) = 10 mm; matrix size = 128 × 128; slices = 1; scan time = 10 min 35 s. Next, the T2 value was calculated by mono-exponential fitting using a non-linear least squares regression analysis between the signal intensities and corresponding TEs using image processing software (MATLAB R2018b, Mathworks Inc., Natick, MA, USA) (Fig.1) according to the following equation:
$$S=S_{0}\exp\left(\frac{-TE}{T2}\right)$$
where T2 is the value of T2, So and S are the initial signal and signal at TE, respectively. Finally, the correlation between the T2 values for EPI images and the T2 values for SE images was analyzed by Pearson‘s correlation coefficient.
Cinical study
First, twenty-six patients (mean age; 74.8 years) with prostate carcinoma were scanned using the same imaging parameters of the EPI images as a phantom study. However, the ADC values have been estimated by images of b value = 0 and 1000 s/mm2 at TE = 70 ms. ADC maps were calculated on a pixel-by-pixel based software incorporated in the MR unit. Next, the T2 values of prostate cancer were compared to those of normal peripheral zone. Statistical analysis with Mann-Whitney U tests were performed to assess differences of T2 values. Finally, receiver operating characteristic (ROC) analysis was performed to determine cut-off values and to differentiate between prostate cancer and normal peripheral zone using ADC and T2 values. ROC curves were then plotted for analysis of optimal cut-off values of ADC and T2 values, defined by the Youden index.
Results
In the phantom study, T2 values for EPI images were significantly correlated with the T2 values for SE images (r = 0.993) (Fig.2). Figure 3 shows representative T2 and ADC maps acquired by EPI in the clinical study. The T2 value for the region of prostate cancer was significantly lower than that of the normal peripheral zone (p < 0.01). The ADC value for the region of prostate cancer was also significantly lower than that of the normal peripheral zone (p < 0.01) (Fig.4). The optimal cut-off values of ADC and T2 values for differentiating prostate cancer and normal peripheral zone were 1.314 × 10⁻³ mm2/s and 97.65 ms, respectively. Therefore, combining of ADC and T2 values was such that it was possible to differentiate between prostate cancer and normal peripheral zone (Fig.5).Discussion
The accuracy of the T2 measurement using EPI was not significantly different from the accuracy of conventional methods. ADC and T2 values were useful in prostate cancer detection in this study, respectively. However, there was an overlap between prostate cancer and normal peripheral zone on both ADC and T2 values. On the other hand, combining ADC and T2 values was effective in differentiating between prostate cancer and the normal peripheral zone. Therefore, our quantification method is useful in detecting prostate cancer because it enables the simultaneous acquisition of ADC and T2 maps within a feasible clinical acquisition time.Conclusion
Our proposed sequence facilitates the quantitative approach that combined ADC and T2 values in prostate cancer.Acknowledgements
No acknowledgement found.References
1). Langer DL, van der Kwast TH, Evans AJ, Trachtenberg J, Wilson BC, Haider MA. Prostate cancer detection with multi-parametric MRI: logistic regression analysis of quantitative T2, diffusion-weighted imaging, and dynamic contrast-enhanced MRI. J Magn Reson Imaging 2009;30(2):327–334.
2). Kayhan A, Fan X, Oommen J, Oto A. Multi‐parametric MR imaging of transition zone prostate cancer: imaging features, detection and staging. World J Radiol 2010; 2: 180–187.
3). Mazaheri Y, Hricak H, Fine SW, et al. Prostate tumor volume measurement with combined T2-weighted imaging and diffusionweighted MR: correlation with pathologic tumor volume. Radiology 2009;252:449–57.
4). Gibbs P, Tozer DJ, Liney GP, Turnbull LW. Comparison of quantitative T2 mapping and diffusion-weighted imaging in the normal and pathologic prostate. Magn Reson Med 2001; 46:1054 –1058.
Figures
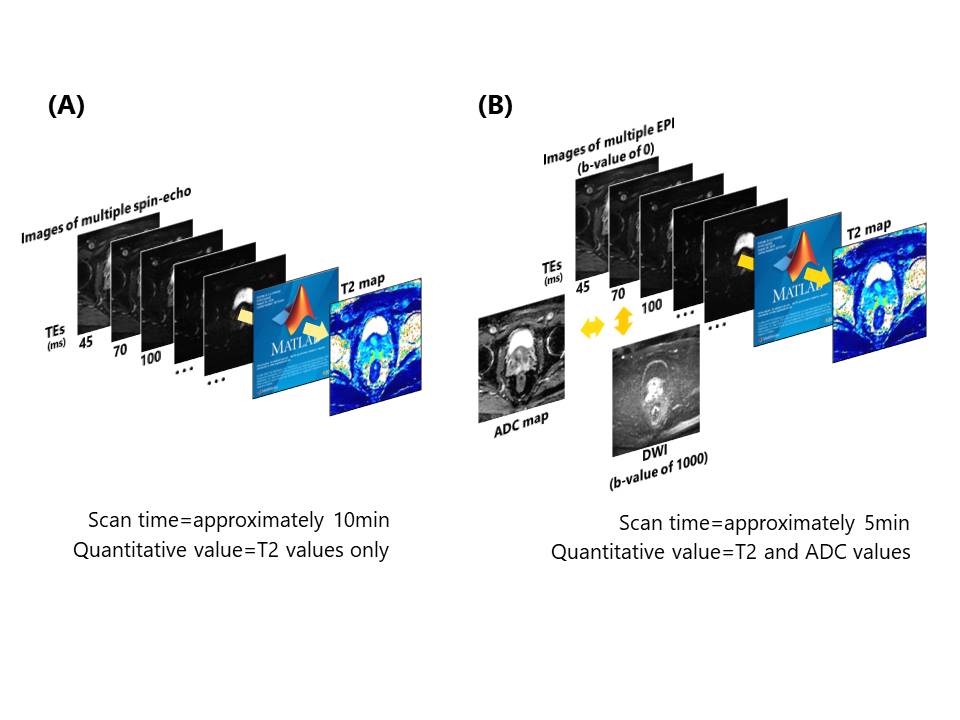
Fig.1 (A) Image processing of T2 map using SE images
(B) Image processing of T2 map using EPI images
Acquisition times of the T2 map using EPI images and T2 map using SE images are 5 min and 10 min, respectively. The quantitative value using SE images is the T2 values only. However, the quantitative values using EPI images are ADC and T2 values.
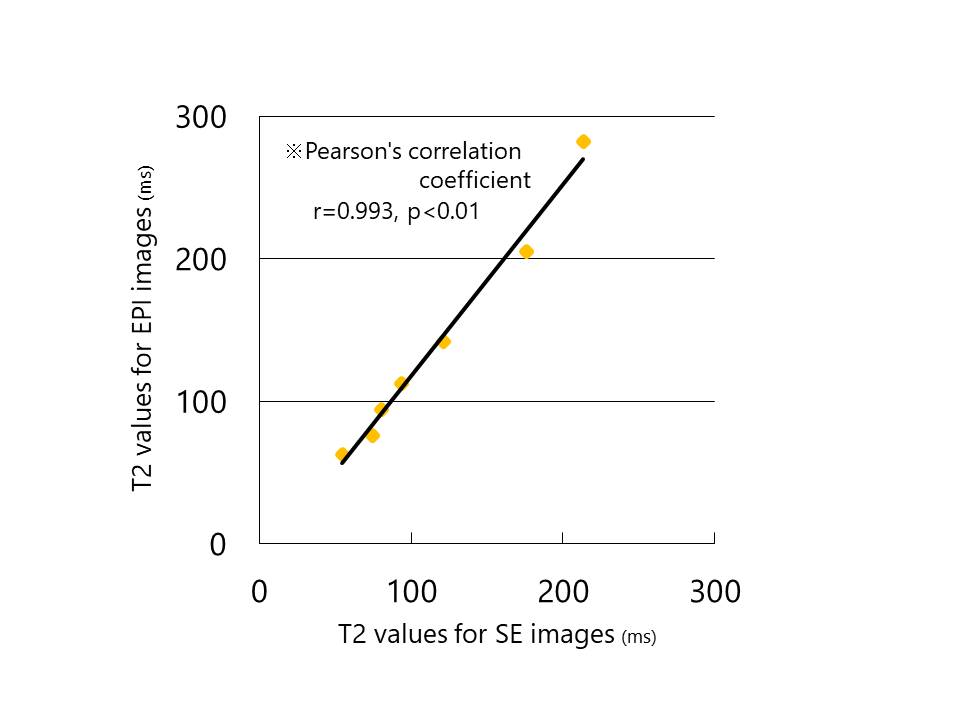
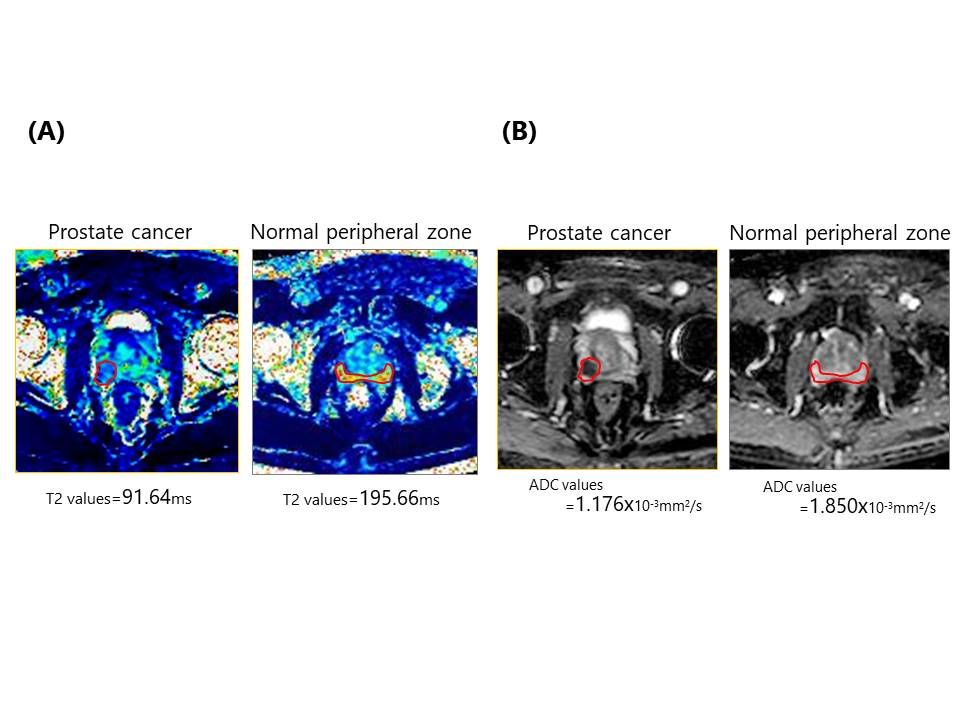
Fig.3 (A) T2 maps using EPI images
(B) ADC maps
T2 values of prostate cancer and those of normal peripheral zone were 91.64 ms and 195.66 ms, respectively. ADC values of prostate cancer and those of normal peripheral zone were 1.176 × 10⁻³ mm2/s and 1.850 × 10⁻³ mm2/s, respectively.
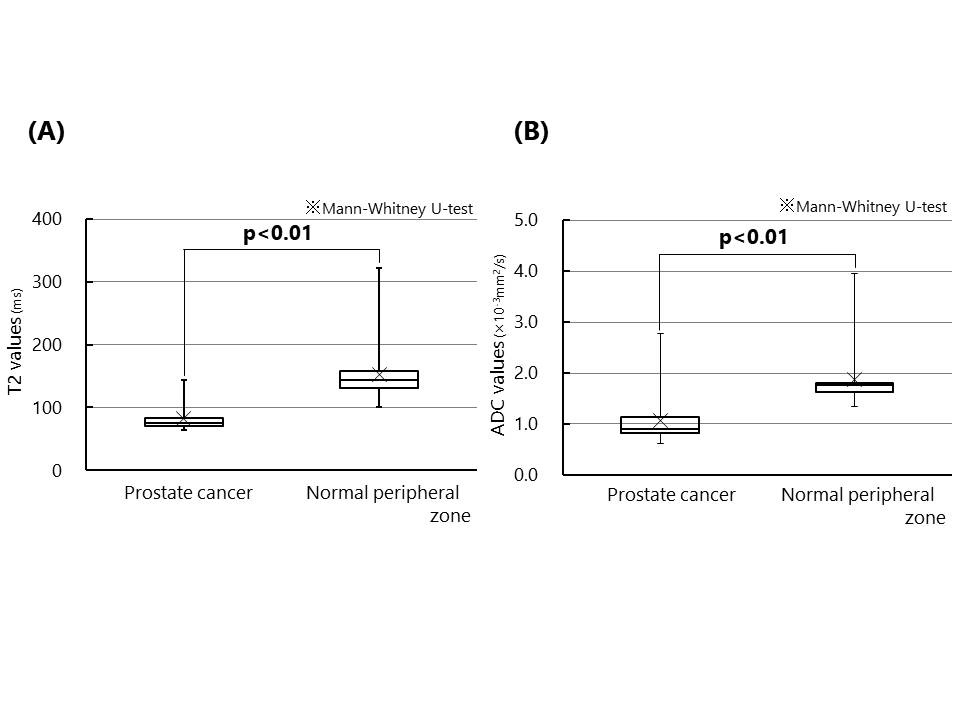
Fig.4 (A) Comparison with T2 values of prostate cancer and those of normal peripheral zone in quantification maps using EPI images.
(B) Comparison with ADC values of prostate cancer and those of normal peripheral zone in quantification maps using EPI images.
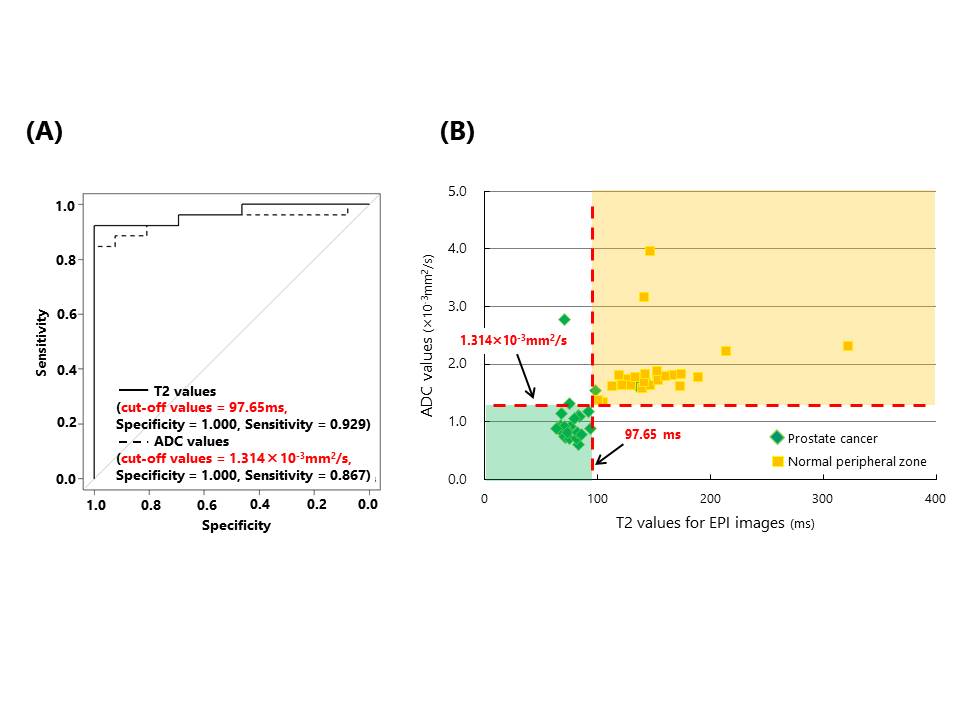
Fig.5 (A) ROC curves displaying the diagnostic performances of ADC and T2 values in the differentiation of prostate cancer and normal peripheral zone.
(B) Relationship of ADC and T2 values to quantitative diagnosis.