2440
IVIM-DKI analysis using Hybrid model with parameter reconstruction method in prostate cancer at 1.5T vs 3T MRI1Centre for Biomedical Engineering, Indian Institute of Technology Delhi, New Delhi, India, 2Department of Radiodiagnosis, All India Institute of Medical Sciences Delhi, New Delhi, India, 3Department of Physics, Indian Institute of Technology Delhi, New Delhi, India, 4Department of Nuclear Magnetic Resonance (NMR), All India Institute of Medical Sciences Delhi, New Delhi, India, 5Department of Biomedical Engineering, All India Institute of Medical Sciences Delhi, New Delhi, India
Synopsis
Currently in countries with poor resources availability of higher magnetic strength 3T MRI is low. Objective is to analyze whether with lower magnetic strength 1.5T MRI with advanced parameter reconstruction method can perform better or equivalent to 3T MRI. IVIM-DKI signal was modelled using hybrid (HY) model which produces non-physiological inhomogeneity in parameter map. This inhomogeneity can be corrected by using total variation penalty function (TV) with HY model. IVIM-DKI maps obtained from HY with TV produced more clinically reliable than HY model. Even with low magnetic strength i.e. 1.5T, overall HY+TV model outperformed qualitatively & quantitatively against 3T MRI results.
Introduction
Intravoxel incoherent motion and Diffusion kurtosis Imaging(IVIM-DKI) provides quantitative information on microstructural, microvasculature and heterogeneity in Prostate cancer(PCa)1,2. IVIM-DKI signal can be modelled using hybrid model(HY) which is combination of biexponential(BE) IVIM and DKI model3. Hybrid IVIM-DKI model suffers from two main challenges: Firstly, parameter map obtained from HY model are prone to local inhomogeneity which can be corrected using parameter reconstruction method such as Total Variation(TV)4 penalty function which provides adaptive spatial homogeneity by removing spurious values in the image3,5.Secondly, in countries with low resource settings such as India there is big problem against availability and accessibility of MRI with higher magnetic strength6. Most commonly used magnetic strength in prostate MRI are 1.5T and 3T, where latter provides high SNR and also suffers from artifact due to susceptibility and signal heterogeneity7. Therefore, our aim of this study is to evaluate differences in IVIM-DKI parameter maps obtained from 1.5T and 3T with parameter reconstruction method using TV. And to investigate whether 1.5T with parameter reconstruction(TV) and HY model can provide better or equivalent clinically interpretable parameter map.
Methods
Clinical Data acquisition: A total of 20 male patients with biopsy proven PCa were recruited, 10 patients(age: 63±4.83 years) were scanned in 1.5T MRI(Achieva; Philips Healthcare, Best, the Netherlands) and 10 patients(age:66.1±5.65 years) were scanned in 3T MRI(Ingenia; Philips Healthcare, Best, the Netherlands) at AIIMS, New Delhi, India, with a standard MRI protocol, including IVIM-DKI with 13b-values=0,25,50,75,100,150,200,500,800,1000,1250,1500,2000s/mm2 using phased-array surface coil(1.5T: TR=5.774s,TE=0.081s; 3T: TR=4.899s,TE=0.094s). T2-weighted imaging was also acquired on both the MRI system with TR=3.863s and TE=0.09s in 1.5T and TR=3.727s and TE=0.1s in 3T.Analysis: Parameter estimation in clinical data were performed using in-house toolbox in MATLAB. HY model is defined below3:
$$\frac{S}{S_0}=f\exp(-bD^{*} )+(1-f)\exp(-bD+\frac{1}{6} b^{2} D^{2} k)$$
where S and S0 are diffusion signals with and without diffusion gradient b in s/mm2, respectively. D, D*, f and k are molecular diffusion and pseudo-diffusion coefficient, perfusion fraction and kurtosis parameter respectively. All data were processed using both HY and hybrid-model+TV(HY+TV). Non-linear least square optimization was used for both HY and HY+TV. In HY+TV model, image gradient was obtained and this was used to update the parameter values with TV parameters(alpha and beta) set to 0.01 and 0.996.
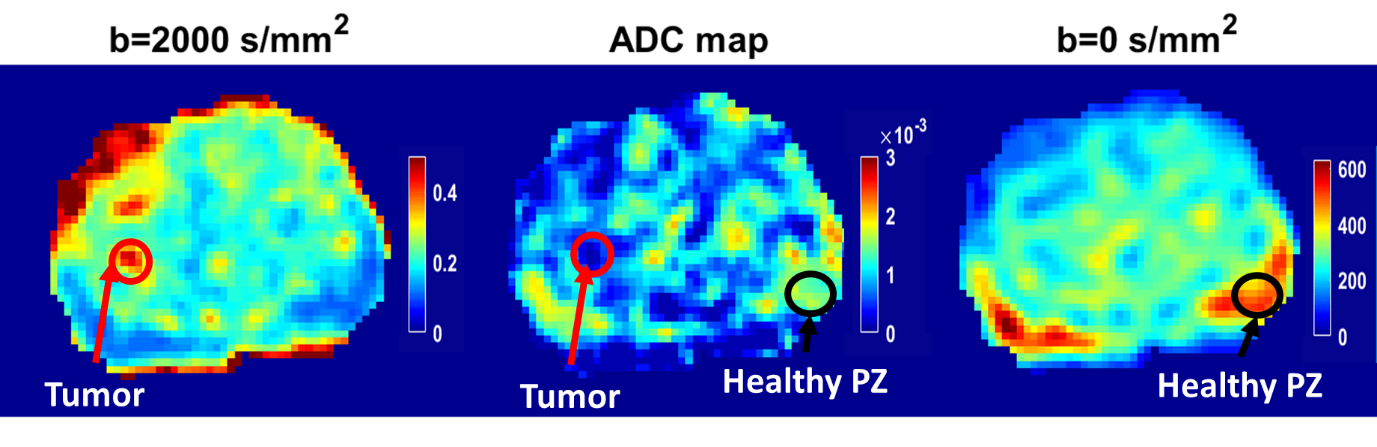
ROI localization: For tumor ROI, DWI at b=2000s/mm2 (hyperintense) and ADC map (hypointense) was used to localize tumor. Healthy peripheral zone(PZ) was drawn on b=0 s/mm2 image as shown in Figure1. Both the ROIs were validated by radiologist with three years’ experience on prostate.
Statistics: For estimating accuracy and precision of parameter maps, coefficient of variation(CV) for individual parameters and combined CV(CVcombined) for a method was obtained by averaging all CV of IVIM-DKI parameters. Two sample t-test(unpaired) for computation of any significant differences(p<0.05) between HY and HY+TV performance and 1.5T and 3T.
Results
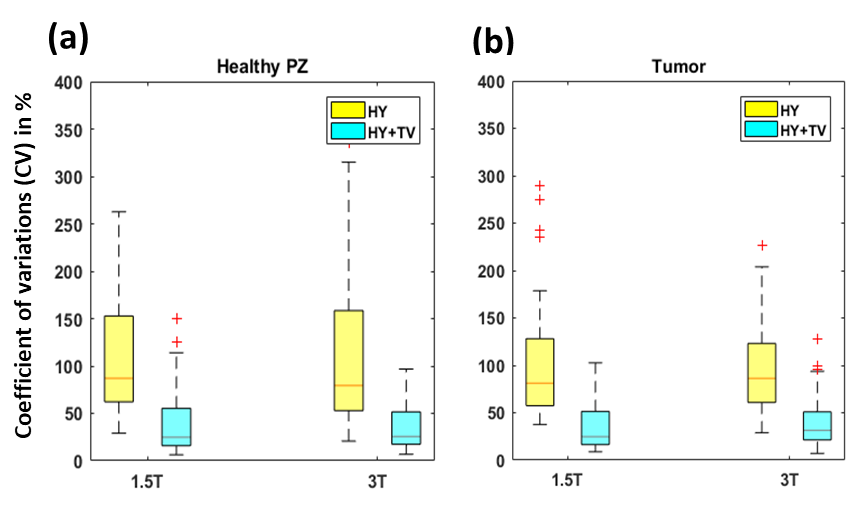
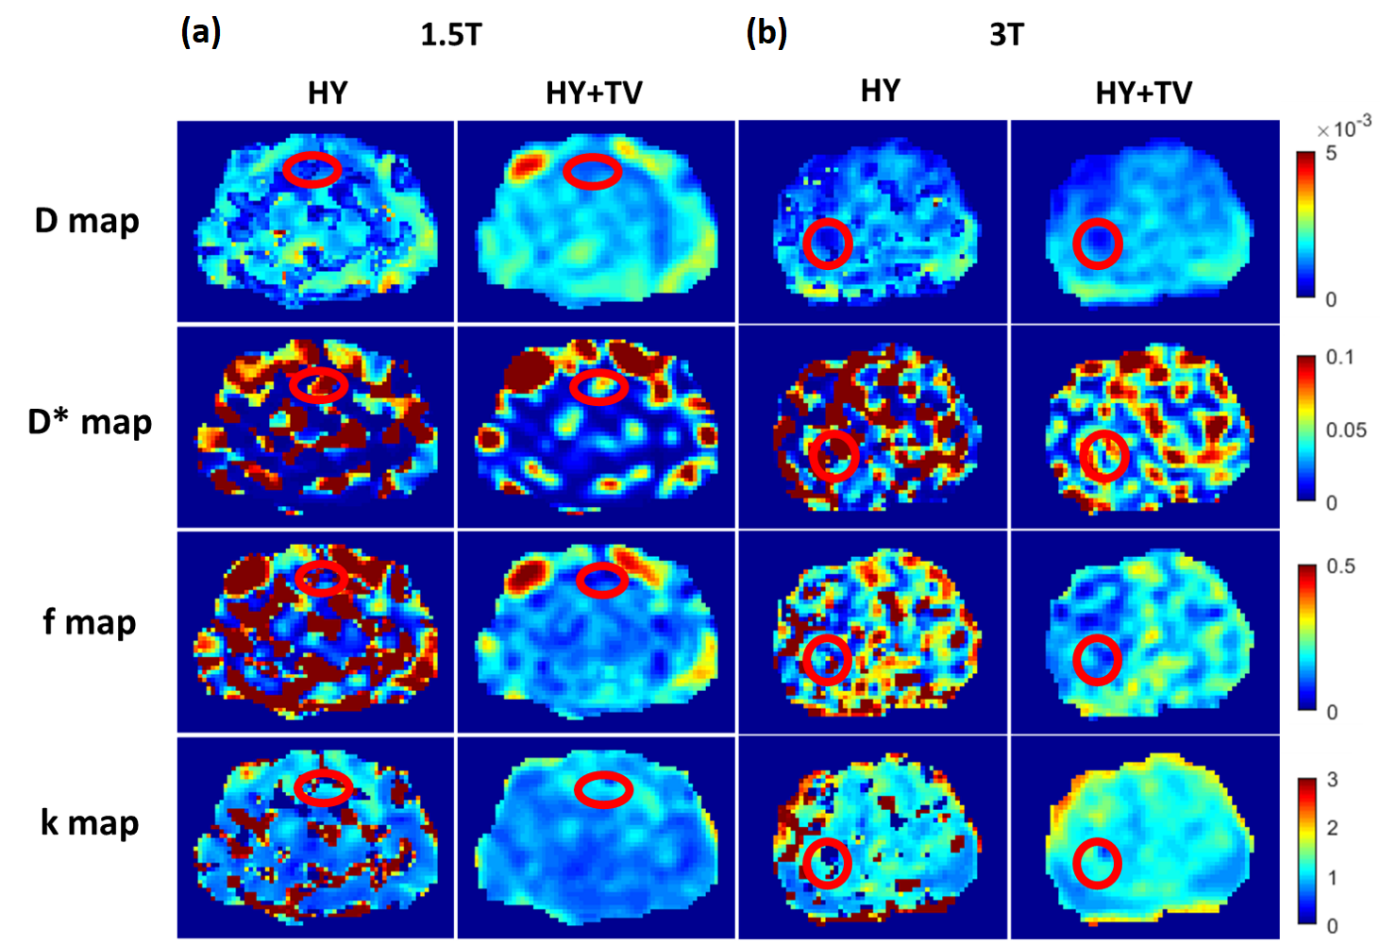
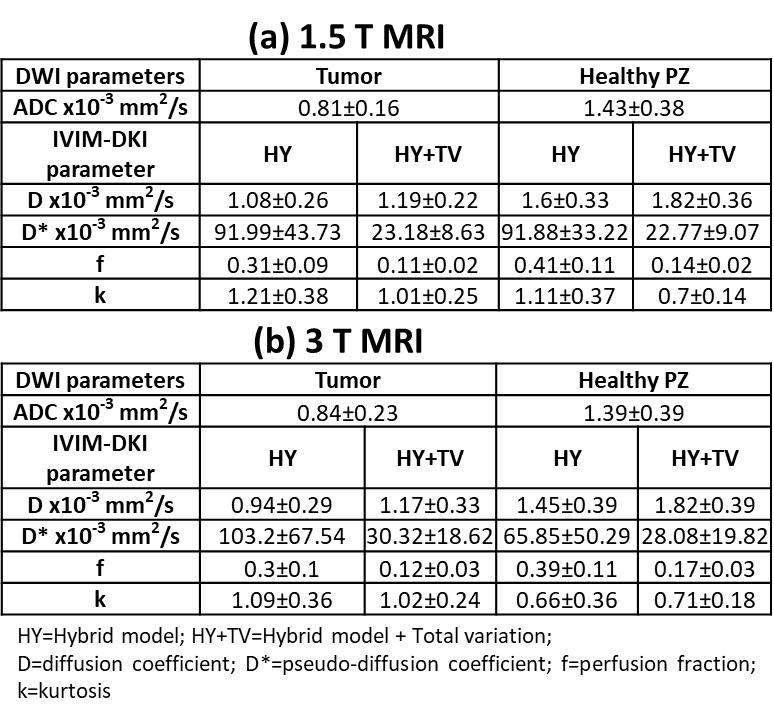
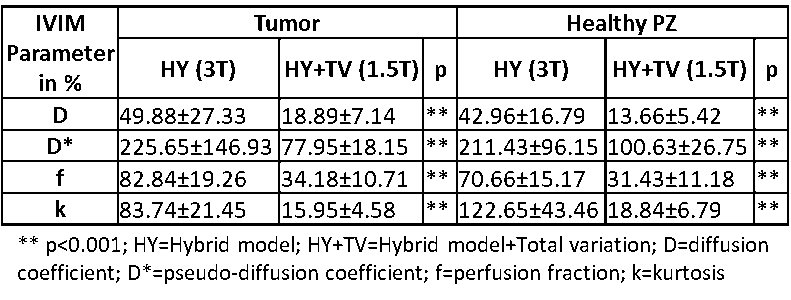
Performance of HY and HY+TV in 1.5T and 3TMRI: In tumor and healthy PZ region, HY+TV model showed low CVcombined by 106.23% and 111.54% decrease against HY model for 1.5T and 3T respectively as shown in figure2. Figure3 shows IVIM-DKI parameter maps of two representative patients with PIRADS 4 PCa. Qualitatively, parameter maps obtained from HY+TV model appear more homogenous with low spurious values in both 1.5T and 3T. Tumor in both 1.5T and 3T results appears hypointense in D and f map whereas in D* and k it appears hyperintense. Table1 shows in tumor, D*, and k parameters shows higher values, whereas D and f values are low in tumor against healthy PZ in both MRI.Comparison of performance between HY+TV model in 1.5T with HY model in 3T MRI: For 1.5T, HY+TV model showed low CVcombined as compared to HY model for 3T by 111.49% decrease with p<0.001. Even in parameter-wise comparision HY+TV model performed better using 1.5T IVIM-DKI images. For tumor region, D, D*, f and k parameter with HY+TV model(1.5T) showed lower CV by 49.42%, 225.21%, 82.39%, and 83.54% decrease against HY model(3T) respectively as shown in table2. Similar trend was observed for healthy PZ region with overall low CV of HY+TV model.
Discussion
IVIM-DKI images analyzed using hybrid model producing parametric map; which were susceptible to noise and had non-physiological inhomogeneity in 1.5T and 3T MRI. This was corrected by HY+TV with significantly lower CV in all IVIM-DKI parameters, as it reduces abrupt variations in parameter values for both MR strength systems. We demonstrated that even with low magnetic strength i.e. 1.5T, overall HY+TV qualitatively & quantitatively outperformed with clinical interpretable parameter maps and showed low CV as compared to 3T results with HY model.Quantitative values of parameter maps obtained from HY+TV model were comparable to literatures8–10. Hypointensity was observed in ADC, D and f parameter maps due to high cellularity in tumor causing obstruction in diffusion and perfusion. Whereas, k parameter showed hyperintense region due to high tissue heterogeneity in tumor. D* parameter showed very high CV obtained from both model and thus it becomes difficult to interpret the clinical utility.
Conclusion
Better clinical interpretability and accurate quantification of DWI-IVIM parameter maps, HY+TV might be used for diagnosis and planning surgery of prostate cancer patients. Accurate and comparable parametric maps can be obtained from 1.5T with HY+TV.Acknowledgements
This study was supported by IIT Delhi and AIIMS Delhi. AVM was supported by research fellowship fund from Ministry of Human Resource Development, Government of India.References
1. Le Bihan D. et al. Separation of diffusion and perfusion in intravoxel incoherent motion MR imaging. Radiology.1988;168:497–505.
2. Jensen J H, Helpern J A, Ramani A. et al. Diffusional Kurtosis Imaging : The Quantification of Non- Gaussian Water Diffusion by Means of Magnetic Resonance Imaging. Magn Reson Med.2005;1440:1432–1440.
3. Wu W C, Yang S C, Chen Y F, Tseng H M. et al. Simultaneous assessment of cerebral blood volume and diffusion heterogeneity using hybrid IVIM and DK MR imaging: initial experience with brain tumors. Eur. Radiol.2017;27:306–314.
4. Rudin L I, Osher S & Fatemi E. Nonlinear total variation based noise removal algorithms. Phys. D nonlinear Phenom.1992;60:259–268.
5. Kayal E B et al. Quantitative Analysis of Intravoxel Incoherent Motion (IVIM) Diffusion MRI using Total Variation and Huber Penalty Function. Med. Phys.2017;44:5849–5858.
6. Jankharia G R. Commentary-radiology in India: the next decade. Indian J. Radiol. Imaging.2008;18:189.
7. Mazaheri Y, Vargas H A, Nyman G et al. Image artifacts on prostate diffusion-weighted magnetic resonance imaging: trade-offs at 1.5 Tesla and 3.0 Tesla. Acad. Radiol.2013;20:1041–1047.
8. Zhang Y D. et al. The histogram analysis of diffusion-weighted intravoxel incoherent motion (IVIM) imaging for differentiating the gleason grade of prostate cancer. Eur. Radiol.2015;25:994–1004.
9. Shinmoto H. et al. An intravoxel incoherent motion diffusion-weighted imaging study of prostate cancer. Am. J. Roentgenol.2012;199:496–500.
10. Tamura C. et al. Diffusion kurtosis imaging study of prostate cancer: preliminary findings. J. Magn. Reson. Imaging.2014;40:723–729.
Figures