2439
T2 mapping-based the change trend of retrospective analysis of rectal cancer before and after chemotherapy1The First Affiliated Hospital of Dalian Medical University, Dalian, China, 2Philips Healthcare, Beijing, China
Synopsis
The current study aimed to investigate the value of T2 mapping in evaluating the difference of rectal cancer before and after chemotherapy. The results showed that T2 mapping had high diagnostic value in the two groups (AUC: 0.92; sensitivity: 100%; specificity: 80%).
Introduction
Rectal cancer is the third most common cancer and the second leading cause of cancer-related death in the world[1]. It's important for treatment to monitor the condition of patients in real time. T2 mapping is a quantitative MRI technology based on the combination of T2 magnetization preparation with steady-state free precession (SSFP) imaging[2], which had been used in detection of renal cell carcinomas and prostate cancer[3-4]. . Our study aimed to evaluate the change of T2 before and after chemotherapy for rectal cancer. We hypothesized that T2 mapping can be used to evaluate the efficacy of chemotherapy for rectal cancer.Materials and Methods
In this retrospective analysis, we enrolled 10 rectal cancer patients confirmed by pathology in our hospital, including 5 cases of rectal cancer before chemotherapy (3 male, 2 female; 68.20 ± 4.55) and 5 cases of after chemotherapy (4 male, 1 female; 67.60 ± 7.64). T1w MVXD, T2w SPAIR, DWI TRA (b=1200), and T2 mapping were performed on a 3.0T MR scanner (Ingenia CX, Philips) (Table 1). Based on the anatomical information on T2 images and the lesion shown on DWI, a radiologist selected ROIs on the axial slice showing the largest area of the malignant lesion in the rectum and outlined along the margin of the lesion. (Figure 1). Since the number of cases was relatively small, Mann-Whitney U test was used to calculate and analyze the difference between the two groups in SPSS (IBM). ROC analysis was performed to analyze the value of T2 mapping in the differential of rectal cancer before and after chemotherapy.Result
T2 values of the lesions were 89.85±10.62ms and 76.50±6.98ms before and after chemotherapy, respectively and there was a significant difference between the two groups (P = 0.028) (Table 2). The area under the curve (AUC) of T2 for differentiating rectal lesions of before and after chemotherapy was 0.92 with sensitivity of 100% and specificity of 80% and the feasible threshold was 78.69 (Figure 2).Discussion
The study showed T2 mapping had a high ability to distinguish rectal cancer before and after chemotherapy. The T2 value in rectal cancer was significantly higher before chemotherapy. Proliferation of fibrous tissue will appear after chemotherapy in rectal cancer. And fibrous scar lesions had low signal on T2 imaging, which may be related to the lower value of lesions in T2 mapping after chemotherapy[5]. Our results suggest that T2 mapping can be attempted for patient monitoring for rectal cancer in future studies.Conclusion
In conclusion, T2 value in rectal cancer was significantly decreased after chemotherapy. T2 mapping can be used for patient monitoring using chemotherapy for rectal cancer in future studies.Acknowledgements
No acknowledgment found.References
[1] Siegel Rebecca L,Miller Kimberly D,Fedewa Stacey A et al. Colorectal cancer statistics, 2017.[J] .CA Cancer J Clin, 2017, 67: 177-193.
[2] Huang TY, Liu YJ, Stemmer A, Poncelet BP: T2 measurement of the human myocardium using a T2-prepared transient-state TrueFISP sequence. Magn Reson Med. 2007, 57: 960-966. 10.1002/mrm.21208.
[3] Adams Lisa C,Bressem Keno K,Jurmeister Phillipp et al. Use of quantitative T2 mapping for the assessment of renal cell carcinomas: first results.[J] .Cancer Imaging, 2019, 19: 35.
[4] Sabouri Shirin,Chang Silvia D,Savdie Richard et al. Luminal Water Imaging: A New MR Imaging T2 Mapping Technique for Prostate Cancer Diagnosis.[J] .Radiology, 2017, 284: 451-459.
[5] Yoshida H,Suzuki M,Unno M et al. [A study of liver metastasis from colorectal cancer in which hepatic resection was performed after hepatic arterial infusion chemotherapy].[J] .Nihon Shokakibyo Gakkai Zasshi, 2000, 97: 1252-60.
Figures
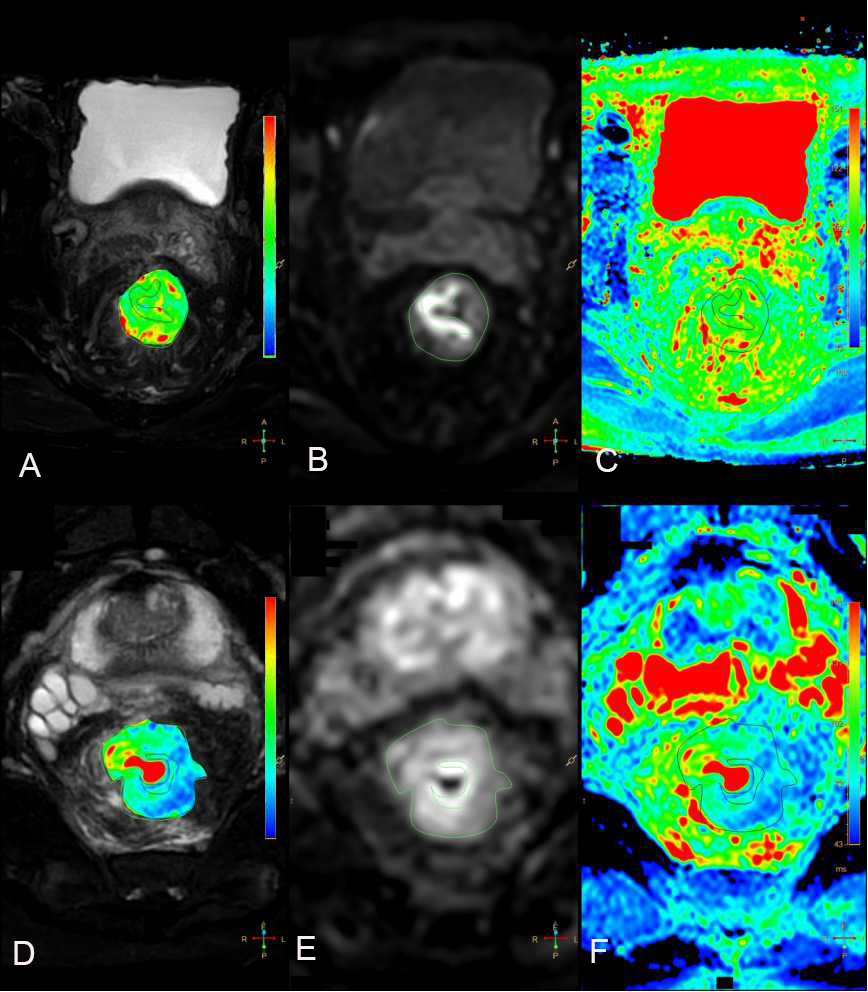
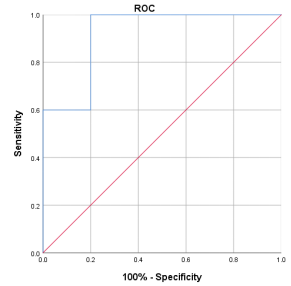
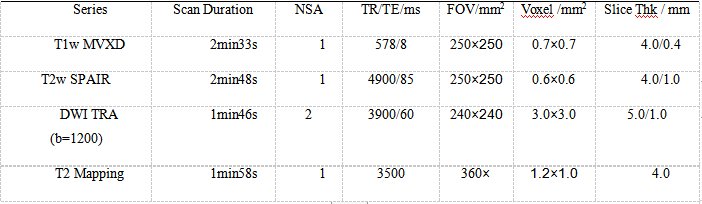
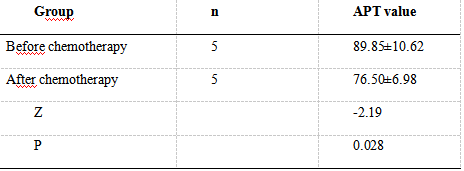
Table 2. Comparison of T2 mapping between before and after chemotherapy in rectal cancer (x±s)
*P<0.05 was considered statistically significant different