2434
Value of texture analysis based on DWI with multiple b-values for evaluation of tumor heterogeneity in rectal cancer patients1Department of Radiology, the First Affiliated Hospital of Dalian Medical University, Dalian, China, 2Philips Healthcare, Beijing, China
Synopsis
Rectal cancer is the third most common cancer and the second cause of cancer-related death worldwide. DWI is now recommended as a routine addition to the MRI protocol for the assessment of rectal cancer. However, the effect of the b-value on the diagnostic performance has not yet been explored. The current study aims to evaluate the value of texture analysis based on DWI with different B values to evaluate the heterogeneity of rectal cancer patients. The skewness and kurtosis were all significantly different in DWI with different B values, and they were obviously changed when B reached 800.
Introduction
Rectal cancer is the third most common cancer and the second cause of cancer-related death worldwide [1]. The heterogeneity of rectal cancer has been identified as one of the important prognostic factors, although it was difficult to evaluate the heterogeneity of the whole tumor. DWI is a non-invasive method for detecting the diffusion of water molecules in living tissues. This sequence provides indirect information about cell density and about the integrity of cell membranes in the area of interest[2]. Texture analysis achieved the conversion of medical images to quantitatively mineable data to describe characteristics from imaging[3]. We hypothesize that it’s feasible to evaluate tumor heterogeneity in rectal cancer patients using texture analysis based on multiple high b-values DWI images.Materials and Methods
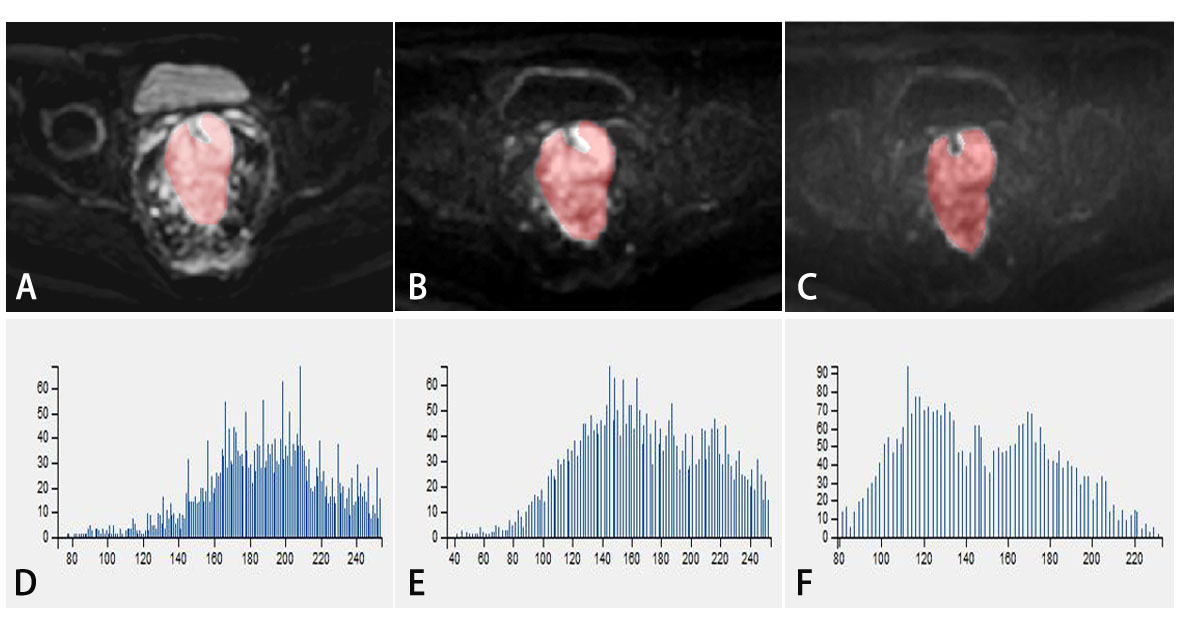
Between May 2019 to September 2019, a total of 18 consecutive patients who were pathologically confirmed as rectal cancer underwent a preoperative MR imaging examination with multiple b-values DWI sequence at our institution. All patients were examined on a 3.0 T MRI system (Ingenia 3.0T CX; Philips Healthcare, Best, the Netherlands), including routine pelvic scanning (T1WI, T2WI, and dynamic contrast-enhanced MR imaging) and additional multiple b-values DWI sequence (b values = 0, 20, 50, 100, 150, 200, 400, 800, 1200, 2000, 3000 (s/mm2). On the IntelliSpace Portal (Philips Healthcare), the multiple high b-values DWI images (b values = 0, 20, 50, 100, 150, 200, 400, 800, 1200, 2000, 3000 (s/mm2), respectively) were exported as DICOM formats. The DICOM files were postprocessed by Omni-Kinetics software (GE Healthcare) for ROI sketching and texture feature analysis. The radiologist (with 5 years of experience in abdominal radiology), who was blinded to the clinical and histopathological information, reviewed the MR images and manually outlined the region of interests (ROIs) at the maximum slice of the lesion on axial DWI images with b= 0, 20, 50, 100, 150, 200, 400, 800, 1200, 2000, 3000, respectively. The texture parameters including skewness, kurtosis, uniformity, energy and entropy were derived from multiple b-values DWI images. SPSS (version 20.0 for Windows, IBM Corporation, USA) was used for statistical analysis. The One-Way ANOVA or Kruskal-Wallis test was used to compare the above texture parameters between the groups with different b-values. P < 0.05 was considered to indicate statistical significance.Results
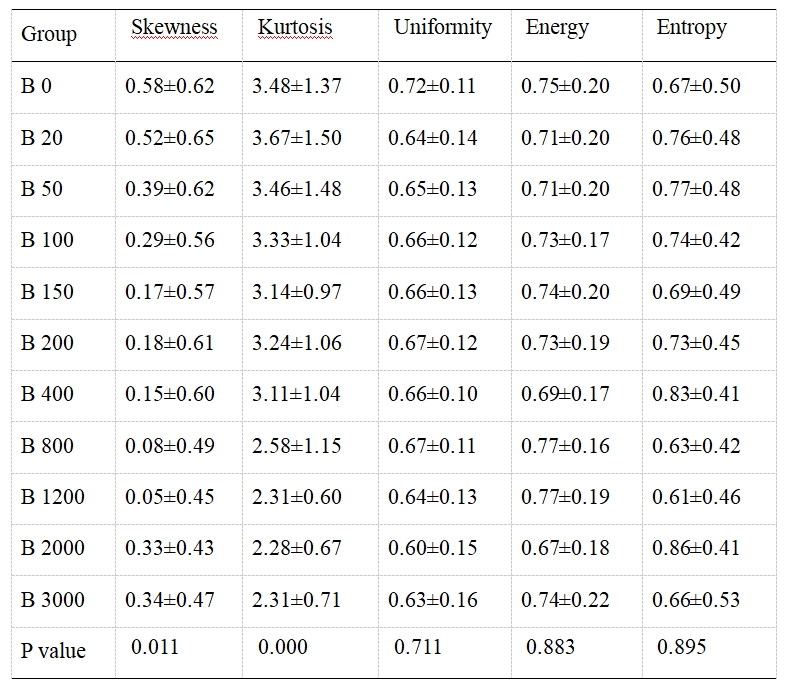
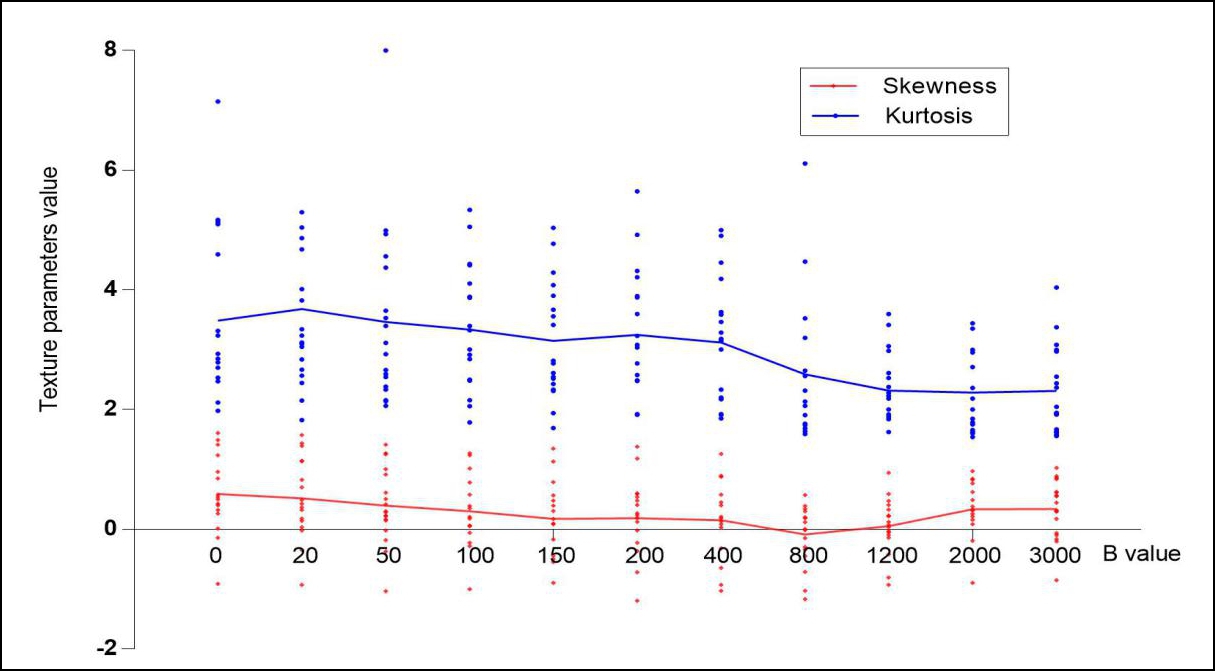
Skewness was significantly different in different b values of DWI maps (P=0.011). When b reached 800, the skewness reached the lowest value, and then it ascended slowly. The skewness on b800 DWI was significantly different with that of b2000 and b 3000 DWI (P=0.025, 0.024, respectively). The kurtosis was also significantly different in different B values of DWI maps (P=0.000). When b reached 800, the descending slope of kurtosis curve was the largest, and then its change was not obvious (Table 1). Figure 1 shows the curves of skewness and kurtosis on DWI with different b values. There were no significant difference in uniformity, energy and entropy of multiple b-values DWI images.Discussion and Conclusion
Texture analysis based on DWI maps with different b values can serve as a preoperative and non-invasive method for evaluating heterogeneity of rectal cancer. The skewness and kurtosis were all significantly different in different b values of DWI maps, and they were obviously changed when b reached 800.Acknowledgements
No acknowledgement.References
[1] Siegel RL, Miller KD, Fedewa SA, Ahnen DJ, Meester RGS, Barzi A, et al. Colorectal cancer statistics, 2017. Ca A Cancer Journal for Clinicians (2017) 67(3):104-117. doi: 10.3322/caac.21395
[2] Pi S, Cao R, Qiang J W, et al. Utility of DWI with quantitative ADC values in ovarian tumors: a meta-analysis of diagnostic test performance[J]. Acta Radiologica, 2018:028418511875970
[3] Aerts Hugo J W L., Velazquez Emmanuel Rios., Leijenaar Ralph T H., Parmar Chintan., Grossmann Patrick., Carvalho Sara., et al. Decoding tumour phenotype by noninvasive imaging using a quantitative radiomics approach. Nat Commun (2014) 5: 4006. doi: 10.1038/ncomms5006
Figures