2433
Comparative study of APTw combined with T2 mapping quantitative imaging in patients of rectal cancer with and without chemotherapy1Radiology, The First Affiliated Hospital of Dalian Medical University, Dalian, China, 2Philips Healthcare, Beijing, China
Synopsis
Amide proton transfer-weighted (APTw) imaging can be used to assess changes of intracellular protein concentration and the pH value.And the T2 mapping allows non-invasive visualization and quantification of tissue composition. Here, weaimsto explore the value of APTw imaging in combination with T2 mapping in comparative analysesof rental cancer with and without chemotherapy. Results indicated that a ultrahigh diagnostic efficacy (AUC: 1.000; sensitivity: 100%; specificity: 100%) was achieved with combination of APT and T2 values.
Introduction
Rectal cancer is one of the worldwide leading causes of cancer-related death1 and the preoperative chemotherapy is usually used for patients with high-stage rectal cancer before surgery. Non-invasive evaluations of the composition and activity of the rectal-cancer lesions areusually carried out with techniquessuch as MR/PET imaging. Amide proton transfer-weighted (APTw) imaging (an endogenous chemical exchange saturation transfer imaging technique) can assess changes ofthe intracellular protein concentration and the pH value, by detecting proton exchange between amide protons of endogenous mobile proteins/peptides and bulk-water protons.It has been used for diagnoses of diseases, especially tumors, in regions such as brain and prostate2-4. T2 mapping were allowed for a non-invasive visualization and quantification of tissue composition5. The purpose of this study is to investigate the potential of APTw and T2 mapping quantitative imaging for comparative analyses of rental cancer patients with and without chemotherapy.Materials and Methods
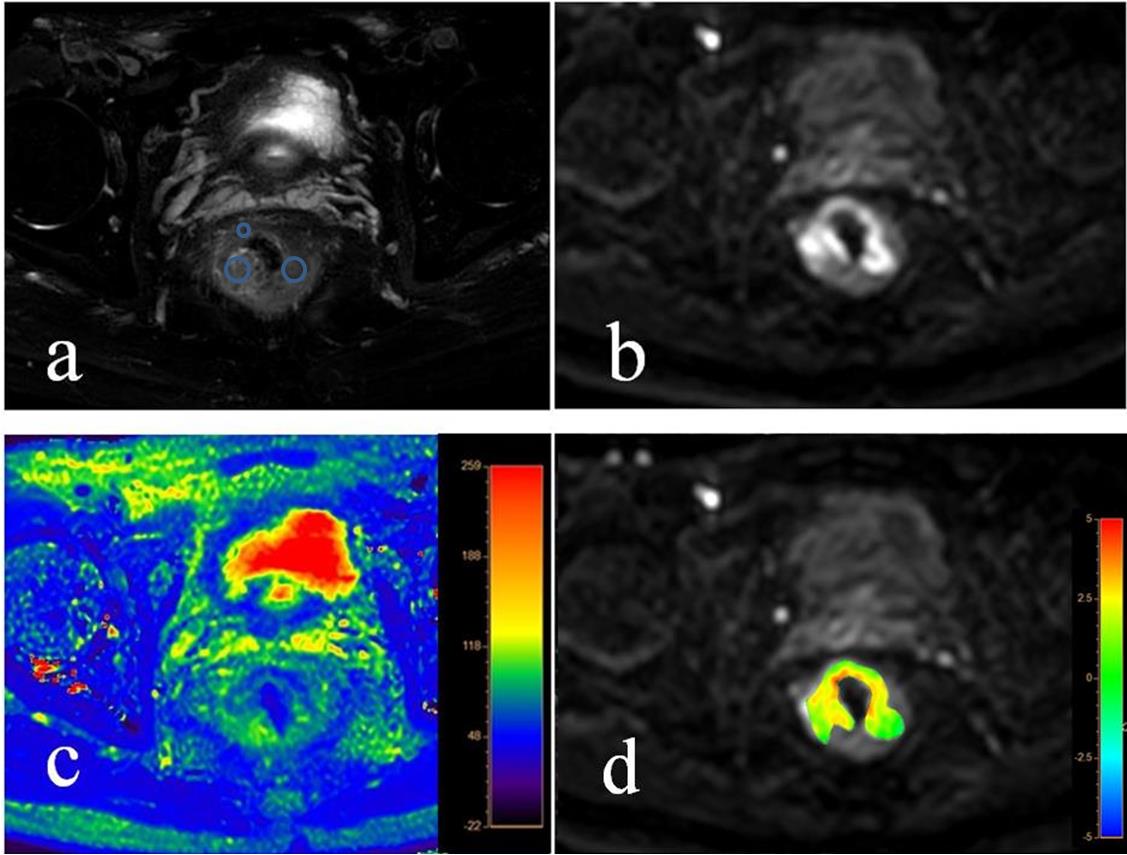
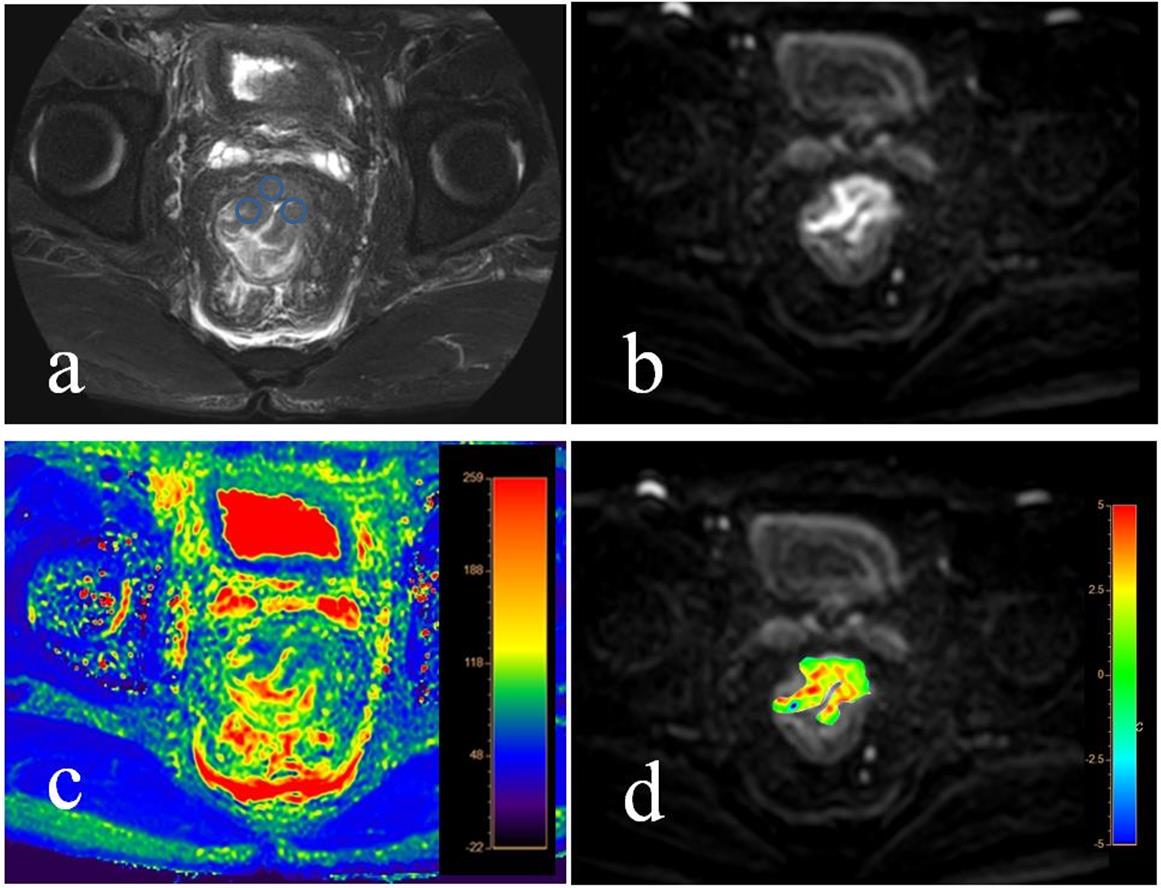
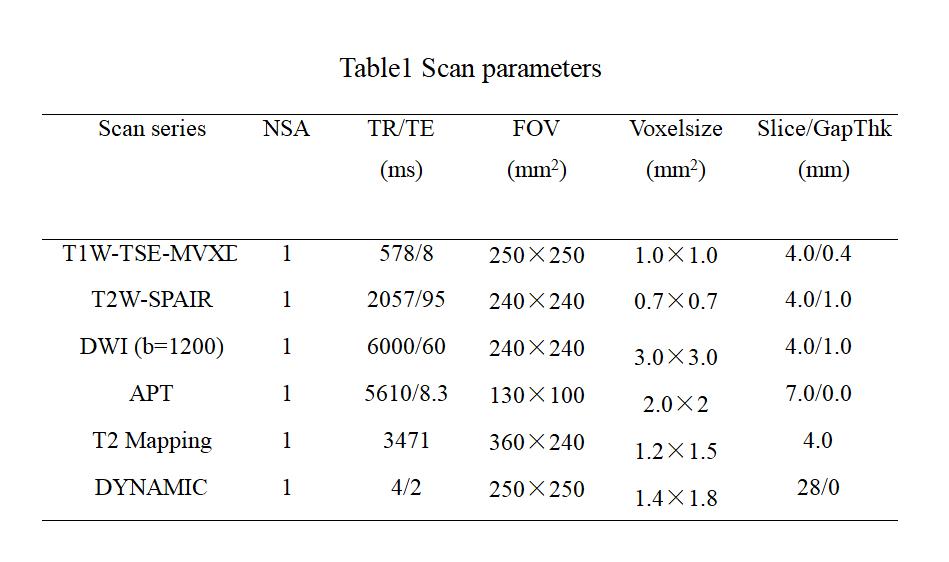
This study has been approved by the local IRB. Data from 15 cases of rectal cancer lesions were retrospectively analyzed, including 6 cases of chemotherapy lesions (group A, 2 females, age 61.67±16.06 years) and 9 cases of malignant lesions (group B, 4 female, age 66.11±4.57 years). ATPw, T2 mapping, and conventional MRI scans includedT1W, T2W, DWI and DYNAMIC were collected on a 3.0T MR scanner (Ingenia CX, Philips Healthcare, the Netherlands) (parameters listed in Table 1). Raw data of APTw and T2 mapping images were transferred to a workstation (Intellispace Portal, Philips Healthcare) for post-processing. For the anatomical location of lesion obtained on T2-weighted, DWI and DYNAMIC images (Figure 1&2 for rental cancer with and without chemotherapy, respectively), three circle ROIs were manually placed on the slice with largest area of lesion with high signal intensity and obvious enhancement on APTw and T2 mapping images, respectively. Mean values of the ATP and T2 values measured from the three ROIs were used for comparison between groups A and Bby using the Mann-Whitney U test. ROC curves of the above parameters were used to analyze quantitative values changes of rectal cancer with and without chemotherapy. Logistic regression was also used to calculate the value of APT combined with T2 mapping parameters in the comparison of rectal cancer patients with (group A) and without (group B) chemotherapy.Results
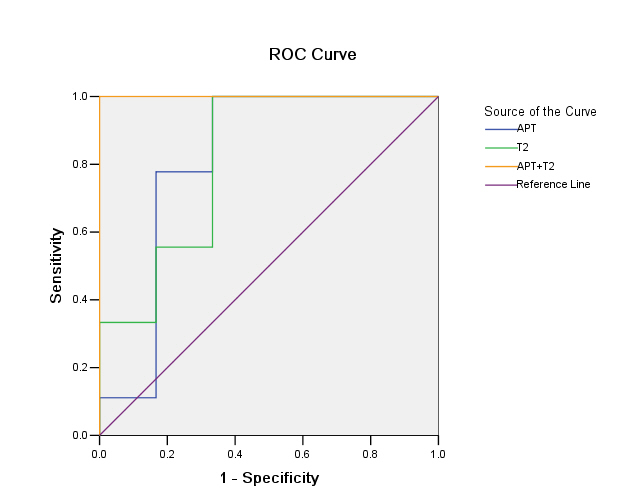
The median(25th Percentile, 75th Percentile) of APT and T2 values for group A were 2.16 (1.31, 3.03)%, and 75.16 (72.76, 84.77)ms, respectively, which were both significantly lower (p<0.05) than those for group B (APT: 3.00 (2.81, 3.37)%, and T2: 87.93 (80.92, 95.41)ms). Areas under the ROC curve (AUC) of APT and T2 values to differentiate group A and B were both 0.815. The sensitivity andspecificity of APT and T2 values corresponding to their respective feasible threshold values were both 100% and 66.7%. With combination of APT and T2 values for rectal cancer with and without chemotherapy, the diagnostic efficacy become significantly increased (AUC=1.00), as well as the sensitivity (100%) and the specificity (100%)(Figure 3).Discussion and conclusion
APTw imaging combined with T2 mapping imaging can effectively reflect lesion changes between rectal cancers with and without chemotherapy. Protein syntheses can be active in tumor regions due to the increased proliferative activities in tumor cells, while the chemotherapy will reduce tumor cells as well as the protein syntheses. Therefore, APT values were significantly lower in the group with chemotherapy than group without chemotherapy. Rectal cancer with chemotherapy can be associated with increase of normal cells, interstitial components, as well as pathological fibroses, therefore, T2 values were significantly lower in the group with chemotherapy. The ultrahigh ROC efficacy (100%) was achieved may be due to the limited number of cases. More cases are expected to be add for further reliable analyses in the future.Acknowledgements
No acknowledgement found.References
[1] Siegel RL, Miller KD, Fedewa SA, et al. Colorectal cancer statistics, 2017[J]. Ca A Cancer Journal for Clinicians, 2017, 67:104-117.
[2] Zhou Jinyuan, HeoHye-Young, Knutsson Linda, et al. APT-weighted MRI: Techniques, current neuro applications, and challenging issues[J]. Magn Reson Imaging, 2019, 50: 347-364.
[3] Takayama Y, Nishie A, Sugimoto M, et al. Amide proton transfer(APT) magnetic resonance imaging of prostate cancer: comparison with Gleason scores. MAGMA 2016; 29: 671-679.
[4] He Yong-Lan, Li Yuan, Lin Cheng-Yu, et al. Three-dimensional turbo-spin-echo amide proton transfer-weighted mri for cervical cancer: A preliminary study[J]. Magn Reson Imaging, 2019, 50: 1318-1325.
[5] Adams Lisa C, Bressem Keno K, Jurmeister Phillipp, et al. Use of quantitative T2 mapping for the assessment of renal cell carcinomas: first results [J] .Cancer Imaging, 2019, 19: 35.
Figures