2430
Relationship between ADC values of MRI diffusion-weighted imaging and the pathological prognostic factors of rectal cancer1radiology, Sichuan university, Chengdu, China, 2pathology, Sichuan university, Chengdu, China
Synopsis
To investigate the correlation between the ADC value of MRI-DWI and the pathological prognostic factors of rectal cancer. 87 patients with rectal cancer were grouped according to the pathological prognostic factors. The mean ADC values of tumor tissues were measured, and the relationship between ADC values of different groups was analyzed. The differences of ADC values of the different differentiation groups, pN stage groups and P53 expression groups had statistical significance. The P53 expression level and ADC value showed a moderate negative correlation. It is expected the biological behavior of tumors can be predicted by quantitative analysis of ADC values.
Introduction
Colorectal cancer (CRC) ranks third in cancer related death and its incidence has been increasing worldwide.1,2 At the same time, there is no effective screening index for the early onset process of colorectal cancer. Pre-treatment evaluation of the biological behavior of the tumor in advance, has important clinical significance for clinical planning and prognosis. Direct evaluation of the biological characteristics of tumors by biopsy and other methods is invasive, time consuming and poorly reproducible. Therefore, MR DWI technology has become an indirect detection method with great potential. DWI is currently the only functional imaging method that can observe the microscopic motion of living water molecules. It reflects the internal structural changes of the pathological changes at the cellular and molecular levels, and provides information on the integrity of tissue membranes and the diffusion of water molecules inside and outside the cells,3 thereby, the biological behavior of tumor tissue is monitored and evaluated non-invasively. This study aims to non-invasively probe into the correlation between ADC value in MRI diffusion-weighted imaging examination and the main pathological prognostic factors of rectal cancer, hope to be able to provide a reference for the treatment and prognosis evaluation of rectal cancer.Methods
The pathological data of 87 patients with rectal cancer confirmed by pathology and treated by direct surgery without adjuvant therapy were retrospectively collected.These cases were grouped according to the degree of pathological differentiation, pT stage, pN stage, lymphangiovascular invasion and peripheral nerve invasion, mesorectum fascia status, and the immunohistochemical P53 expression. The mean ADC values of tumor tissues of rectal cancer acquired by DWI were measured, and the correlations were analyzed between tumor ADC values of different groups.Results
The ADC values of tumors decreased in the moderate, poor-moderate, and poor differentiation groups successively, and the differences among the groups had statistical significance (P=0.047). The ADC value of pN+ group was lower than that of pN0 group, and the difference had statistical significance (P=0.016); However, There were no significant differences in ADC values between the various groups of the pT stage, the presence of lymphangiovascular, peripheral nerve invasion, and mesorectum fascia invasion. The mean ADC values of rectal tumor with different levels of P53 expression were compared among groups, and the differences had statistical significance (P=0.000 ). With the increase of P53 expression level, the mean ADC value showed a downward trend, and the two showed a moderate negative correlation (r=-0.559,P=0.000).Discussion
On DWI images, the appearance of pathological changes limits the diffusion of water molecules, resulting in lower ADC values than normal tissues. In terms of rectal cancer, it has been reported in the literature that the ADC value can reflect the effect of chemoradiation, assessing the biological features and judge the prognosis of patients.4-6 At the same time, some studies have shown that the lower the degree of differentiation of rectal cancer, the lower the ADC value.7,8 In this study, the lower the degree of tumor differentiation, the lower the ADC value, which is consistent with some previous studies, indicating that ADC value as an imaging marker has certain value in evaluating the invasiveness of rectal cancer. There was controversy about the correlation between ADC value and TN staging of rectal cancer. The results of this study show that there is no significant difference of ADC values between different pT-stages, but there is a statistical difference between different pN stages, indicating that the ADC value of tumor has certain value in reflecting lymph node metastasis, further confirming that the ADC value is related to the malignancy and invasiveness of the tumor, similar to the study by Curvo-semedo et al.8 There are currently few studies on the correlation between ADC values and P53 expression in rectal cancer. Some scholars discovered through animal experiments that ADC value may be used in measurement of cell apoptotic and proliferating indexes in colorectal carcinoma.9,10 Meyer et al identified several associations between histogram parameter derived from ADC maps and EGFR, KI 67 and p53 expression in rectal cancer.11 In this study, the mean ADC values have significant differences among four groups with different degrees of P53 expression in rectal cancer statistically. Correlation analysis shows that ADC values and P53 expression levels present moderate negative correlation. Therefore, preoperative measurement of ADC values of rectal tumors can reflect the expression level of P53 in tumor cells to some extent, and can indirectly evaluate the proliferation activity of tumor cells, which provides a reference for the clinical treatment options and prognosis evaluation. Conclusion: The mean ADC value of rectal cancer was correlated with tumor differentiation degree, lymphatic metastasis, and P53 expression. It is expected that the biological behavior of tumors can be predicted by quantitative analysis of ADC values.Conclusion
The mean ADC value of rectal cancer was correlated with tumor differentiation degree, lymphatic metastasis, and P53 expression. It is expected that the biological behavior of tumors can be predicted by quantitative analysis of ADC values.Acknowledgements
This work was supported by the Science and Technology Department in Sichuan province of China.
References
1. Jemal A, Siegel R, Xu J, et al. Cancer statistics, 2010. CA Cancer J Clin. 2010;60(5):277-300.
2. Karabulut M, Alis H, Bas K, et al. Clinical significance of serumclaudin-1 and claudin-7 levels in patients with colorectal cancer. Mol Clin Oncol. 2015; 3(6): 1255–1267.
3. Koh DM, Takahara T, Imai Y, et al. Practical aspects of assessing tumors using clinical diffusion-weighted imaging in the body. Magn Reson Med Sci. 2007;6(4): 211-224.
4. Jones M, Hruby G, Stanwell P, et al. Multiparametric MRI as an outcome predictor for anal canal cancer managed with chemoradiotherapy. BMC Cancer. 2015;15: 281-287.
5. Sun Y, Tong T, Cai S, et al. Apparent Diffusion Coefficient (ADC) value: a potential imaging biomarker that reflects the biological features of rectal cancer.PLoS One. 2014;9(10):e109371.
6. Cho SH, Kim GC, Jang YJ, et al. Locally advanced rectal cancer: post-chemoradiotherapy ADC histogram analysis for predicting a complete response.Acta Radiol.2015;56(9):1042-1050.
7. Akashi M, Nakahusa Y, Yakabe T, et al.Assessment of aggressiveness of rectal cancer using 3-T MRI: correlation between the apparent diffusion coefficient as a potential imaging biomarker and histologic prognostic factors. Acta Radiol. 2014;55(5):524-531.
8. Curvo-Semedo L, Lambregts DM, Maas M, et al. Diffusion-weighted MRI in rectal cancer: apparent diffusion coefficient as a potential noninvasive marker of tumor aggressiveness. J Magn Reson Imaging. 2012;35(6):1365-1371.
9. Li X, Jiang H, Niu J, et al. Correlation of ADC value with pathologic indexes in colorectal tumor homografts in Balb/c mouse. Chin J Cancer Res. 2014;26(4):444-450.
10. Zhang XY, Sun YS, Tang L, et al. Correlation of Diffusion-Weighted Imaging Data With Apoptotic and Proliferation Indexes in CT26 Colorectal Tumor Homografts in Balb/c Mouse. J Magn Reson Imaging. 2011;33(5):1171-1176.
11. Meyer HJ, Höhn A, Surov A. Histogram analysis of ADC in rectal cancer: associations with different histopathological findings including expression of EGFR, Hif1-alpha, VEGF, p53, PD1, and KI 67. A preliminary study. Oncotarget. 2018;9(26):18510-18517.
Figures
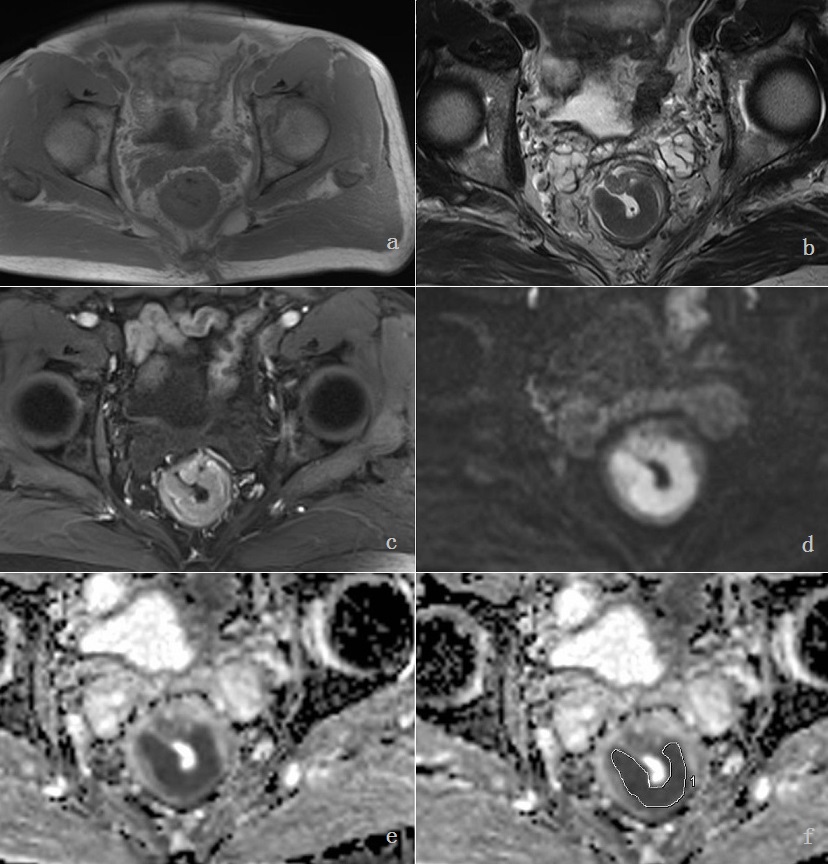
1. a: On axial T1WI image, tumor shows equal signal. b:Axial T2WI image shows slight low signal of the lesion. c: Nonhomogeneous enhancement on axial T1WI imaging. d: High b-value DWI (b=1000) shows high signal of the tumor. e: On ADC map, tumor shows significant low signal. f:ADC maps of the lesion with regions of interest (ROIs).
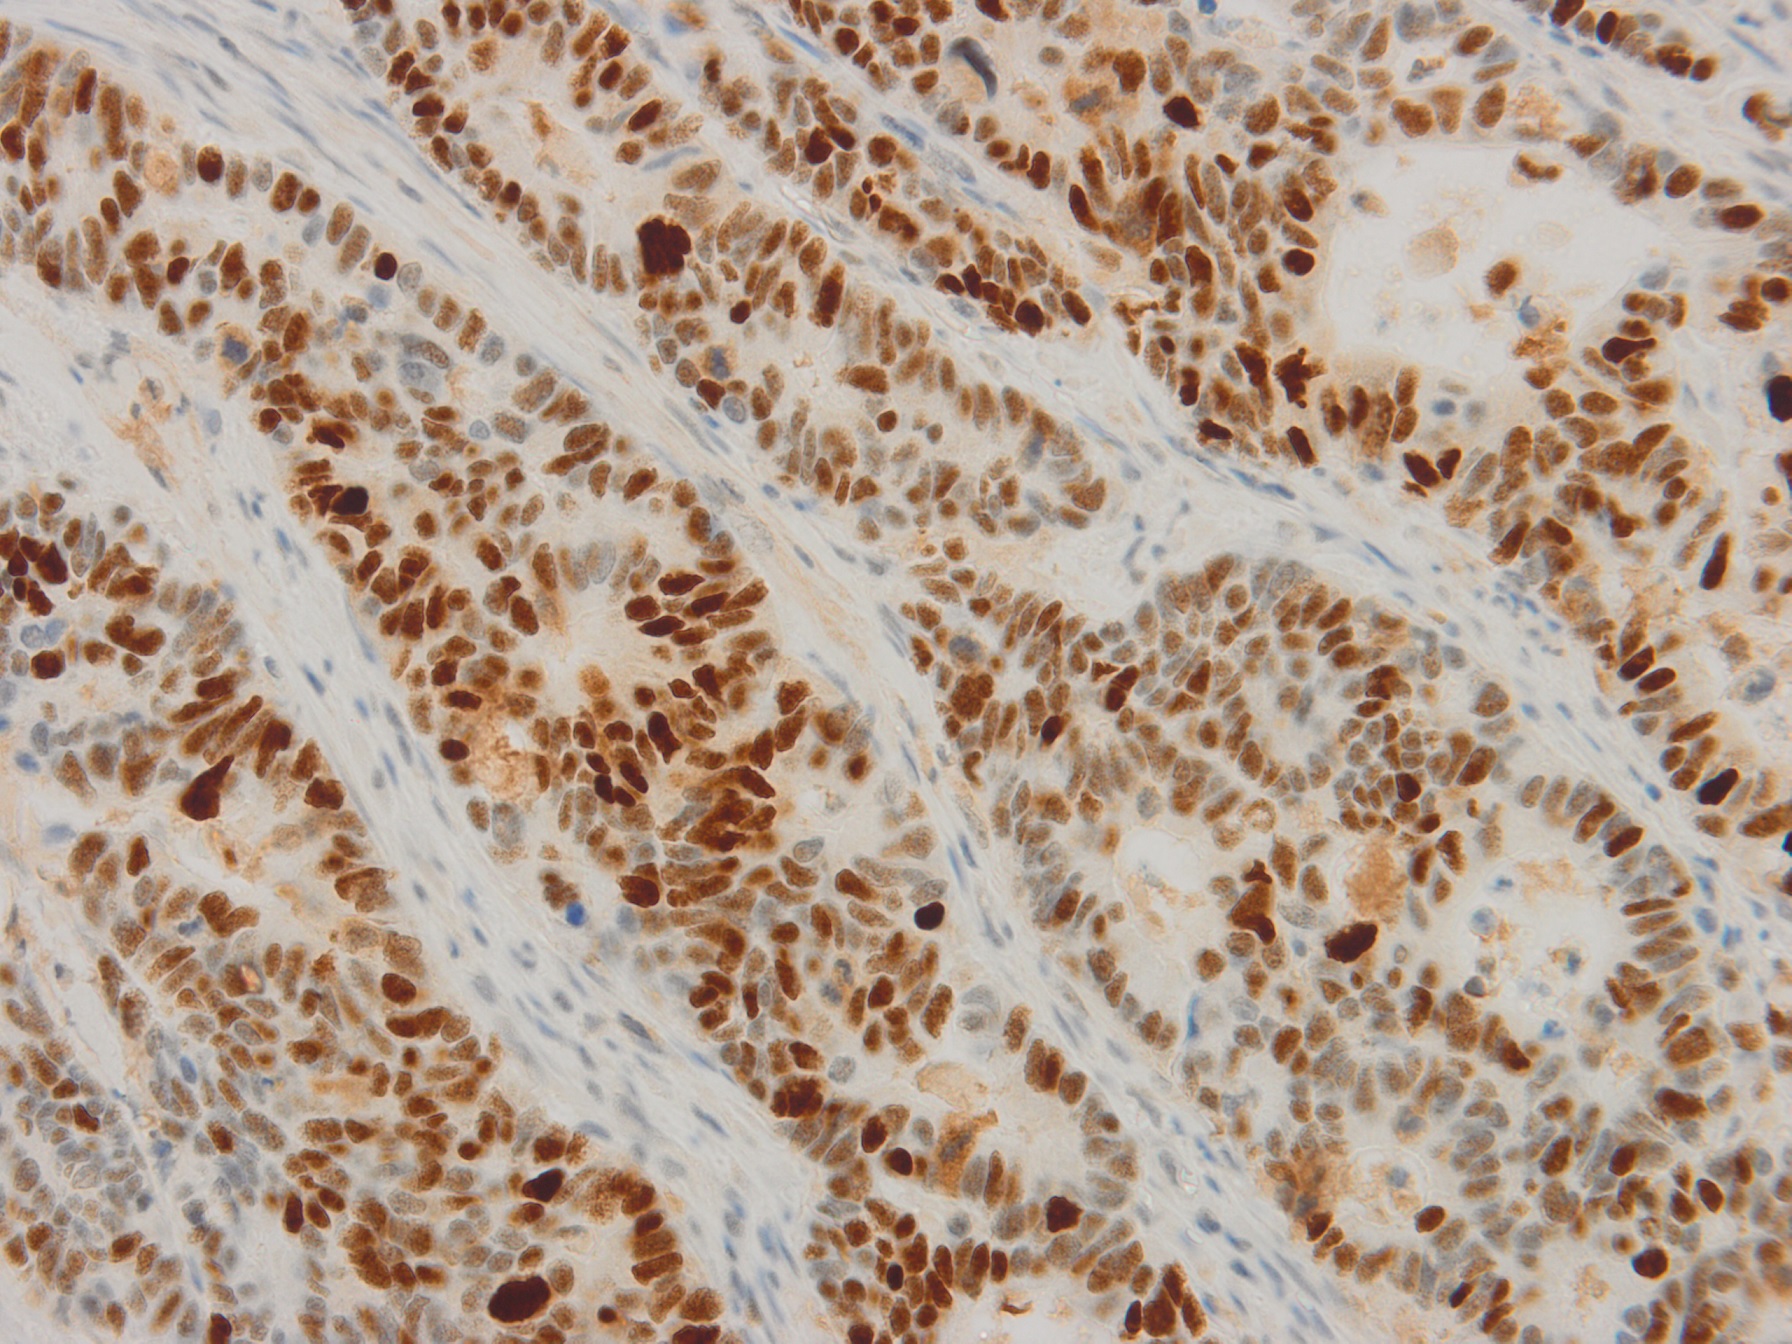
2. Histopathological manifestation of P53 in rectal cancer cells: Microscopically, P53 is expressed in the cells, showing uniform brown-yellow particles (immunohistochemical staining × 400) .