2426
Amide proton transfer MR imaging of prostate cancer: a preliminary study using 3D acquisition
Ayumu Kido1, Tsutomu Tamada1, Yu Ueda2, Tomohiro Mochizuki3, Takeshi Fukunaga1, and Akira Yamamoto1
1Radiology, Kawasaki Medical School, Kurashiki, Japan, 2Philips Japan, Minato-ku, Japan, 3Philips Japan, Osaka, Japan
1Radiology, Kawasaki Medical School, Kurashiki, Japan, 2Philips Japan, Minato-ku, Japan, 3Philips Japan, Osaka, Japan
Synopsis
APT-MRI is a contrast-agent-free MRI technique that exploits signal from the amide protons (NH groups) contained in proteins and peptides. No studies have reported the use of 3DAPT. Quantitative analysis (ADC and APT SI (%)) were calculated for PC lesions and for benign regions that included normal PZ and benign prostatic lesions. APT SI was comparable among normal regions, benign lesions, and PC. However, APT SI was significantly higher in large PC than in small PC. In addition, the APT SIs of PC lesions correlated well with PSA. APT SI may represent tumor volume, PC staging, and prognosis.
INTRODUCTION:
Multiparametric magnetic resonance imaging (mpMRI) of the prostate clearly depicts the zonal anatomy of the prostate, including the peripheral zone (PZ) and transition zone (TZ), and is currently the most accurate diagnostic imaging tool for detecting prostate cancer (PC) in either zone.1-2 MR imaging techniques such as diffusion-weighted imaging (DWI) and dynamic contrast-enhanced MR imaging (DCE-MRI) have proven valuable for tumor detection, localization, staging, and local recurrence.3 However, it is still inadequate for the diagnosis of PC, especially for detection of PC in the TZ.4 Amide proton transfer MR imaging (APT-MRI) is a unique, contrast-agent-free MRI method that exploits signal from the amide protons (NH groups) contained in proteins and peptides.5 Protein/peptide levels are known to be highly elevated in aggressive, highly proliferative tumor tissues and are strongly correlated with tumor grade in brain tumors.6,7 Accordingly, some studies have assessed the usefulness of APT-MRI in PC; however, they few are in number.8,9 In addition, no previous study has reported the use of APT-MRI with a 3D acquisition (3DAPT). Thus, the aim of the study was to evaluate the value of 3DAPT for PC.METHODS:
A total of 26 patients with suspected PC (mean age, 71.4 years; range, 57–88 years) with elevated prostate specific antigen (PSA) levels underwent prostate mpMRI at 3T (Ingenia Elition 3.0T; Philips Medical Systems, Best, The Netherlands). The sequences used for mpMRI were T2-weighted imaging (T2WI), DWI (0, 3000 s/mm2), DCE-MRI, and 3DAPT. 3DAPT was acquired with mDIXON XD turbo spin-echo (TSE) and the following parameters: TR/TE, 5864/8.3 ms; TSE factor, 174; FOV, 230 × 180 mm; matrix, 128 × 100; slice thickness, 6 mm; and number of signal averages, 1. A total of nine image volumes were acquired at seven different frequency offsets, using a 3D TSE read-out that enables volumetric coverage without geometrical distortion of the images. Six acquisitions (–4.3, –3.5, –2.7 ppm and +2.7, +3.5, +4.3 ppm) were performed, and the non-saturated S0 image was acquired with a large RF pulse offset to allow normalization of the APT signal intensity (APT SI (%)). Moreover, the two acquisitions at +3.5 ppm were performed with slightly different echo shifts of ~0.5 ms, to enable calculation of a B0 field map directly from the APT MR image acquisition, based on mDIXON algorithms.One fellowship-trained abdominal radiologist with 7 years of experience in prostate MRI assessed the mpMRI. In qualitative analysis, anatomical distortion of the prostate (AD) on 3DAPT and DWI were assessed visually using a four-point scale (1=none, 2=mild, 3=moderate, 4=severe). In quantitative analysis, apparent diffusion coefficient (ADC, ×10–3mm2/s) on DWI and APT SI on 3DAPT were calculated for PC lesions (n=25) and for benign regions that included normal PZ (n=14), benign prostatic hyperplasia (BPH, n=12), and chronic prostatitis (CP, n=12). These values were obtained for regions of interest (ROIs) placed on ADC maps and 3DAPT images on a PACS monitor. AD was compared between 3DAPT and DWI. APT SI and ADC were then compared between 1) PC, normal PZ, and benign lesions (BPH+CP) and 2) PC lesions of diameter <15 mm (n=16) and PC lesions of diameter ≥15 mm (n=9). Finally, we assessed the relationships between each of the ADCs of PC lesions and the ATP SIs of PC lesions, and PSA.RESULTS:
AD was comparable between 3DAPT and DWI (2.27±0.67% and 2.04±0.2%, respectively, P=0.098). There was no significant difference in ATP SI between PC, normal PZ, and benign lesions (2.33±0.97%, 2.11±1.07%, and 2.12±0.72%, respectively, P=0.309). In contrast, significant difference was found for ADC between normal PZ, benign lesions, and PC (1.55±0.30, 1.12±0.21, and 0.75±0.16, respectively, P<0.001). Furthermore, significant difference was found for all combinations of these groups (normal PZ and benign lesions, P<0.001; normal PZ and PC, P<0.001; benign lesions and PC, P<0.001). Mean APT SI in PC was significantly higher in lesions of diameter ≥15 mm than in those of diameter <15 mm (2.76±0.62 and 2.09±1.06, respectively, P=0.043). There was no significant difference in mean ADC between PC lesions of diameter <15 mm and those of diameter ≥15 mm (0.76±0.13 and 0.74±0.20, respectively, P=0.718). PSA correlated with ATP SIs of PC lesions (ρ=0.397, P=0.055) and ADCs of PC lesions (ρ=–0.275, P=0.193), suggesting a higher correlation of PSA with ATP SI than with ADC.DISCUSSION:
Anatomical distortion of the prostate was equivalent between 3DAPT and DWI. Therefore, 3DAPT could be applied to the quantitative measurement of APT SI. In the comparison between normal regions, benign lesions, and PC, ADC showed a stepwise decrease that showed significant difference, as reported previously.10, 11 APT SI was comparable among these three groups, which may suggest that there is no apparent difference in protein/peptide levels among the various prostate tissues. However, APT SI was higher in larger PC than in smaller PC, and the APT SIs of PC lesions were better correlated with PSA compared with the ADCs of PC lesions. These results suggest that APT SI may represent tumor volume in PC and has potential for PC staging and for evaluating patient prognosis.12CONCLUSION:
APT SI obtained from 3DAPT could be used in future for characterization of PC, as an alternative method to ADC on DWI.Acknowledgements
NoneReferences
- Hoeks CM, Barentsz JO, Hambrock T, et al. Prostate cancer: multiparametric MR imaging for detection, localization, and staging. Radiology. 2011;261(1):46-66.2.
- Ahmed HU, El-Shater Bosaily A, Brown LC, et al. Diagnostic accuracy of multi-parametric MRI and TRUS biopsy in prostate cancer (PROMIS): a paired validating confirmatory study. Lancet. 2017;389 (10078):815-822.3.
- Barentsz JO, Richenberg J, Clements R, et al. ESUR prostate MR guidelines 2012. Eur Radiol. 2012;22(4):746-57. 4.
- Tamada T, Kido A, Takeuchi M, et al. Comparison of PI-RADS version 2 and PI-RADS version 2.1 for the detection of transition zone prostate cancer. Eur J Radiol. 2019;121.5.
- Kamimura k, Nakajo M, Yoneyama T, et al. Amide proton transfer imaging of tumors:theory, clinical applications, pitfalls, and future directions. Jpn J Radiol. 2019;37(2):109-116.6.
- Zhou J, Blakeley JO, Hua J et al. Practical data acquisition method for human brain tumor amide proton transfer (APT)imaging. Magn Reson Med. 2008;60:842–8497.
- Togao O, Yoshiura T, Keupp J et al. Amide proton transfer imaging of adult diffuse gliomas: correlation with histopathological grades. Neuro Oncol. 2014;16:441–4488.
- Jia G, Abaza R, Williams JD, et al. Amide proton transfer MR imaging of prostate cancer: a preliminary study. J Magn Reson Imaging. 2011;33(3):647-54.
- Takayama Y, Nishie A, Sugimoto M et al. Amide proton transfer (APT) magnetic resonance imaging of prostate cancer: comparison with Gleason scores. MAGMA. 2016;29(4):671-98.
- Tamada T, Sone T, Jo Y, et al. Diffusion-weighted MRI and its role in prostate cancer. NMR Biomed. 2014;27(1):25-38. 9.
- Oto A, Kayhan A, Jiang Y, et al. Prostate cancer: differentiation of central gland cancer from benign prostatic hyperplasia by using diffusion-weighted and dynamic contrast-enhanced MR imaging. Radiology. 2010;257(3):715-723.10.
- Carvahal GF, Daudi SN, Kan D, et al. Correlation between Serum PSA and Cancer Volume in Prostate Glands of Different Sizes. Urology. 2010;76(5):1072-6.
Figures
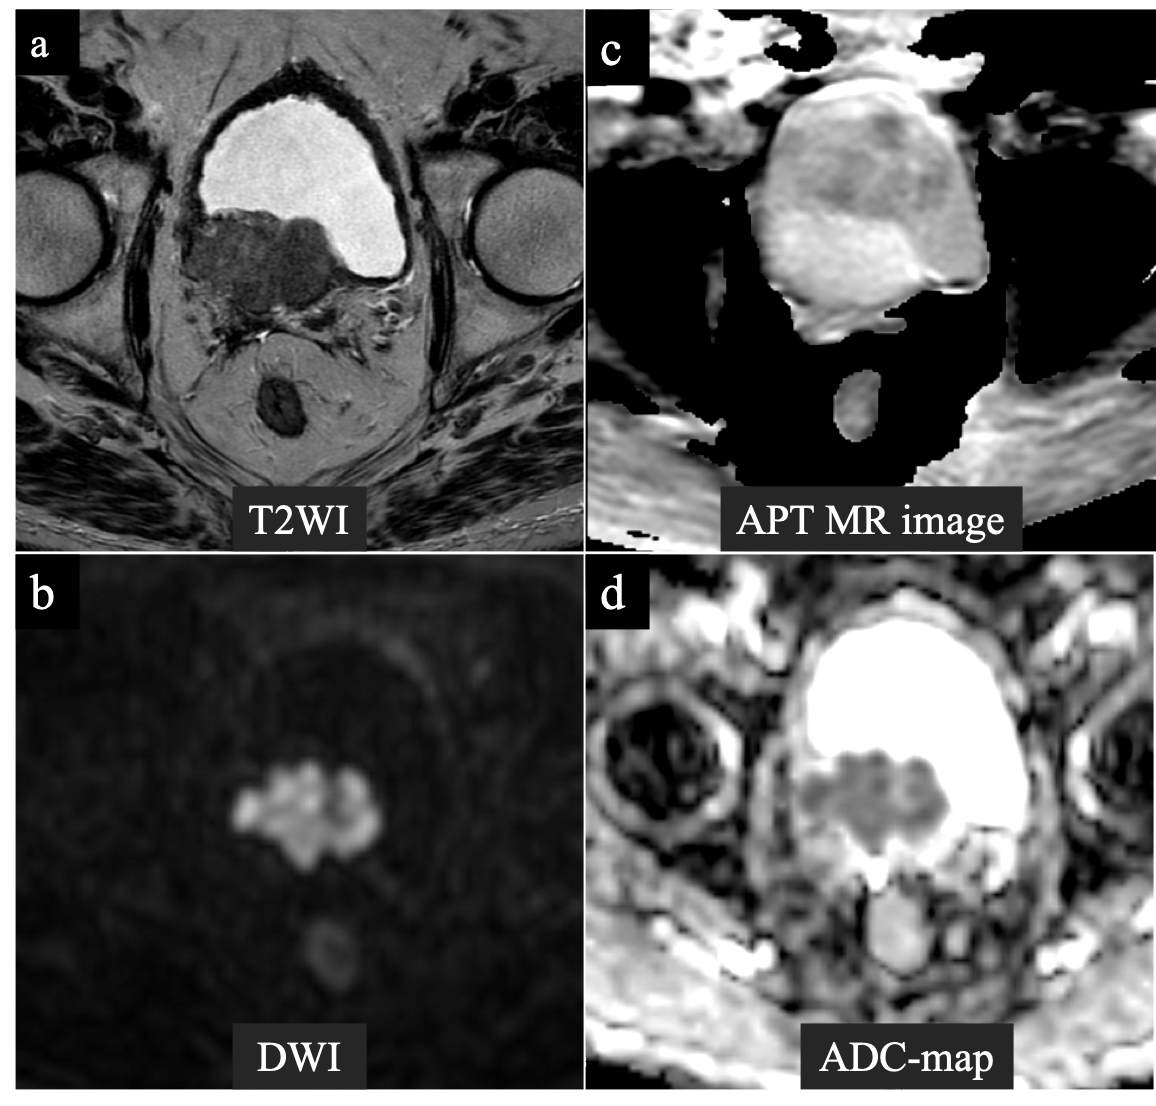
A 72-year-old man with prostate cancer in the right region in the transition zone. Cancer lesion is shown as a heterogeneous hypointense lesion with suspected bladder invasion on T2-weighted imaging (a). The lesion with a focal hyperintensity is depicted clearly in the DW image with b values of 0 and 2000 s/mm2 (b). Anatomical distortion of APT MR image was assessed as mild (c). The tumor showed APT SI of 3.43% and ADC value of 0.64×10⁻³ mm2/s (c) (d).