2423
Short TR DWI in prostate1Philips Japan, Tokyo, Japan, 2Kawasaki medical school, Kurashiki, Japan, 3Philips Healthcare, Asia Pacific, Tokyo, Japan
Synopsis
DWI is a key component of mp-MRI in prostate and the usefulness of high b-value DWI has been reported. However, the quality might depend on magnetic field strength and scanner performance. It would be beneficial to acquire sufficient diffusion contrast and ADC using standard b-value of 1000 s/mm2 without an additional higher b-value acquisition. We exploited the difference of T1 between cancer and normal to improve contrast. The contrast of T1 enhanced DWI1000 using short TR was better compared to that of DWI1000 with normal long TR but it was less than that of DWI2000 with normal long TR.
INTRODUCTION
DWI and ADC maps are key components of multi parametric MRI (mp-MRI) in prostate1, 2. High b-value DWI can provide excellent contrast in prostate3, 4. DWI with a b-value of at least 1400 s/mm2 is recommended in PI-RADS v2.11. However, the image quality of DWI with high b-value might be limited, depending on magnetic field strength and scanner performance. The use of calculated high b-value DW images, obtained by extrapolation from acquired lower b-value data, has been proposed. However, as computed DWI is based on a mono-exponential model, the signal intensity on computed DWI is not necessarily the same as that of actual scanned DWI. The recommendation for maximum b-value used to calculate ADC is ≤1,000 s/mm2 1. Therefore, multiple high b-value images need to be acquired, resulting in prolonged examination time. Recently, it has been shown that the T1 value may help differentiate transition zone (TZ) cancer from normal TZ5, 6. We hypothesized that this difference in T1 value between prostate cancer (PCa) and normal prostate tissue (NPT) can be exploited to improve contrast, hopefully to such an extent that an additional high b-value acquisition is no longer needed. The aim is to investigate whether DWI1000 with short TR can improve diffusion contrast and to compare ADC calculated from DWI0-1000 with short TR to ADC calculated from “normal” DWI0-1000.METHODS
The study was approved by the IRB, and written informed consent was obtained from all subjects. Thirty-one patients underwent mp-MRI on a 3.0T Ingenia CX with an anterior coil and posterior built-in coils (Philips Healthcare, Best, The Netherlands).DWI
DWI was scanned with TR of 1000ms (short) and 6000ms (long) with the following parameters: TE 70ms, FOV 300mm, acquisition voxel size 3.1 x 3.1 x 3.0 mm, b-value 0 1000 2000 s/mm2, NSA 2(b=0) 4(b=1000) 8(b=2000), and scan time equal to 3min50s for both TR values. Signal-to-noise ratio (SNR), contrast ratio (CR), and visual scoring were compared between DWI1000 with short TR and DWI1000 with long TR, and between DWI1000 with short TR and DWI2000 with long TR. ADC was compared between DWI1000 with short TR and DWI1000 with long TR.
1. SNR in NPT and CR between PCa and NPT were defined as:
𝑆𝑁𝑅=𝑁𝑃𝑇𝑎𝑣𝑒/𝑀𝑢𝑠𝑐𝑙𝑒𝑆𝐷
𝐶𝑅=(𝑃𝐶𝑎𝑎𝑣𝑒-𝑁𝑃𝑇𝑎𝑣𝑒)/(𝑃𝐶𝑎𝑎𝑣𝑒+𝑁𝑃𝑇𝑎𝑣𝑒)
where PCaave and NPTave is average signal in PCa and NPT, and MuscleSD is standard deviation of the signal in muscle.
2. Visual evaluation for comparison of contrast between PCa and NPT was conducted by a radiologist with twenty-three years of experience. Visual scoring criteria was 0 for weak, 1 for moderate and 2 for strong contrast.
3. ADC in PCa, NPT, and muscle was calculated using images with 2 b-values, b=0 image and b 1000 or 2000.
T1 mapping
T1 map was calculated using 3D Look Locker acquisition7 with the following parameters: TR/TE 1.97ms/0.92ms, FA 7°, phase interval 95ms, phase number 20, recovery period 5000ms, slices 8, and scan time 56sec. T1 value in PCa and NPT was compared. Wilcoxon signed-rank test was used in the statistical analysis.
RESULTS and DISCUSSION
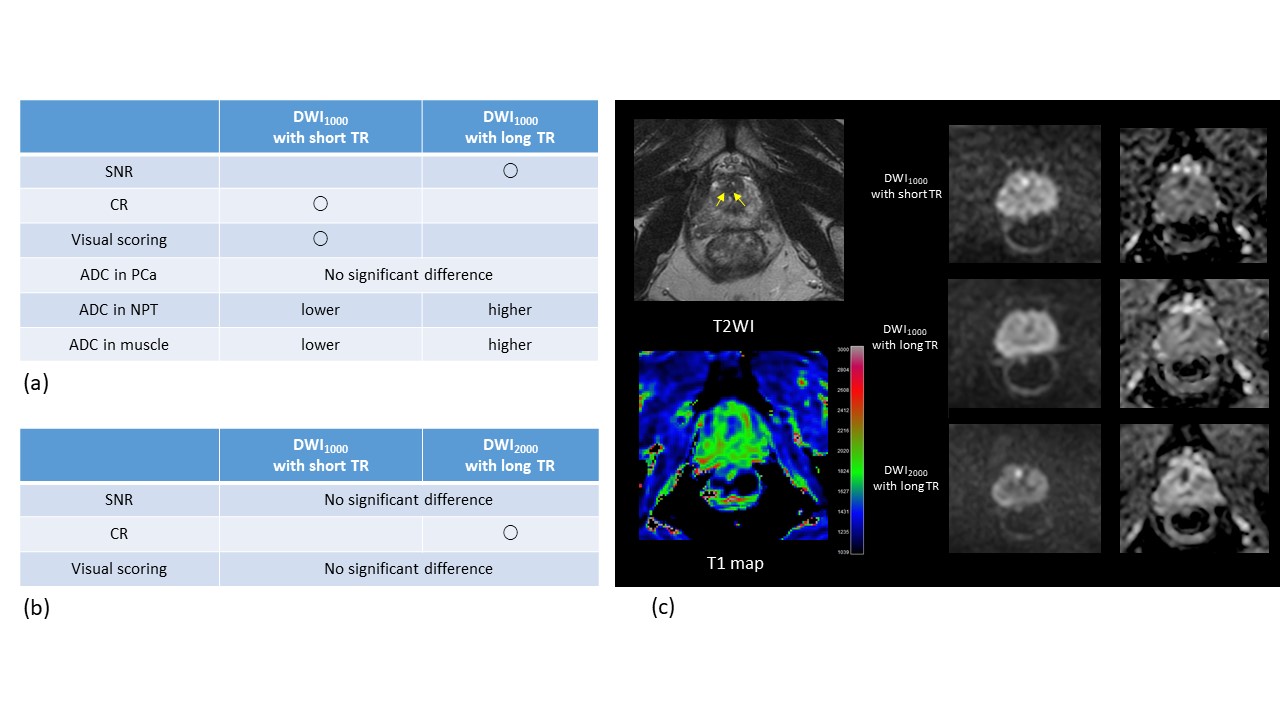
DWISNR in DWI1000 with short TR was significantly lower than that of DWI1000 with long TR, whereas there was no significant difference between DWI1000 with short TR and DWI2000 with long TR (Fig. 1a). CR in DWI1000 with short TR was significantly higher than that of DWI1000 with long TR, whereas CR in DWI1000 with short TR was significantly lower than that of DWI2000 with long TR (Fig. 1b). Visual evaluation in DWI1000 with short TR was significantly better than that of DWI1000 with long TR, whereas there was no significant difference between DWI1000 with short TR and DWI2000 with long TR (Fig. 2). There was no significant difference for ADC in PCa between DWI1000 with short TR and DWI1000 with long TR, whereas ADC was significantly lower in NPT and muscle for short TR DWI1000 (Fig. 3a-c).
T1 mapping
T1 value in PCa was significantly lower than that of NPT (Fig. 3d).
These results are summarized in Figure 4. The diffusion contrast improvement by using short TR is thought to be due to shorter T1 value in PCa compared to NPT (Fig. 5). As not only TR but also number of packages is different in both sequences, magnetization transfer or cross-talk effect might have influenced these results. ADC is significantly lower in NPT and muscle for the short TR DWI1000, presumably due to insufficient SNR. As DWI with short and long TR were scanned at the same scan time without any modification of parameters except for number of packages, optimization of imaging parameters to increase SNR in short TR DWI is needed so that ADC for short TR DWI1000 can be comparable to that of long TR.
CONCLUSION
DWI1000 with short TR resulted in improved diffusion contrast compared to DWI1000 with long TR, but its contrast is less than that of DWI2000 with long TR. ADC is similar in PCa, but significantly lower in NPT and muscle for short TR DWI1000, presumably due to low SNR in short TR DWI. Parameters optimization and clinical investigation are needed to assess if short TR DWI can provide better diagnostic quality than long TR DWI.Acknowledgements
No acknowledgement found.References
- Turkbey B, Rosenkrantz AB, Haider MA, et al. Prostate Imaging Reporting and Data System Version 2.1: 2019 Update of Prostate Imaging Reporting and Data System Version 2. Eur Urol. 2019;76(3):340-351.
- Tamada T, Sone T, Jo Y, et al. Diffusion-weighted MRI and its role in prostate cancer. NMR Biomed. 2014;27(1):25-38.
- Tamada T, Kanomata N, Sone T, et al. High b value (2,000 s/mm2) diffusion-weighted magnetic resonance imaging in prostate cancer at 3 Tesla: comparison with 1,000 s/mm2 for tumor conspicuity and discrimination of aggressiveness. PLoS One. 2014;9(5):e96619.
- Ueno Y, Kitajima K, Sugimura K, et al. Ultra-high b-value diffusion-weighted MRI for the detection of prostate cancer with 3-T MRI. J Magn Reson Imaging. 2013;38(1):154-160.
- Obmann VC, Boyacioglu R, Panda A, et al. T1 imaging of transition zone prostate cancer: why quantitative maps but not T1 weighted images are helpful. Proceedings of the 27th Annual Meeting of ISMRM, 2019 #1837.
- Panda A, Jiang Y, Margevicius S, et al. MR fingerprinting and ADC mapping for characterization of lesions in transitional zone of prostate. Proceedings of the 26th Annual Meeting of ISMRM, 2018 #4502.
- Ueda Y, Onoda M, Ohno N, et al. 3D hepatocyte fraction index using 3D look locker. Proceedings of the 27th Annual Meeting of ISMRM, 2019 #1947.
Figures
Figure 1. (a) Comparison of SNR between DWI1000 with short TR and DWI1000 with long TR, and DWI1000 with short TR and DWI2000 with long TR (b) Comparison of CR between DWI1000 with short TR and DWI1000 with long TR, and DWI1000 with short TR and DWI2000 with long TR