2419
Two-component model of prostate tissue using hybrid multidimensional T2 and diffusion-weighted imaging1Kavli Institute for Systems Neuroscience, Norwegian University of Science and Technology, Trondheim, Norway, 2Department of Circulation and Medical Imaging, Norwegian University of Science and Technology, Trondheim, Norway, 3Department of Physics, Norwegian University of Science and Technology, Trondheim, Norway
Synopsis
T2 and diffusion-weighted imaging (DWI) are increasingly used in the detection and staging of prostate cancer, however, usually under the assumption that the T2 values and apparent diffusion coefficients (ADC) are independent of each other. Using hybrid multidimensional imaging, where images are acquired at two echo times and two b-values, we estimate volume fractions of slow and fast diffusion compartments in the prostate with a two-compartment model. The results suggest that the volume fractions can be used to discriminate between tumor and normal prostate tissue.
Introduction
Magnetic resonance imaging (MRI) is increasingly used in the detection and staging of prostate cancer, usually including T2-weighted and diffusion-weighted imaging (DWI).1 However, while it has been widely assumed that T2 values and apparent diffusion coefficients (ADC) are independent of each other, recent studies have shown an interdependence of these values in the prostate.2-4 Furthermore, this coupling between T2 and ADC appears to be different in tumor and normal prostate tissue. Hybrid multidimensional imaging measures the change in T2 and ADC as a function of b-value and echo time (TE), respectively. This has previously been used for a three-compartment model of prostate tissue.5 However, for such an imaging approach to be clinically feasible, it needs to have a relatively short acquisition time, and a model without too much computational cost. Here, we propose a two-compartment model with a slow and a fast diffusion compartment, based on hybrid multidimensional imaging, which we use to compare the volume fraction estimates between tumor and normal prostate tissue.Methods
10 patients were examined by MRI on a 3 Tesla scanner (Magnetom Skyra, Siemens Medical Systems, Erlangen, Germany) due to prostate cancer suspicion, and cancer was confirmed in all 10 post-MRI biopsy. The hybrid multidimensional imaging protocol consisted of two fat-suppressed, single-shot, monopolar spin-echo EPI sequences with TE of 55 and 73 ms, each with TR=4200 ms, b-values=50 and 700 s/mm2 (three directions, NEX=2 and 4) resolution=2.0×2.0×3.0 mm3, image matrix=128×128, GRAPPA factor 2 and acquisition time 1:38 minutes.For each voxel, the 2×2 matrix of signal values S from the trace-weighted images was fitted to the following two-compartment model using Matlab (MathWorks, Natick, MA, USA):
$$\frac{S}{S_0}=V_{slow}\exp{\left(-\frac{TE}{T2_{slow}}\right)}\exp{\left(-b*ADC_{slow}\right)}+V_{fast}\exp{\left(-\frac{TE}{T2_{fast}}\right)}\exp{\left(-b*ADC_{fast}\right)},$$
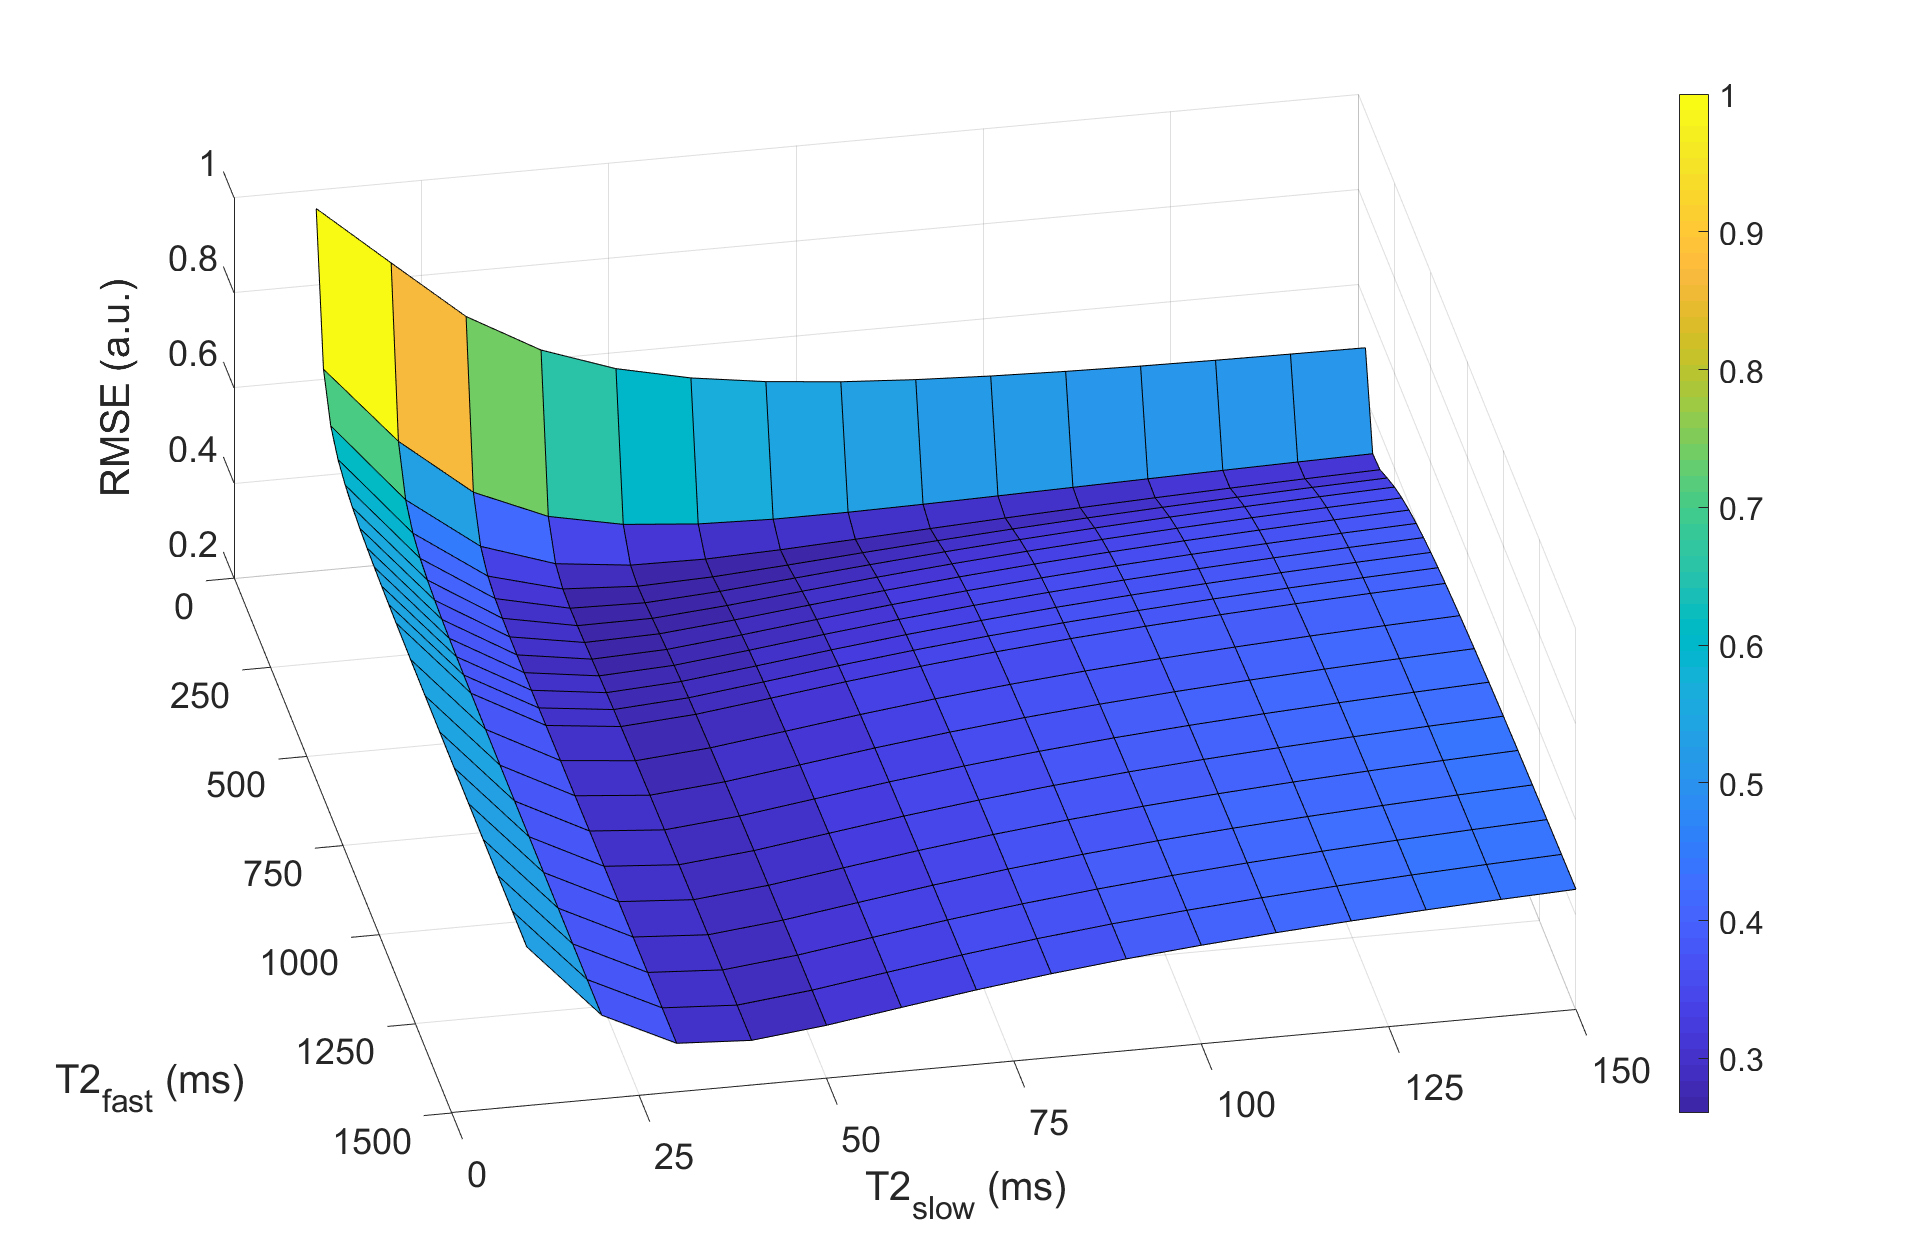
where S0 is the signal intensity at TE=0 and b=0; Vslow and Vfast, T2slow and T2fast, ADCslow and ADCfast are the volume fractions, T2 values and ADCs for each compartment, respectively; Vslow+Vfast=1; TE is the echo time and b is the b-value. The ADCs were set to be ADCslow=0.3 µm2/s and ADCfast=2.6 µm2/s, using literature values for a similar two-compartment model.6 T2slow and T2fast were determined by minimizing the global cost, defined as the sum of the root-mean-square error (RMSE) of the fit of all voxels (in a box-shaped region of interest (ROI) including the prostate) for three patients combined, while fitting the signal to the model using a range of T2 values in steps of 10 ms and 50 ms for the slow and fast components respectively. For comparison, the model was also fitted with no constraints on the T2 values.
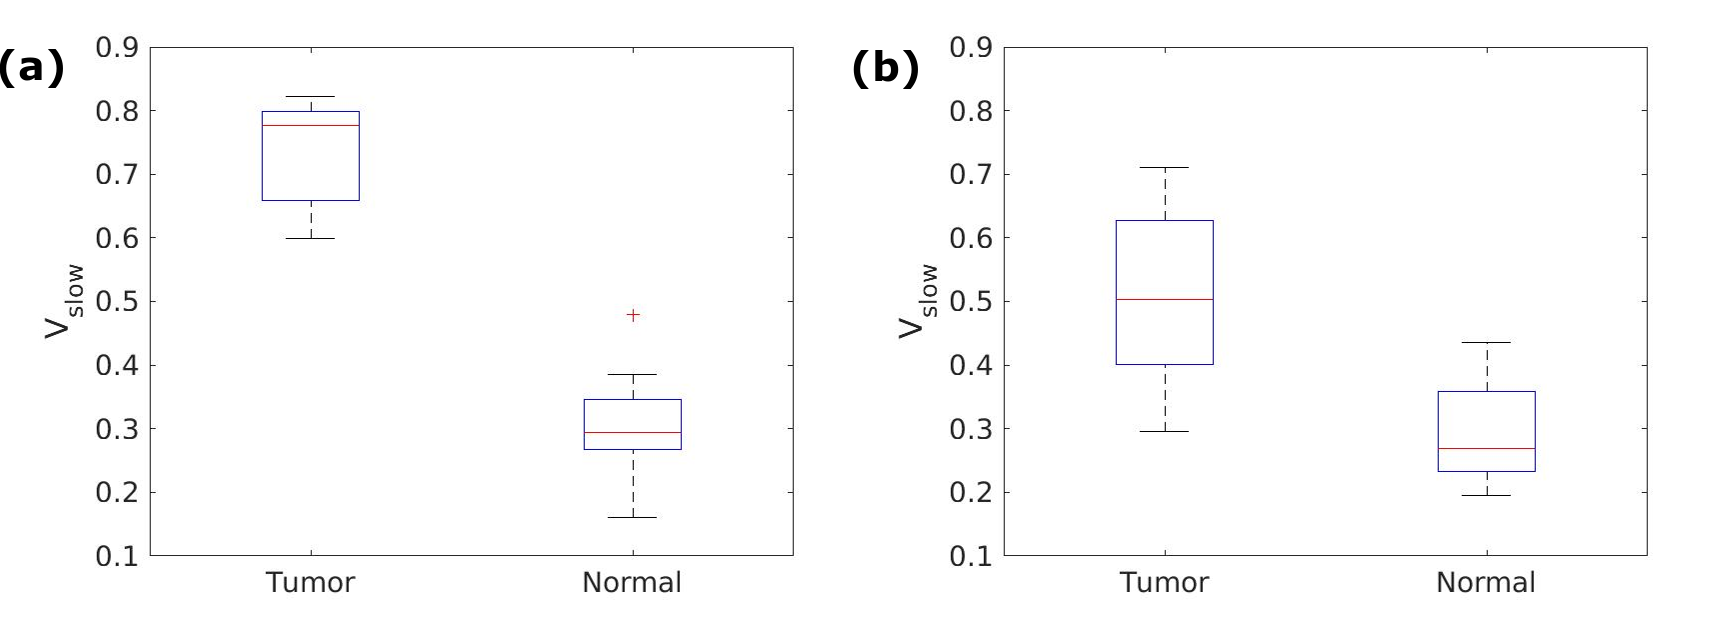
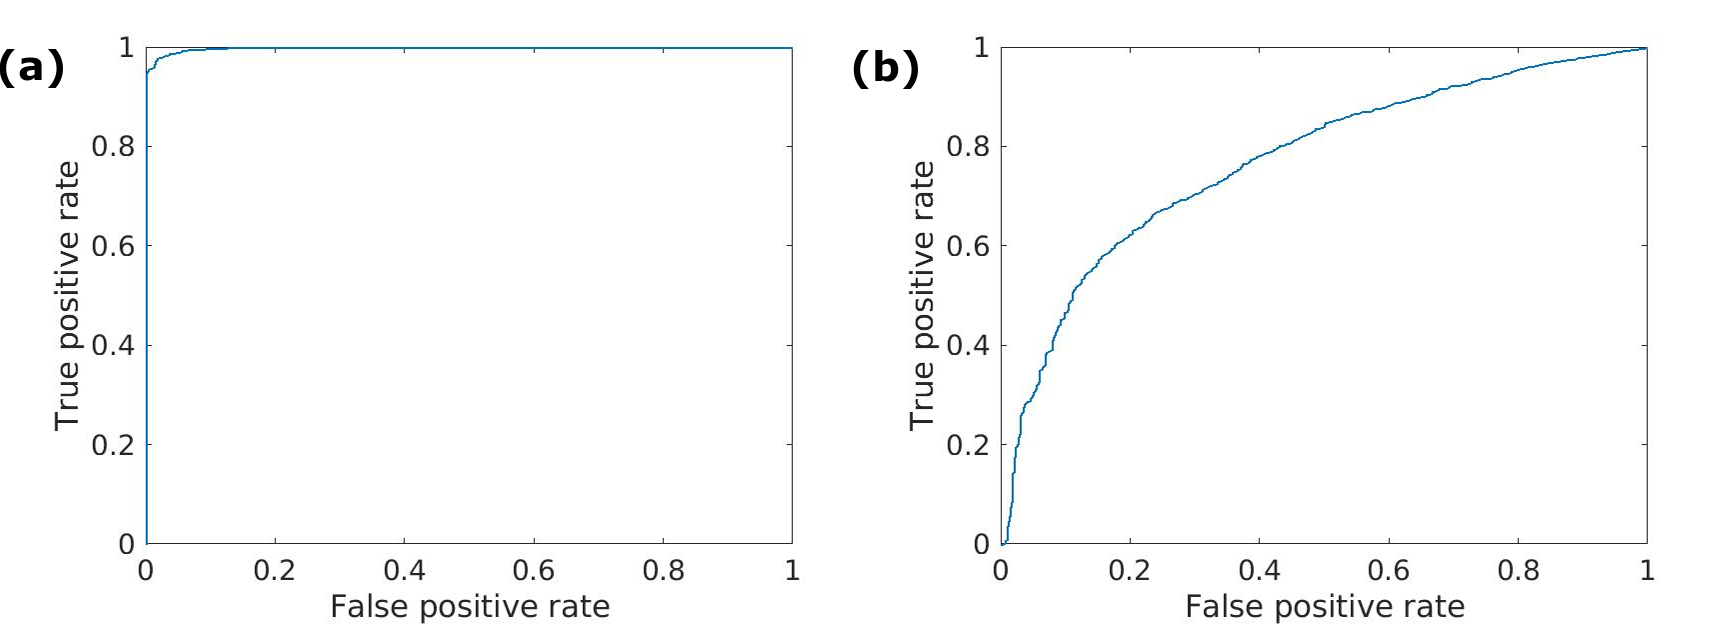
One tumor ROI and one normal tissue ROI were drawn for each patient. The median Vslow was calculated for each ROI, and the Mann-Whitney U-test was used to compare the median values for tumor and normal ROIs. Voxel-wise receiver operating characteristics (ROC) analysis was also performed.
Results
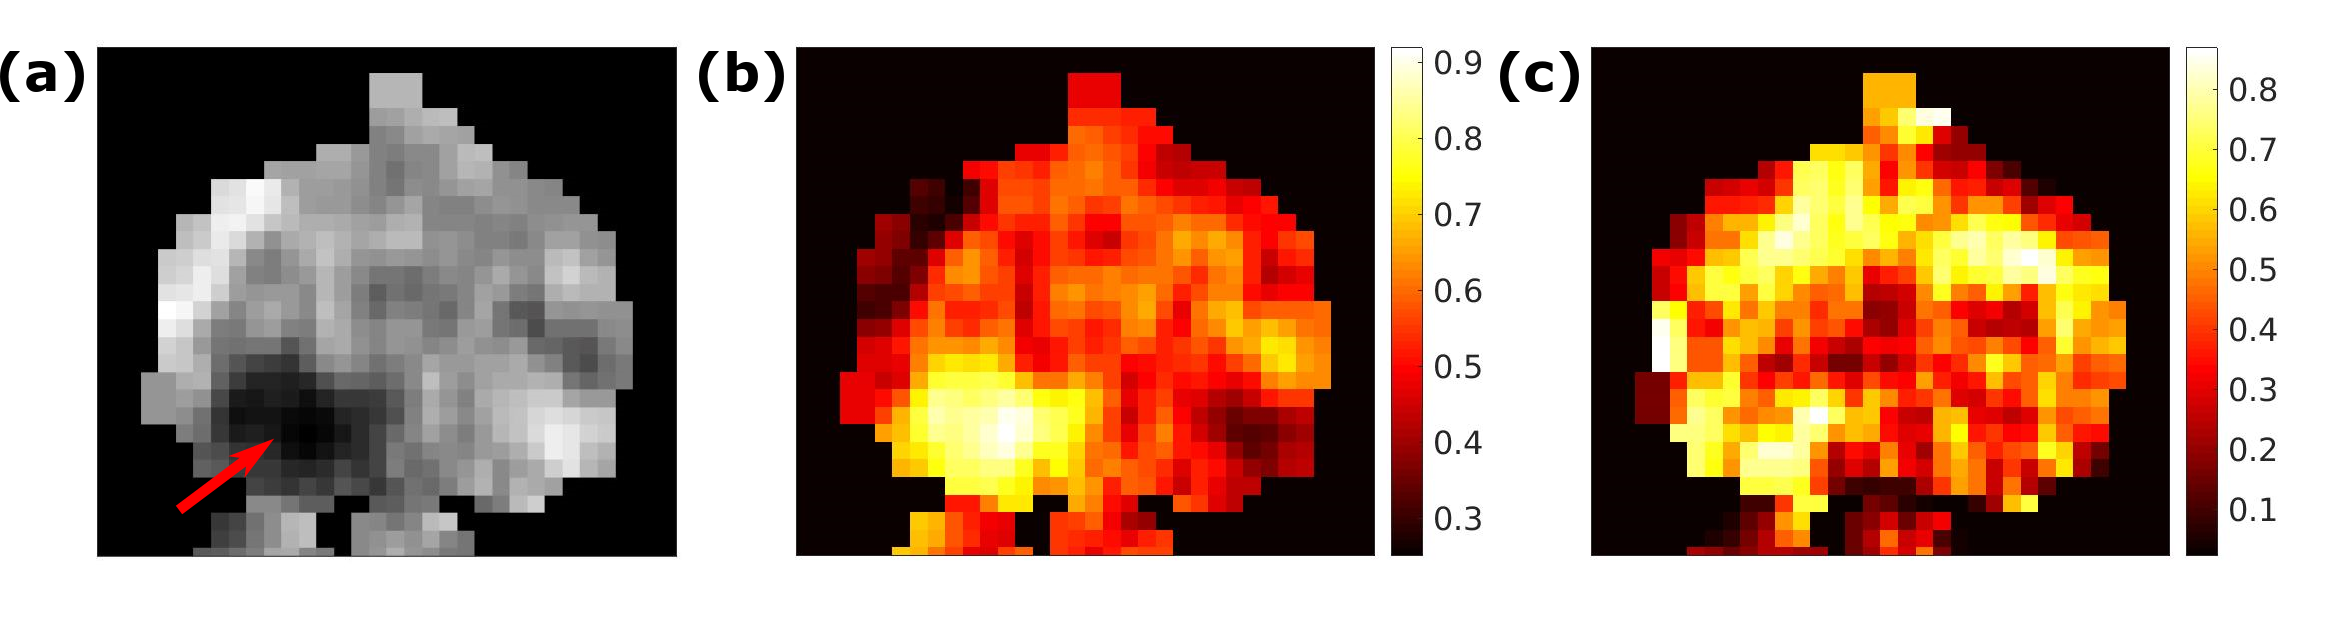
The optimal T2 values were found to be T2slow=50 ms and T2fast=200 ms (Figure 1). Figure 2 shows examples of calculated Vslow maps, both when using the optimal T2 values and with no constraints on the T2 values.Median Vslow values are presented in Figure 3. There was a significant difference between Vslow in tumor and normal ROIs both for the optimal T2 values (p=0.0002) and with no constraints on the T2 values (p=0.002). Figure 4 shows ROC curves for using Vslow to discriminate between tumor and normal prostate tissue voxels.
Discussion
The results show that Vslow values calculated both from the optimal T2 values and with no constraints on the T2 values are significantly different in tumor and normal ROIs, although the difference is larger for the optimal T2 values. The ROC analysis also showed that the optimal T2 values are better at discriminating between tumor and normal tissue. Furthermore, the Vslow maps imply that using the optimal T2 values yields a better tumor conspicuity, and that volume fractions estimated from this two-compartment model show promise for detecting tumors in the prostate.The hybrid multidimensional images can be acquired in a relatively short time, making it clinically feasible. The computational cost is also lower than using a three-compartment model. Furthermore, this model could potentially isolate the signal from subvoxel compartments and show underlying structural features of the tissue.
Although these initial results are encouraging, the model needs independent training, validation and testing in a larger number of patients and should also be correlated with histopathology. A possible source of bias in the results is that the ROIs were drawn by a basic scientist based on T2 and diffusion-weighted images and a radiologist description of the MRI exam. Furthermore, while all normal ROIs and nine tumor ROIs were in the peripheral zone, one tumor ROI was in the anterior fibromuscular stroma. In the future, the diagnostic properties of the model will be explored further, including correlation with Gleason scores and comparison with ADC.
Conclusion
Volume fractions of slow and fast diffusion compartments estimated from a two-compartment model using hybrid multidimensional imaging can potentially be used to discriminate between tumor and normal prostate tissue. The results also suggest that the choice of T2 values of the compartments can affect the performance of the model. However, the model needs validation in a larger number of patients.Acknowledgements
No acknowledgement found.References
1. Barentsz JO, Weinreb JC, Verma S, et al. Synopsis of the PI-RADS v2 Guidelines for Multiparametric Prostate Magnetic Resonance Imaging and Recommendations for Use. Eur Urol. 2016;69(1):41-49.
2. Wang S, Peng Y, Medved M, et al. Hybrid multidimensional T2 and diffusion-weighted MRI for prostate cancer detection. J Magn Reson Imaging. 2014;39(4):781-788.
3. Sadinski M, Karczmar G, Peng Y, et al. Pilot Study of the Use of Hybrid Multidimensional T2-Weighted Imaging-DWI for the Diagnosis of Prostate Cancer and Evaluation of Gleason Score. AJR Am J Roentgenol. 2016;207(3):592-598.
4. Ma X, Chen H, Peng Y. Hybrid T2-Weighted and Diffusion-Weighted Magnetic Resonance Imaging for Differentiating Prostate Cancer from Benign Prostatic Hyperplasia. In: 10th International Congress on Image and Signal Processing, BioMedical Engineering and Informatics. Shanghai, China: Institute of Electrical and Electronics Engineers, 2017; 1-5.
5. Chatterjee A, Bourne RM, Wang S, et al. Diagnosis of Prostate Cancer with Noninvasive Estimation of Prostate Tissue Composition by Using Hybrid Multidimensional MR Imaging: A Feasibility Study. Radiology. 2018;287(3):864-873.
6. Karunamuni RA, Kuperman J, Seibert TM, et al. Relationship between kurtosis and bi-exponential characterization of high b-value diffusion-weighted imaging: application to prostate cancer. Acta Radiol. 2018;59(12):1523-1529.
Figures