2417
Differentiation of Prostate Cancer from Benign Prostatic Hyperplasia using Whole-lesion Histogram Analysis on Diffusion-weighted Imaging1Radiology, Changhai Hospital of Shanghai, Shanghai, China, 2Application Predevelopment, Siemens Healthcare, Erlangen, Germany, 3Application Development, Siemens Shenzhen Magnetic Resonace Ltd, Shenzhen, China
Synopsis
Histogram and texture analysis have the potential in evaluating the heterogeneous features of tumors. This study aimed to assess the usefulness of histogram and texture analysis of ADC maps for differentiating PCa from BPH with pathology as the reference. 90 PCa and 112 BPH patients were enrolled and analyzed using histogram and texture analyses. Significant differences were observed in age, PSA, lesion volume and histogram parameters (except kurtosis) of ADC map between the PCa and BPH patients. The whole-lesion histogram and texture analysis-based parameters from the quantitative ADC map may serve as a useful biological characterization of prostate cancer.
Introduction
Prostate cancer (PCa) is the second most commonly diagnosed cancer for men worldwide.1 Diffusion-weighted imaging (DWI) is a non-invasive technique to evaluate the microscopic mobility of water molecules in tissues and has been used to detect and evaluate prostate tumors.2,3 Apparent diffusion coefficient (ADC) maps, which derived from DWI images and can reflect the histological characteristics of lesions and has also been served as supplementary images for the diagnosis of PCa.4,5 Differentiating PCa from benign prostatic hyperplasia (BPH) is still challenge using conventional multi-parameter magnetic resonance imaging due to the heterogeneous features of the lesions. Histogram and texture analysis is a widely used tool for accurate representation of the distribution of numerical data, which is particularly useful in evaluating the heterogeneous features of tumors.6-12 Therefore, the purpose of this study was to assess the usefulness of histogram and texture analyses of ADC maps for differentiating PCa from BPH with pathology as the reference.Methods
Subjects This retrospective study was approved by the local institutional review board and written informed consent was waived from each patient. 202 patients (age, 66.0±12.7 years; range, 37-86) with pathological proved as prostate cancer or benign prostatic hyperplasia were enrolled in the current study. MRI protocols All imaging was performed on a 3T MR system (MAGNETOM Skyra, Siemens Healthcare, Erlangen, Germany) using a standard 18-channel phased-array body coil and a 32-channel integrated spine coil. The main parameters of axial DWI were repetition time/echo time (TR/TE) = 5100/89 ms, field of view (FOV) = 224 × 280 mm2, matrix = 120 × 150, slices = 20, slice thickness = 4 mm, gap = 0 mm, acceleration factor = 2, b-values (number of signal averages) = 0 (1) and 1500 (6) s/mm2, diffusion directions were applied in three orthogonal directions and acquisition time = 2 min 30 s. Parameters for the T2-weighted turbo spin echo were TR/TE = 5460/104 ms, FOV = 180 × 180 mm2, matrix = 384 × 384, slices = 24, slice thickness = 4 mm, gap = 0 mm, echo train length = 18 and acquisition time = 3 min 49 s. Image analysis ADC map was inline calculated using the mono-exponential model, S(b) = S(0) e –b*ADC, where S(b) is the signal intensity with b-value >0, S(0) is the signal intensity with b-value =0. Whole-lesion histogram and texture analysis were performed on ADC maps with the prototype MR Multiparametric Analysis software (Siemens Healthcare, Erlangen, Germany) by the radiologist (X.P.Y). The statistical variables were extracted, including lesion volume, mean, standard deviation, median, 5th and 95th percentiles, diff-variance, diff-entropy, contrast, entropy, skewness, and kurtosis. In case of multicentric or multifocal lesions, the largest one was selected to analysis. Statistical analysis The differences in age, prostate-specific antigen (PSA) level and lesion volume between the PCa and BPH patients were compared using Mann-Whitney U test. The differences in statistical variables of histogram and texture analysis on ADC maps between the PCa and BPH patients were evaluated using independent sample t-test. In addition, the diagnosis performance of histogram and texture parameters on ADC maps in differentiating PCa from BPH was assessed using receiver operating characteristic (ROC) curves.Results
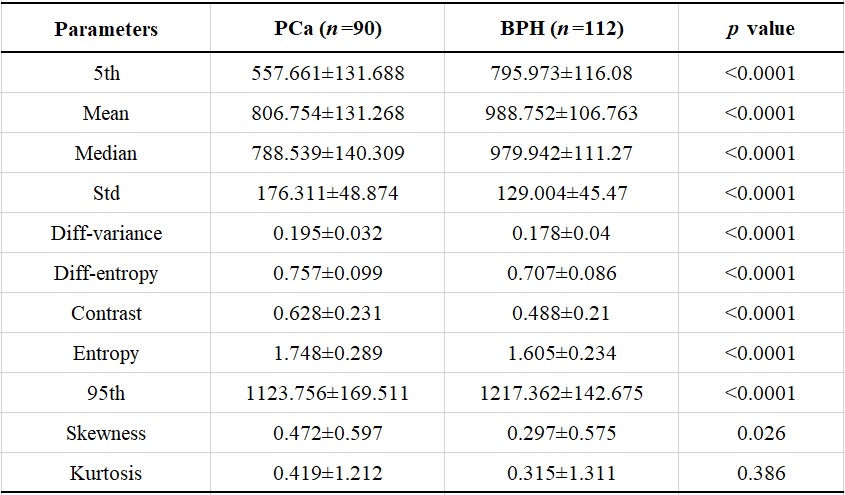
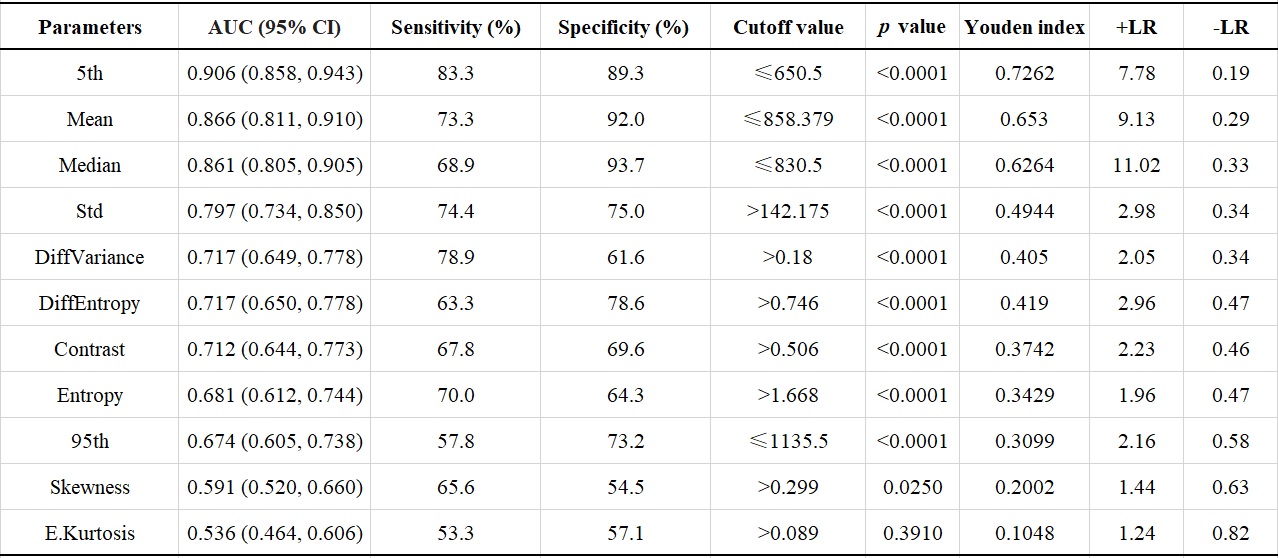
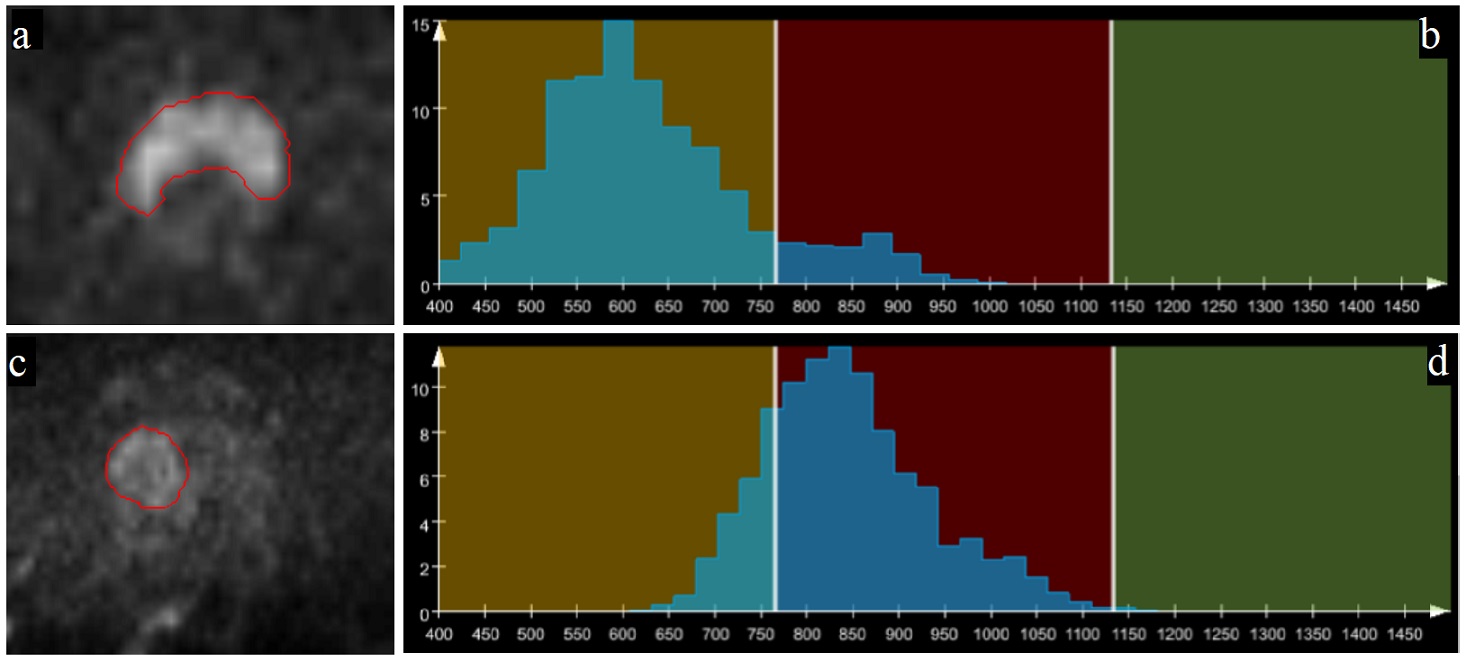
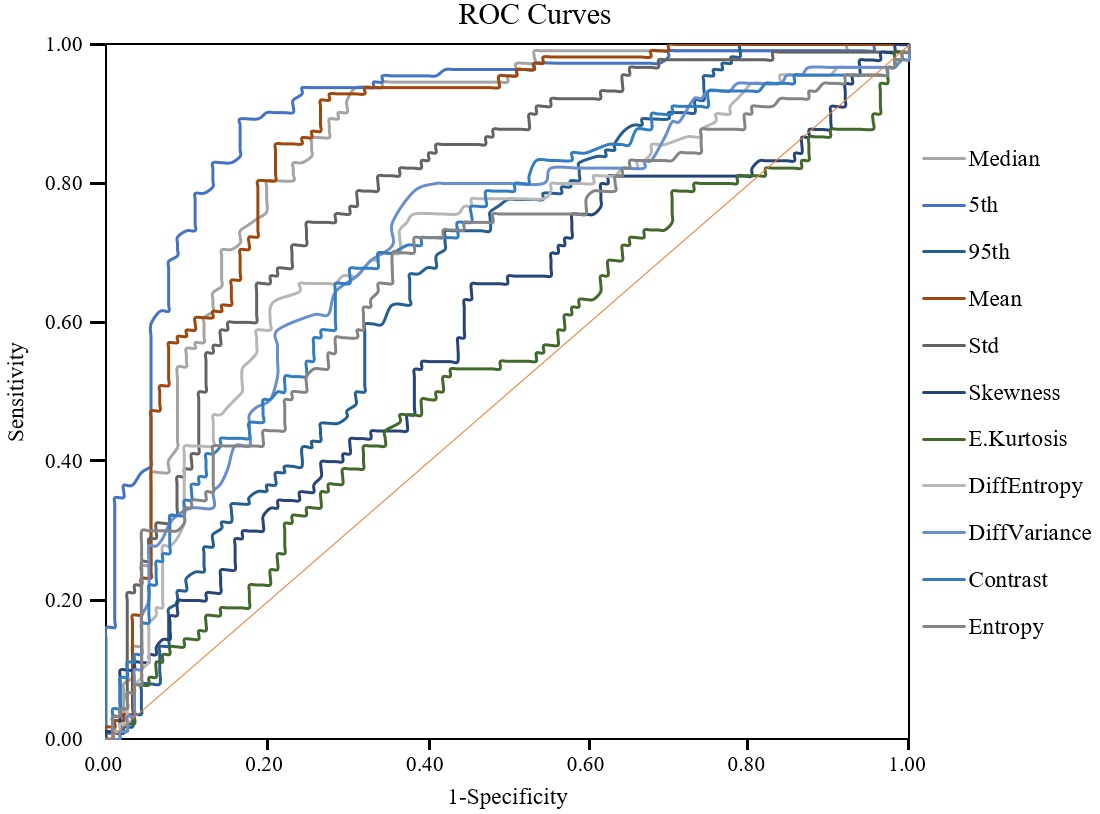
90 patients had PCa and 112 patients had BPH. There were significant differences in age (69.1±11.4 vs. 63.3±10.7 years, p<0.001), PSA (39.61±122.96 vs. 12.60±9.60 ng/ml, p<0.001) and lesion volume (6.4±12.6 vs. 2.2±7.5 cm3, p<0.001) between the PCa and BPH patients. The statistical results of the differences in histogram and parameters in terms of PCa and BPH patients are summarized in Table 1. Significant differences were observed in mean, standard deviation, median, 5th and 95th percentiles, diff-variance, diff-entropy, contrast, entropy and skewness (all p<0.05) except kurtosis (p=0.386) between the PCa and BPH patients. Table 2 shows the ROC results of qualitative histogram analysis in differentiating prostate cancer and benign prostatic hyperplasia. AUC, sensitivity and specificity were ranged from 0.536 to 0.906, 53.3% to 83.3% and 57.1% to 89.3%, respectively. The 5th percentile showed the largest AUC (0.906), with a sensitivity of 83.3% and specificity of 89.3%. ROC curve analyses for the histogram and texture parameters were showed in Figure 1. The workflows of the histogram and texture analysis are shown with two representative PCa and BPH patients (Figure 2).Discussion and Conclusion
In the present study, we evaluated the whole-lesion histogram and texture analysis of ADC maps for discriminating PCa and BPH with pathology as the reference standard. The results demonstrated that histogram and texture analyses of parameters from ADC can be useful for differentiating PCa from BPH. The mean, median, 5th and 95th percentiles of ADC values in PCa are significantly lower than in BPH patients. All of the ADC histogram parameters, except for kurtosis, were significantly different between PCa and BPH patients, which may be explained that the cellularity is more heterogeneous, dense and complex in PCa than that in BPH patients.9 In conclusion, the whole-lesion histogram and texture analysis-based parameters from the quantitative ADC map may serve as a useful biological characterization of prostate cancer.Acknowledgements
This work was supported by the National Key Clinical Specialist Construction Programs of China (Grant Number N/A). Thanks Siemens Healthcare for providing the prototype MR Multiparameter Analysis software to us for data anlysis.References
1. Torre LA, Siegel RL, Ward EM, et al. Global Cancer Incidence and Mortality Rates and Trends-An Update. Cancer Epidemiol Biomarkers Prev. 2015; 25:16-27
2. Mazzoni L. N., Lucarini S., Chiti S., et al. Diffusion-weighted signal models in healthy and cancerous peripheral prostate tissues: comparison of outcomes obtained at different b-values. J Magn Reson Imaging, 2014,39(3):512-518
3. Tamada T, Kido A, Takeuchi M, et al. Comparison of PI-RADS version 2 and PI-RADS version 2.1 for the detection of transition zone prostate cancer. Eur J Radiol. 2019;121:108704.
4. Hellms S, Gutberlet M, Peperhove MJ, et al. Applicability of readout-segmented echo planar diffusion weighted imaging for prostate MRI. Medicine (Baltimore). 2019; 98(29):e16447.
5. Surov A, Meyer HJ, Wienke A. Correlations between Apparent Diffusion Coefficient and Gleason Score in Prostate Cancer: A Systematic Review. Eur Urol Oncol. 2019; S2588-9311(18)30214-1.
6. Enkhbaatar NE, Inoue S, Yamamuro H, et al. MR Imaging with Apparent Diffusion Coefficient Histogram Analysis: Evaluation of Locally Advanced Rectal Cancer after Chemotherapy and Radiation Therapy. Radiology. 2018; 288:129-137
7. Peng Y, Jiang Y, Antic T, et al. Validation of quantitative analysis of multiparametric prostate MR images for prostate cancer detection and aggressiveness assessment: a cross-imager study. Radiology. 2014; 271:461-471.
8. Zhang YD, Wang Q, Wu CJ, et al. The histogram analysis of diffusion-weighted intravoxel incoherent motion (IVIM) imaging for differentiating the gleason grade of prostate cancer. Eur Radiol. 2015; 25:994-1004
9. Cui Y, Li C, Liu Y, et al. Differentiation of prostate cancer and benign prostatic hyperplasia: comparisons of the histogram analysis of intravoxel incoherent motion and monoexponential model with in‑bore MR‑guided biopsy as pathological reference. Abdom Radiol (NY). 2019. doi: 10.1007/s00261-019-02227-5
10. Wang Q, Li H, Yan X, et al. Histogram analysis of diffusion kurtosis magnetic resonance imaging in differentiation of pathologic Gleason grade of prostate cancer. Urol Oncol. 2015; 33(8):337.e15-24.
11. Xie T, Zhao Q, Fu C, et al. Differentiation of triple-negative breast cancer from other subtypes through whole-tumor histogram analysis on multiparametric MR imaging. Eur Radiol. 2019; 29(5):2535-2544.
12. Sun K, Zhu H, Chai W, et al. Whole-lesion histogram and texture analyses of breast lesions on inline quantitative DCE mapping with CAIPIRINHA-Dixon-TWIST-VIBE. Eur Radiol. 2019 [Epub ahead of print]
Figures