2414
Quantitative evaluation liver cyst, hemangioma and hepatocellular carcinoma by using T1 mapping and DWI
Fei Wang1, Yupei Zhang1, Mengxiao Liu2, and Juan Zhu1
1Department of MRI,AnQing Municipal Hospital, Anqing, China, 2MR scientific Marketing, Diagnostic Imaging, Siemens Healthcare Ltd, Shanghai, China
1Department of MRI,AnQing Municipal Hospital, Anqing, China, 2MR scientific Marketing, Diagnostic Imaging, Siemens Healthcare Ltd, Shanghai, China
Synopsis
In this study, pre- and post-contrast T1-mapping technique and DWI were used for differential diagnosis of hepatic cyst, hemangioma and HCC. pre- and post-contrast T1 value, the decrease rate of T1 value and ADC value of the three types of lesions were compared and analyzed.T1-mapping technology for differential diagnosis of hepatic cyst,hemangioma and HCC provides a new quantitative method, especially for no-enhanced T1-mapping, have promise of clinical application.
Purpose
To investigate the performence of T1 relaxation time and diffusion-weighted imaging (DWI) on 3T MRI in distinguishing liver cyst, hemangiomas and hepatocellular carcinoma (HCC).Materials and Methods
160 liver lesions (65 liver cysts, 60 hemangiomas and 35 HCC) were collected from 100 patients with a lesion diameter of more than 8mm. Data acquisitions were performed on a 3T MR scanner (Magnetom Skyra, Siemens Healthcare, Erlangen, Germany) with an 18-channel phased array coil. T1-mapping including B1 field calibration sequence (scan time 10s) and double-flip Angle (3o, 15o) 3D volumetric interpolated breath-hold examination (VIBE) sequence (scan time 18s) was applied before and 5 min after the injection of Gd-DTPA-BMA. pre- and post-contrast T1 value and ADC value were measured respectively, and the decrease rate of T1 value was calculated. One-way ANOVA analysis and ROC curve was applied to compare pre- and post-contrast T1 value,decrease rate of T1 value and ADC value, and intra-group correlation (ICC) analysis was performed for T1 value and ADC value pre- and post-contrast.Results
In 3T MRI, T1 value pre-contrast of liver cyst, hemangioma and HCC was 2720.4±157.03, 1645.66±69.72 and 1375.21±47.2ms, respectively. T1 value post-contrast was 2232.23±127.85, 285.84±15.1 and 425.71±20.01ms, respectively, with a decrease rate was 17.25%, 81.6% and 68.84%, respectively. ADC value(×10-3mm2/s) of liver cyst, hemangioma and HCC was 2.61±0.98, 1.58±0.9 and 0.98±0.42, respectively. pre- and post-contrast, T1 value, the decrease rate of T1 value and ADC value were significantly different in liver cyst, hemangioma and HCC(p<0.001).In the comparison between liver cyst and hemangioma, the ROC diagnostic boundary values of pre- and post-contrast T1 value and ADC value were 1780ms, 270ms and 1.492×10⁻³mm2/s, respectively, which had high sensitivity and specificity for the diagnosis of hemangioma. In the comparison between hemangioma and HCC, when pre-contrast T1 value and ADC value ROC diagnostic boundary value of were 1100ms and 0.97×10⁻³mm2/s, respectively, they had high sensitivity and specificity for the diagnosis of liver cancer, while post-contrast T1 value had poor differential diagnostic efficacy. Pre-contrast T1 and ADC values were highly consistent in the identification of hemangioma and liver cyst (ICC=0.93), hemangioma and HCC(ICC=0.965), respectively.Discussion and Conclusion
Except routine scan and dynamic contrast enhancement, DWI is one of the most important diagnostic methods for liver diseases. T1-mapping technology has the advantages of short scan time and can be quantitative analysis, it can make up for the DWI in the differential diagnosis of liver cyst and hemangioma part insufficient. What’s more, T1-mapping has better diagnostic efficiency before injection than post injection, thus avoiding unnecessary increase contrast agent used. It has potential clinical application value in the differential diagnosis of liver cyst, hemangioma and HCC.Acknowledgements
No acknowledgement found.References
- Ding Y, Rao SX, Chen Cel,et al.Assessing liver function in patients with HBV-related HCC: a comparison of T₁ mapping on Gd-EOB-DTPA-enhanced MR imaging with DWI.Eur Radiol,2015,25(5):1392-1398.
- Yoshimura N, Saito K, Saguchi T,et al.Distinguishing hepatic hemangiomas from metastatic tumors using T1 mapping on gadoxetic-acid-enhanced MRI.Magn Reson Imaging,2013,31(1):23-27.
Figures
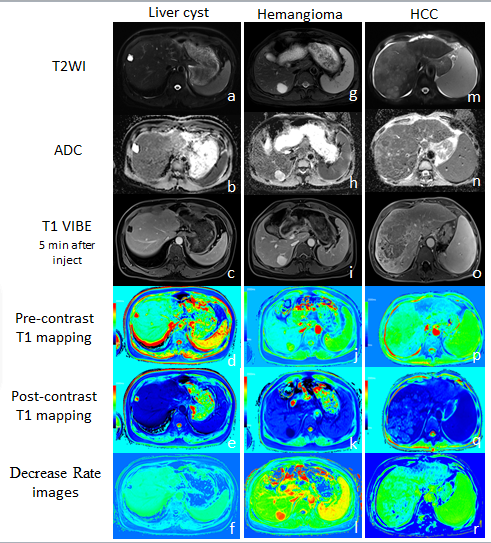
Figure 1. (a~f) Liver
cyst. appeared hyperintensity on
T2WI-fs and hypointensity on
contrast image, ADC value 2.81×10⁻³mm2/s, pre-contrast T1=3125ms, post-contrast
T1=2800ms, decrease rate of T1 = 10.4%.
(g~l) Hemangioma.
appeared hyperintensity on
both T2WI-fs and contrast image. ADC value 1.53×10⁻³mm2/s,
pre-contrast T1=1828ms, post-contrast T1=210ms, decrease
rate of T1 = 88.5%.
(m~r) HCC.
appeared hypointensity on
both T2WI-fs and delayed contrast
image.
ADC value 0.95×10⁻³mm2/s,
pre-contrast T1=1208ms, post-contrast T1=530ms, decrease
rate of T1 = 56.1%
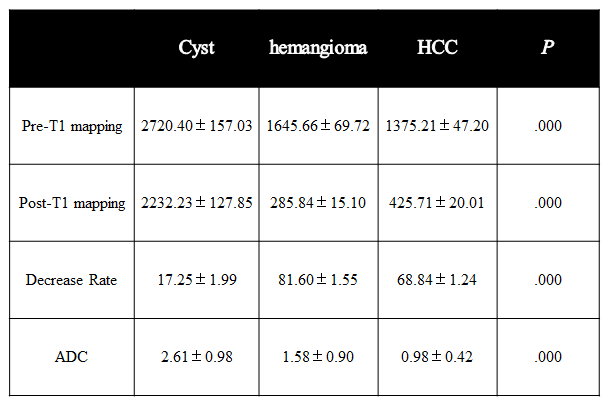
Table 1. liver cyst, hemangioma and HCC Multiparameter result
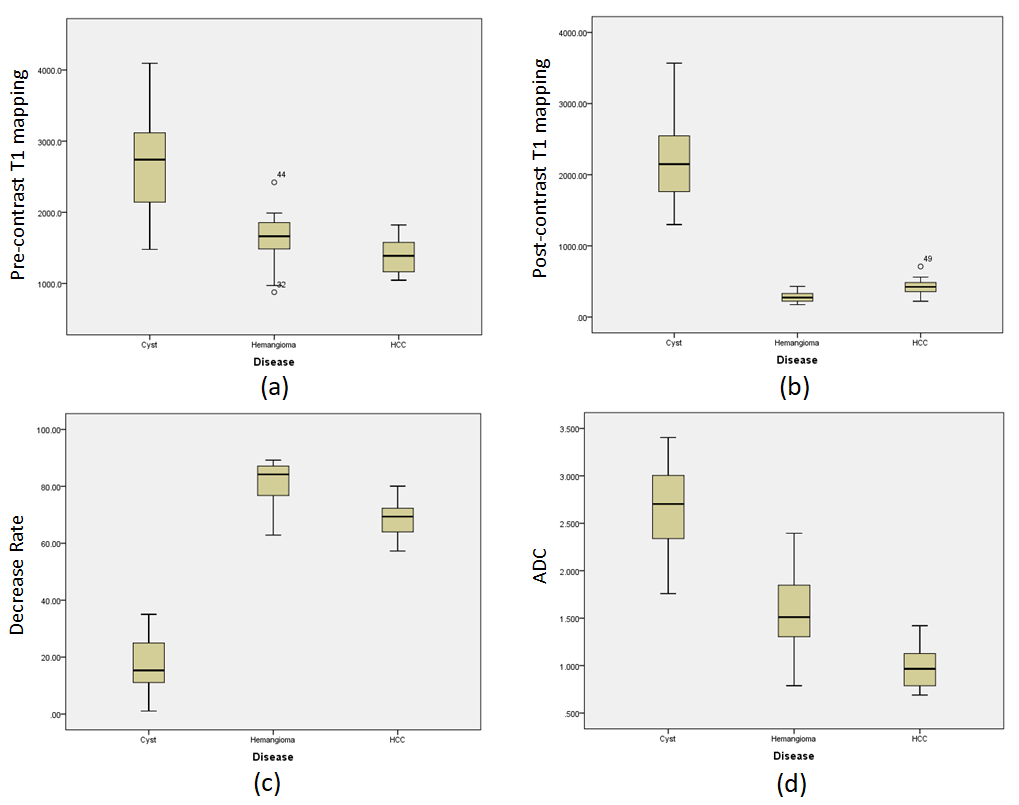
Figure 2. Boxplots of pre-
and post-contrast
T1 value,
decrease rate
and
ADC value