2413
Texture Analysis in MRI Diagnosis of Hepatocellular Carcinoma
Takeshi Yoshikawa1, Yoshiharu Ohno2, Ryo Shiroishi3, Masao Yui3, Yoshimori Kassai3, Shinichiro Seki4, Katsusuke Kyotani5, and Yuji Kishida6
1Kobe University Graduate School of Medicine, Kobe, Japan, 2Fujita Health University School of Medicine, Toyoake, Japan, 3Canon Medical Systems Corporation, Otawara, Japan, 4Hyogo Prefectural Tamba Medical Center, Tamba, Japan, 5Kobe University Hospital, Kobe, Japan, 6Konan Medical Center, Kobe, Japan
1Kobe University Graduate School of Medicine, Kobe, Japan, 2Fujita Health University School of Medicine, Toyoake, Japan, 3Canon Medical Systems Corporation, Otawara, Japan, 4Hyogo Prefectural Tamba Medical Center, Tamba, Japan, 5Kobe University Hospital, Kobe, Japan, 6Konan Medical Center, Kobe, Japan
Synopsis
Texture analysis can characterize spatial variations of gray levels on an image. Our results showed texture analysis has a potential to improve MR ability in diagnosis of hepatocellular carcinoma. Optimal imaging techniques might be different from ones for visual assessment. Capsule, hemorrhage, and cellularity in HCC are possible influential factors.
Backgrounds & Purpose
Backgrounds- Texture analysis can characterize spatial variations of gray levels on an image, even if not detected by the human eye, using a series of mathematical processes to generate parameters associated with the image texture.
- It was originally developed to quantify lay of the land through satellites’ single eye.
- It has been applied to many fields of imaging research including diagnostic radiology.
- Previous studies have used this technique for MR assessment of liver fibrosis and tumors.
- In liver tumors, it was reported to be potentially useful for tumor differentiation, grading, predictions of hypervascularization, response to therapy, and prognosis.
- However, the techniques used showed a huge variety and imaging technique of choice is still unknown. The relations between visual findings and texture parameters has not been evaluated.
- The purpose of this study was to assess texture analysis in MRI diagnosis of hepatocellular carcinoma (HCC).
Methods and Materials
Patients & Lesions- 26 patients (16 men and 10 women, mean age: 71.0 years), who were suspected and confirmed to have HCC, and also underwent EOB-enhanced 3T-MRI, were chosen and retrospectively analyzed.
- A maximum of 3 HCCs per a patient and only the lesions with arterial-phase enhancement were chosen for analysis. Lesions with a diameter less than 10mm were excluded.
- A total of 36 HCC were confirmed and evaluated.
- All patients underwent MRI at a 3T scanner (Vantage Titan 3T; Canon Medical Systems, Otawara, Japan).
- T1WI in-phase & opposed-phase, fat-saturated T2WI, DWI (b=1000), EOB-enhanced arterial (AP), portal (PP), transitional (TP), and hepatobiliary phase (HBP) images, were obtained as routine sequences in our institution.
- Oval ROIs in the liver and polygonal ones in HCC lesions were placed on the 8 images.
- 92 texture features (First order, GLCM, GLSZM, GLRLM, NGTDM, GLDM, figs. 1 & 2) were measured on a prototype software (OleaSphere; Olea Medical, La Ciotat, France).
- Processes of texture analysis is shown in fig. 3.
- Two readers independently reviewed and recorded image findings of each HCC lesion by means of LI-RADS 2019 version (modified into 5-point scales, 0: definitely absent, 5: definitely present).
- Consensus was made for each LI-RADS feature.
- Threshold growth in major features and US visibility and subthreshold growth were not used because of the study design.
- The features in the liver and lesion were compared using U-test.
- Feature selection was done by Matlab Statistics and Machine Learning Toolbox.
- Capability of each image for tissue differentiation was assessed by logistic regression and ROC analysis.
- The relations between all LI-RADS features and selected texture features were evaluated by non-parametric correlation analyses.
Results
- By U-test, features with significant differences were found most on T1WIin, followed by TP, HBP, and PP (fig. 4).
- By U-test analysis, features with significant difference were found most in First Order, followed by GLCM and GLSZM (fig. 5).
- Selected numbers of feature by logistic regression were largest on T1WIin, followed by TP and HBP. (fig. 4).
- As for tissue differentiation, Az was the highest on TP, followed by HBP and T2WI (figs. 6 & 7).
- No significant strong correlation (γ>0.70) between LI-RADS features and texture features was found.
- A total of 66 moderate and significant correlations (0.70>γ≥0.40) were found, most on T2WI and TP (n:18) followed by DWI (9). Enhancing capsule showed most correlations (n:16) followed by blood products in mass (15) and mid-moderate T2 hyperintensity (12) (figs. 8 & 9).
Summary & Conclusion
Summary- Texture analysis using routine liver MR images showed excellent performance in tissue characterization.
- EOB-enhanced transitional phase images showed the best performance. Optimal imaging techniques for texture analysis might be different from ones for visual assessment.
- Differences in matrix size, distortion, artifact, w/wo fat suppression, or w/wo contrast might affect the results.
- No significant strong correlation with visual assessment was found. Texture analysis has a potential to make use of information on image which cannot be detected by the human eye.
- Moderate correlations with LI-RADS features were found. Tumor capsule, hemorrhage, and cellularity were supposed to be influential factors in HCC.
- Texture analysis using routine liver MR images showed excellent performance in tissue characterization.
- Optimal imaging techniques for texture analysis might be different from ones for visual assessment.
- Tumor capsule, hemorrhage, and cellularity in HCC are possible influential factors for texture analysis.
Acknowledgements
No acknowledgement found.References
- Li Y, et al. Clin Radiol 2019.
- Wang HQ, et al. Eur J Radiol 2019.
- Zhu YJ, et al. Oncol Lett 2019.
- Stocker D, et al. Heliyon 2018.
- Zhang J, et al. Acad Radiol. 2019.
- Hui TCH, et al. Clin Radiol 2018.
- Yu JY, et al. Clin Radiol 2018.
- Li Z, et al. BMC Med Imaging 2017.
- Gatos I, et al. Med Phys 2017.
- Zhou W, et al. J Magn Reson Imaging 2017.
- Rosenkrantz AB, et al. Abdom Radiol (NY) 2016.
- Mayerhoefer ME, et al. J Magn Reson Imaging 2010.
Figures
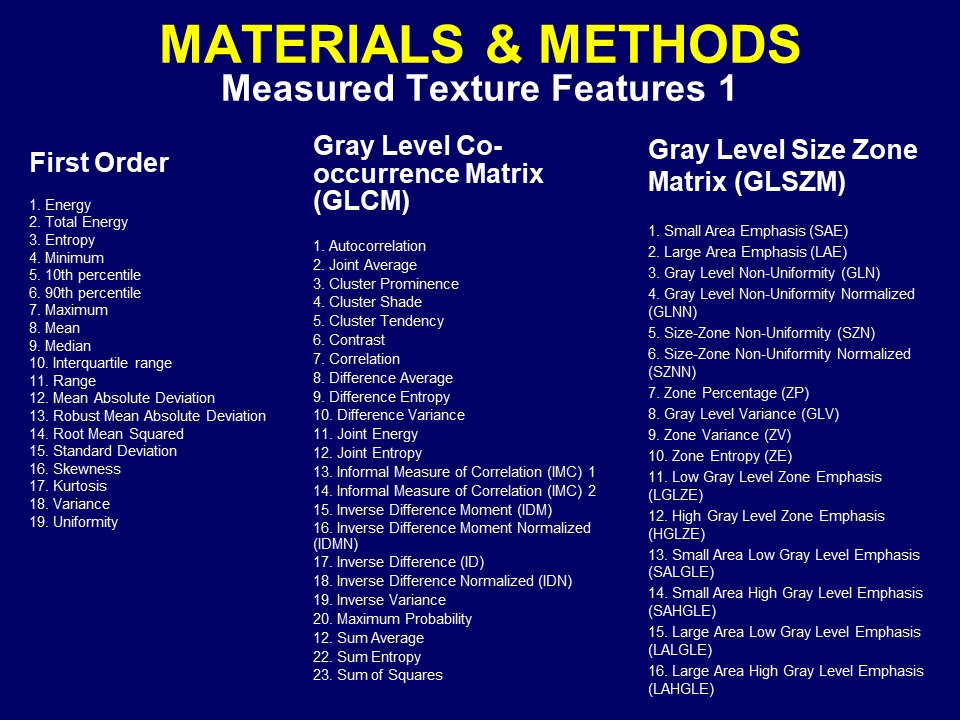
Figure 1. Measured
Texture Features 1
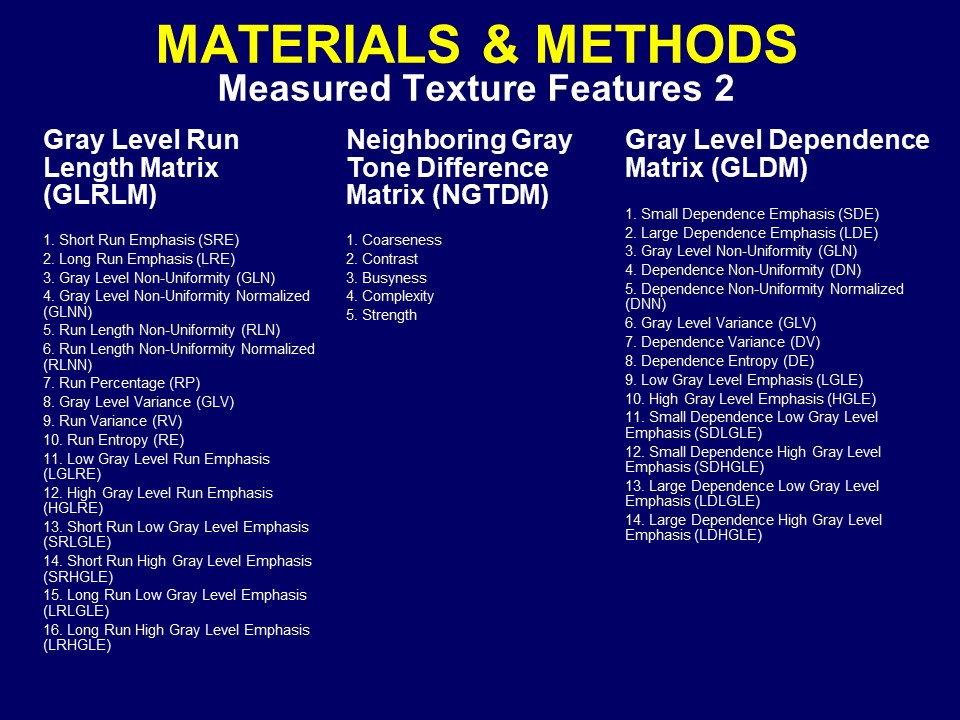
Figure 2. Measured Texture Features 2
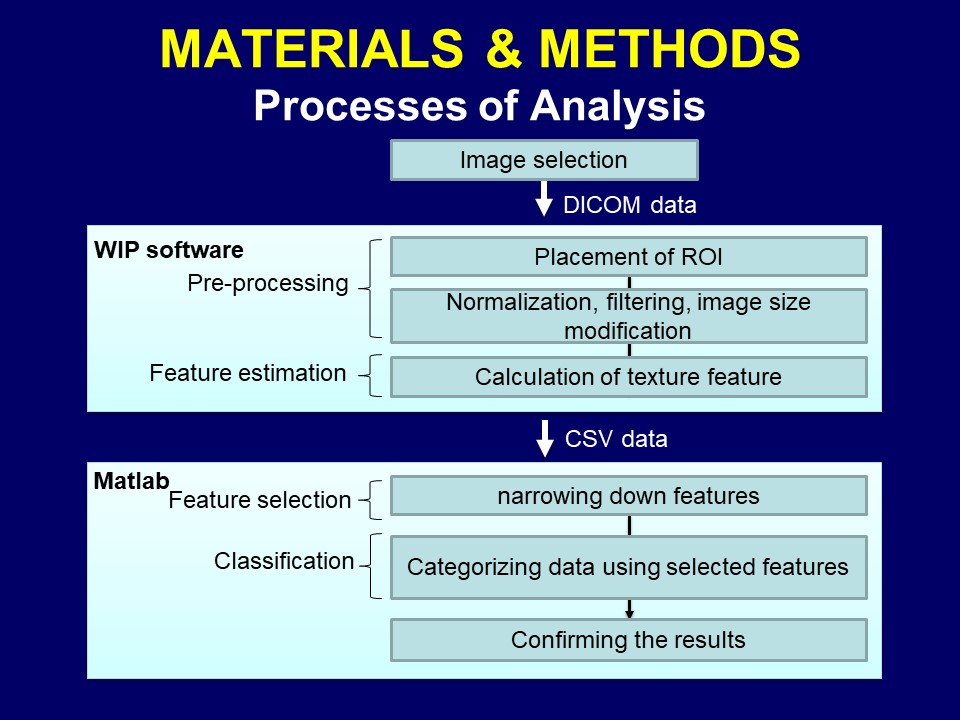
Figure 3. Processes of Texture Analysis
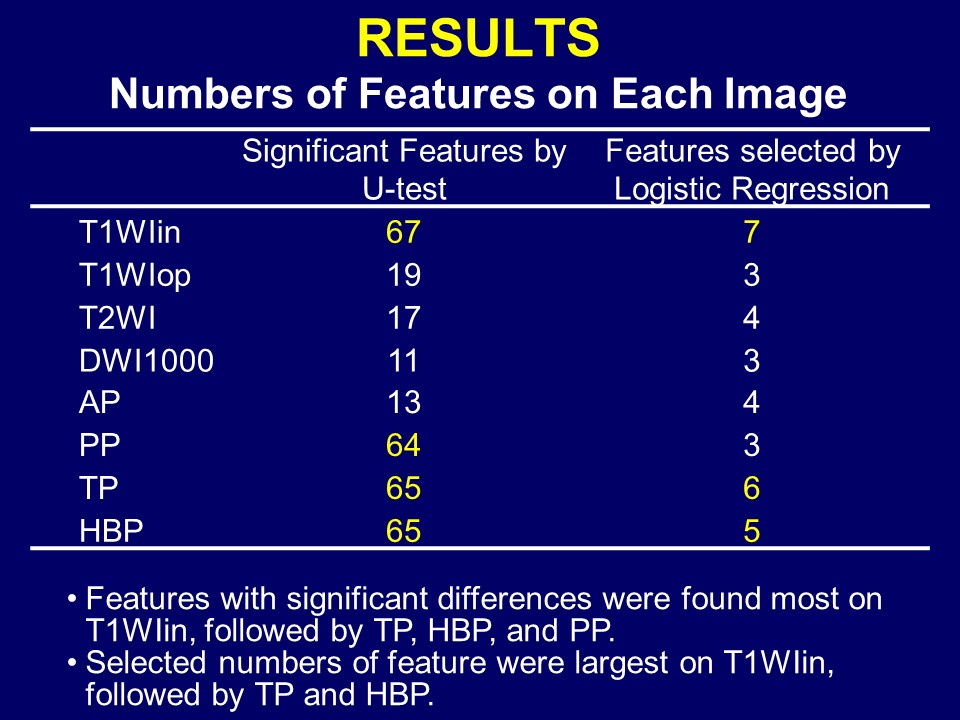
Figure 4.
Numbers of Significant Features on Each Image
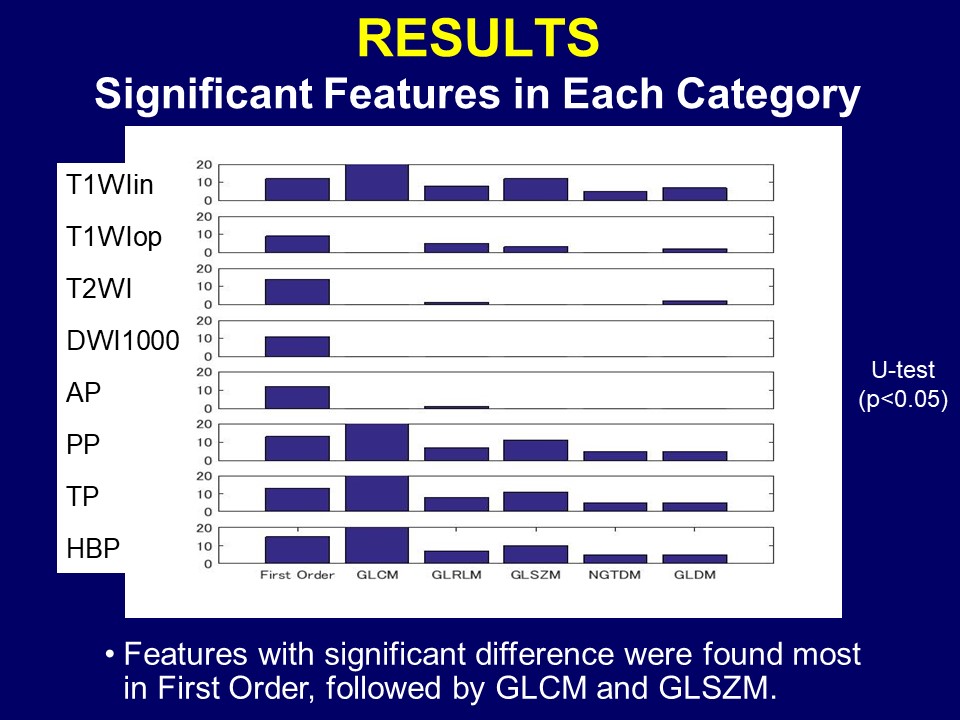
Figure 5. Numbers of Significant Features in Each Category
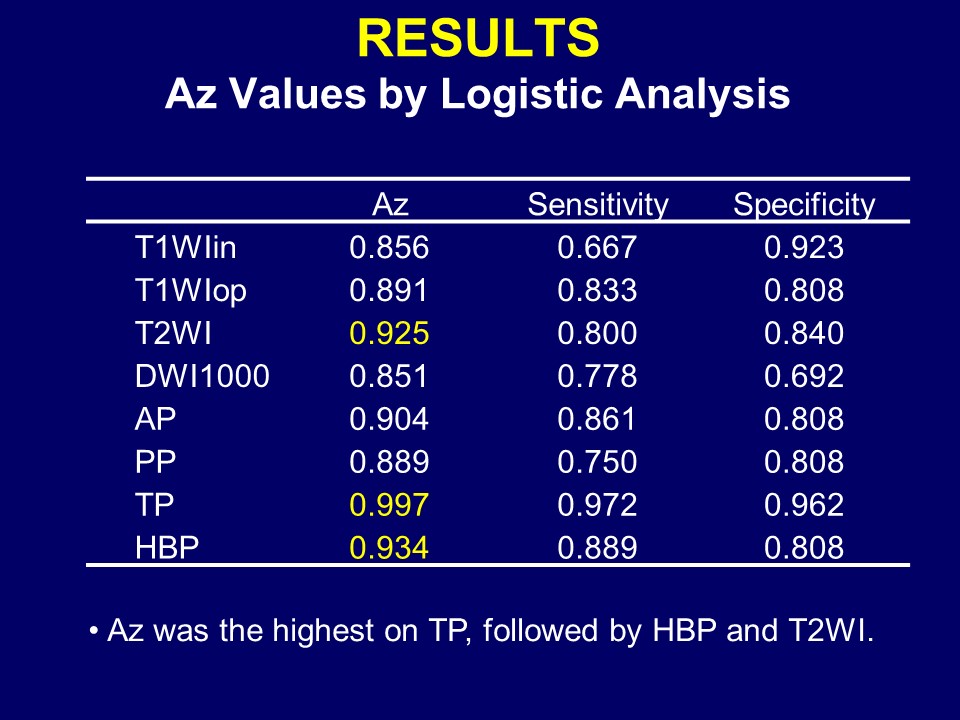
Figure 6. Az Values by Logistic Analysis
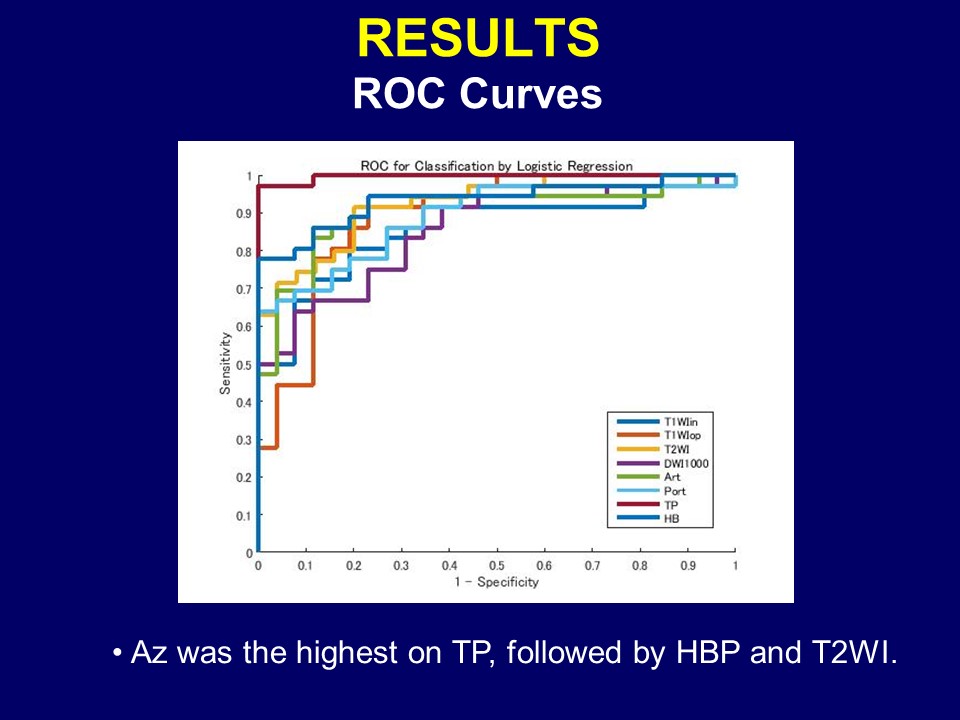
Figure 7. ROC Curves
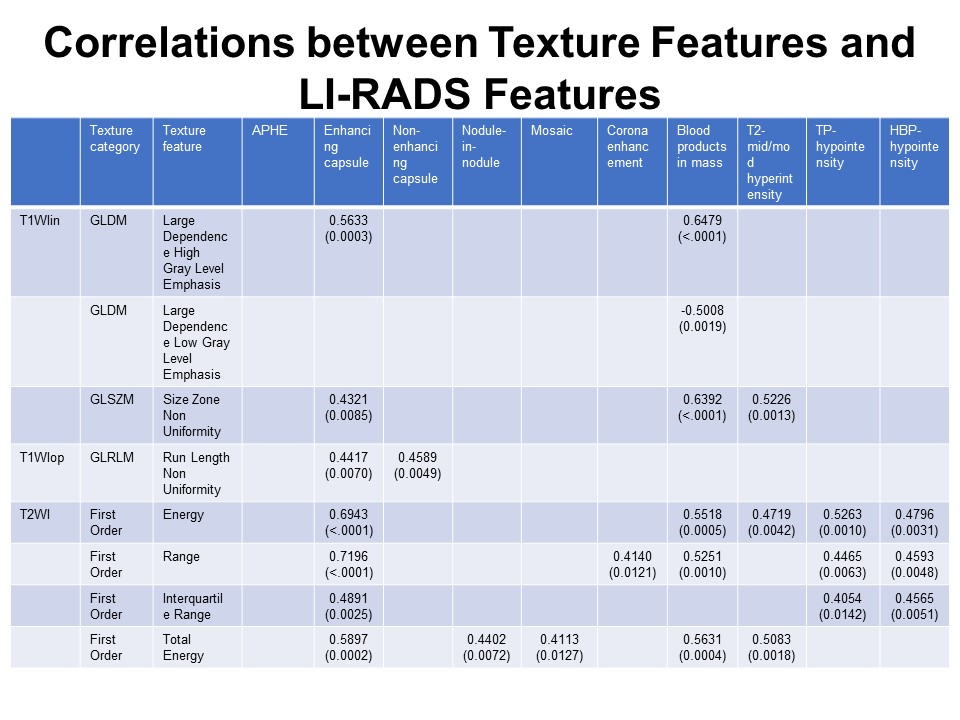
Figure 8. Correlations
between Texture Features and LI-RADS Features
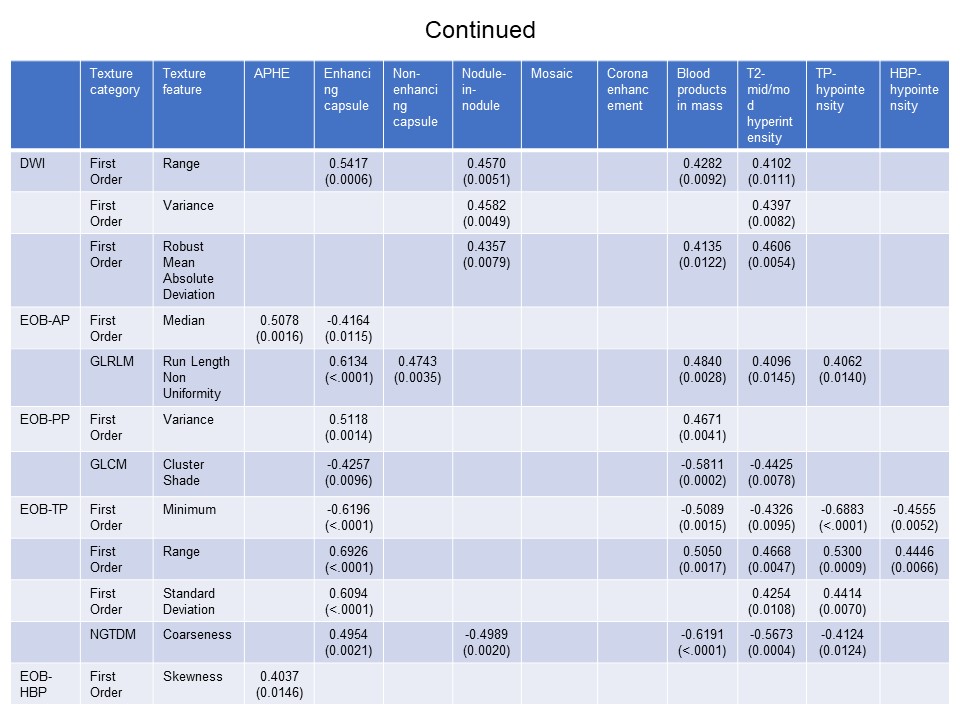
Figure 9. Correlations between Texture Features and LI-RADS Features (continued)