2411
Diagnosis of LR-M in at risk patients: performances of serological tumor markers and LI-RADS version 2018 features1Department of Radiology, West China Hospital, Sichuan University, Chengdu, China, 2Department of Radiology, Duke University Medical Center, Durham, NC, United States
Synopsis
The aim of this study was to develop diagnostic models comprising serological tumor markers and gadoxetate disodium-enhanced magnetic resonance imaging (EOB-MRI) features for patients with LR-M lesions by LI-RADS version 2018 (v2018). We retrospectively analyzed prospectively collected data from 45 consecutive at risk patients with LR-M observations and generated diagnostic models for LR-M to predict tumors with a cholangiocarcinoma component (M-CC). Among these models, carbohydrate antigen (CA) 19-9 alone demonstrated excellent diagnostic specificity, while the model integrating both CA 19-9 and the EOB-MRI feature “blood products in mass” achieved optimal overall performance.
Introduction
According to the latest versions of Liver Imaging Reporting and Data System (LI-RADS) 1-3, the LR-M category is used to describe hepatic lesions which are probably or definitely malignant, but not specific for hepatocellular carcinoma (HCC) in at-risk patients. Intrahepatic cholangiocarcinoma (ICC) and HCC are the two leading histologic tumor types for LR-M, with other relatively rare etiologies including combined hepatocellular-cholangiocarcinoma (c-HCC-CCA), metastatic tumors, and others4-6. Differentiation between these entities is critical in terms of treatment and prognosis, and detection of cholangiocarcinoma-containing tumors is of high importance. However, diagnosis of LR-M lesions to date requires histopathologic confirmation before treatment, which may give rise to unintended biopsy-related complications and delayed treatment1,7. To address this diagnostic dilemma, prior studies have explored the potential of using imaging features to distinguish between HCC and other hepatic malignancies5,6,8. Most of those are retrospective case-control studies without exclusive focus on LR-M lesions and do not include serological markers, thus they might not mimic what is observed in real-world settings.Thus, we aimed to develop diagnostic models for the diagnosis of ICC-containing lesions, incorporating both serological tumor markers and gadoxetate disodium-enhanced magnetic resonance imaging (EOB-MRI) features for LR-M lesions.
Methods
This single-center study was approved by our Institutional Review Board, and the acquisition of informed consent was waived because we retrospectively used data from a prospective clinical cohort [Clinical trial registration No: ChiCTR1900026668]. Between July 2015 and September 2019, consecutive at-risk patients who underwent 3.0T EOB-MRI were prospectively enrolled at our tertiary care hospital. Three blinded abdominal radiologists independently reviewed all MR images and assigned LI-RADS v2018 categories to each observation with consensus interpretations determined by majority vote. Patients who had LR-M observations but no co-existing LR-4, LR-5, or LR-TIV observation were included for further analyses. Clinically relevant serological tumor marker values (α-fetoprotein [AFP], carcinoembryonic antigen [CEA] and carbohydrate antigen [CA] 19-9) were recorded. Histopathologic examination was used as the reference standard for all included observations.To generate diagnostic models for LR-M, serological tumor markers were selected by t test or Mann-Whitney test, where applicable, with the optimal cutoff values decided either by receiver operating characteristic (ROC) analysis or to achieve over 95.0% diagnostic specificity. LI-RADS imaging features were selected based on inter-rater agreement (Fleiss’ kappa), prevalence, univariate and binary logistic regression analyses according to a stepwise algorithm (Figure 1). Performances of the developed models were evaluated with regard to area under the ROC curve (AUC), Akaike information criterion (AIC), sensitivity, specificity, and accuracy. McNemar’s test and the Delong test were used to compare pairwise sensitivities, specificities and AUCs, where applicable.
Results
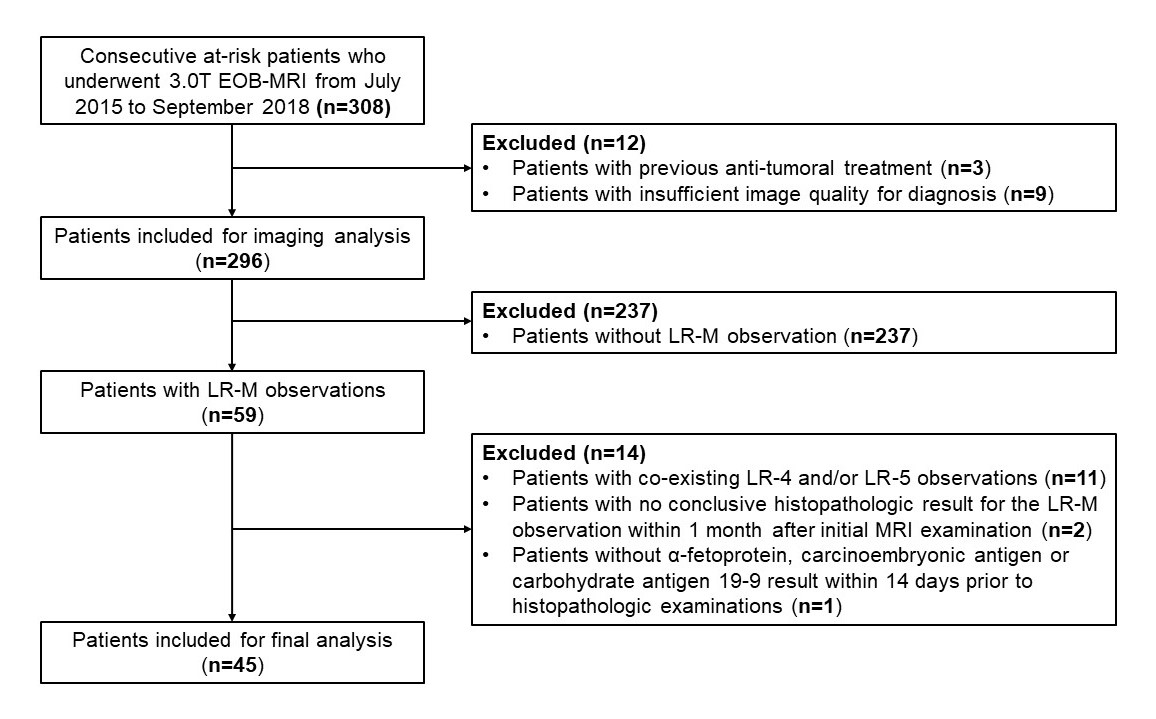
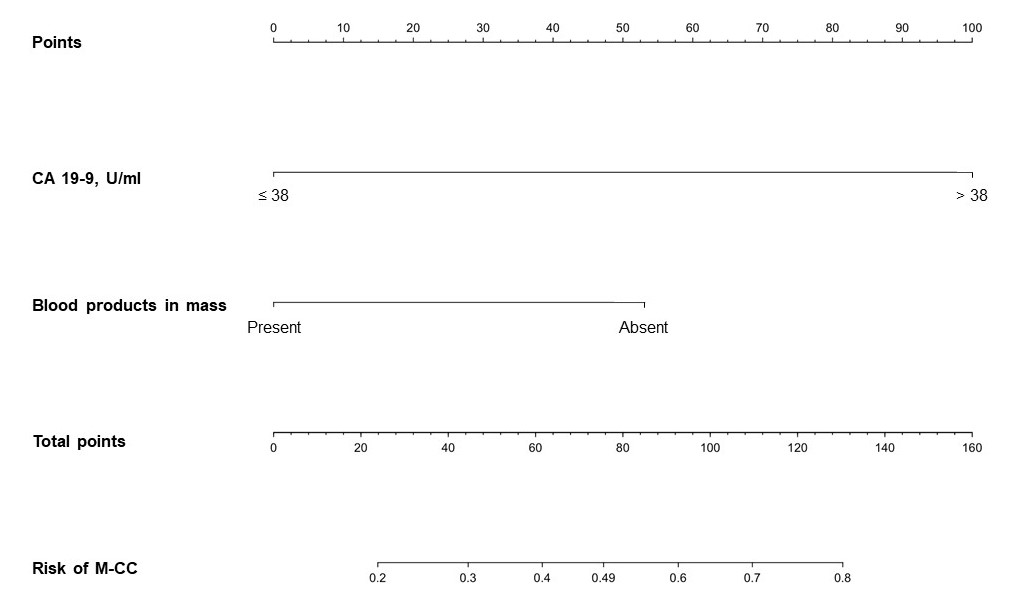
45 consecutive patients (37 males, 82.2%) were included (Figure 2), 42.2% (19/45) with HCC, 33.3% (15/45) with ICC, 13.3% (6/45) with c-HCC-CCA, and 11.1% (5/45) with other benign or malignant histologically proven hepatic lesions. Based on the selection algorithm, ICC and c-HCC-CCA were combined as a new category “LR-M with cholangiocarcinoma component (M-CC)”. CA 19-9 and “blood products in mass” were identified as the only significant predictors of M-CC (Figure 1). Four diagnostic models were constructed and compared as follows: 1) optimal serological model (Model S, CA 19-9 threshold value 38 U/ml); 2) optimal radiological model (Model R, with “blood products in mass” the only feature); 3) fusion model integrating serology and imaging features (Model F, Figure 3); 4) high-specificity model considering both serology and imaging features as candidates (Model Spec, ultimately including only CA 19-9 with a threshold value 55 U/ml).Per-patient sensitivity, specificity, and AUC were as follows for each model: Model S (serology alone) – 66.7%, 87.5%, 0.771; Model R (radiological feature alone) - 81.0%, 50.0%, 0.655; Model F (fusion of serology and radiological features) - 66.7%, 87.5%, 0.820; Model Spec (high-specificity model) – 47.6%, 95.8%, 0.717. Among all models, Model F demonstrated the highest AUC (p=0.013-0.060 compared pairwise with the other models), AIC and accuracy. Model R demonstrated the lowest specificity (p<0.001-0.002).
Discussion
While most literature attempting to determine histological subtypes of LR-M lesions has focused on imaging features, we found that combining a CA 19-9 value ≥ 38 U/mL with the EOB-MRI features “blood products in mass” performed better for detecting cholangiocarcinoma-containing tumors (M-CC) than any model based on imaging features alone. Additionally, in order to obviate the need for biopsy, we derived a model highly specific for M-CC and found that a CA 19-9 value ≥ 55 U/mL provided >95% specificity. Importantly, no imaging feature achieved similar high specificity for M-CC, so for a high-specificity model, we propose the use of the CA 19-9 value alone. The detection of M-CC lesions is highly clinically relevant because in current treatment paradigms, optimal treatment is often dictated by the presence or absence of a cholangiocarcinoma within the tumor9-11.Conclusion
In patients with LR-M observations, tumor marker CA 19-9 demonstrated excellent diagnostic specificity for cholangiocarcinoma-containing tumors. A fusion model integrating both CA 19-9 and the EOB-MRI feature “blood products in mass” achieved optimal overall performance for detecting cholangiocarcinoma-containing tumors.Acknowledgements
This work was supported by the National Natural Science Foundation of China (No. 81771797) and the 1.3.5 project for disciplines of excellence, West China Hospital, Sichuan University (ZYJC18008).References
1. American College of Radiology. CT/MRI LI-RADS version 2018. https://www.acr.org/Clinical-Resources/Reporting-and-Data-Systems/LI-RADS/CT-MRI-LI-RADS-v2018. Accessed November 1, 2019.
2. Kielar AZ, Chernyak V, Bashir MR, et al. LI-RADS 2017: An update. J Magn Reson Imaging. 2018;47(6):1459-1474.
3. Mitchell DG, Bruix J, Sherman M, Sirlin CB. LI-RADS (Liver Imaging Reporting and Data System): summary, discussion, and consensus of the LI-RADS Management Working Group and future directions. Hepatology. 2015;61(3):1056-1065.
4. van der Pol CB, Lim CS, Sirlin CB, et al. Accuracy of the Liver Imaging Reporting and Data System in Computed Tomography and Magnetic Resonance Image Analysis of Hepatocellular Carcinoma or Overall Malignancy-A Systematic Review. Gastroenterology. 2019;156(4):976-986.
5. Kim YY, Kim MJ, Kim EH, et al. Hepatocellular Carcinoma versus Other Hepatic Malignancy in Cirrhosis: Performance of LI-RADS Version 2018. Radiology. 2019;291(1):72-80.
6. Fraum TJ, Tsai R, Rohe E, et al. Differentiation of Hepatocellular Carcinoma from Other Hepatic Malignancies in Patients at Risk: Diagnostic Performance of the Liver Imaging Reporting and Data System Version 2014. Radiology. 2018;286(1):158-172.
7. Marrero JA, Kulik LM, Sirlin CB, et al. Diagnosis, Staging, and Management of Hepatocellular Carcinoma: 2018 Practice Guidance by the American Association for the Study of Liver Diseases. Hepatology. 2018;68(2):723-750.
8. Choi SH, Lee SS, Kim SY, et al. Intrahepatic Cholangiocarcinoma in Patients with Cirrhosis: Differentiation from Hepatocellular Carcinoma by Using Gadoxetic Acid-enhanced MR Imaging and Dynamic CT. Radiology. 2017;282(3):771-781.
9. Yin X, Zhang BH, Qiu SJ, et al. Combined hepatocellular carcinoma and cholangiocarcinoma: clinical features, treatment modalities, and prognosis. Ann Surg Oncol. 2012;19(9):2869–2876.
10. Sapisochin G, Fidelman N, Roberts JP, Yao FY. Mixed hepatocellular cholangiocarcinoma and intrahepatic cholangiocarcinoma in patients undergoing transplantation for hepatocellular carcinoma. Liver Transpl. 2011;17(8):934–942.
11. Joo I, Lee JM, Yoon JH. Imaging Diagnosis of Intrahepatic and Perihilar Cholangiocarcinoma: Recent Advances and Challenges. Radiology. 2018;288(1):7-13.
Figures