2408
The value of multi-quantitative parameters of DKI to evaluate the pathological grade of hepatocellular carcinoma (HCC): a preliminary study1Department of Radiology, the First Affiliated Hospital of Dalian Medical University, Dalian, China, 2Translational Medicine Team, GE Healthcare, Shanghai, China, 3GE Healthcare, Beijing, China
Synopsis
The main purpose of this work was to use multi-quantitative parameters of DKI to evaluate the pathological grade of HCC before surgery. The results showed that FA have a powerful value in preoperative assessment of pathological grade of HCC (AUC:0.716; sensitivity:73.7%; specificity: 65.0%).
Purpose
To explore the value of multi-quantitative parameters of diffusional kurtosis imaging (DKI) in preoperative assessment of the pathological grade in hepatocellular carcinoma (HCC) patients.Introduction
HCC is the third most common malignant tumors in the worldwide, with a five-year survival rate of only 18%[1]. Because the treatment and prognostic evaluation methods between good and malignant properties of liver tumors are vary widely, early detection and clear liver tumor's good and malignant properties are of great clinical significance for diagnosis, treatment and follow-up of disease. DKI, first proposed by Professor Jenson in 2005, is an extension of diffusion weighted imaging (DWI) and diffusion tensor imaging (DTI). It was based on the water molecule non-gauss distribution model, so that it can reflect micro-changes in the microstructure of biological tissues more accurately [2-3]. DKI can provide multi-quantitative parameters, including mean kurtosis (MK), axial kurtosis (Ka), radial kurtosis (Kr), fractional anisotropy of kurtosis (FAK), mean diffusivity (MD), axial diffusivity (Da), radial diffusivity (Dr) and fractional anisotropy(FA). At present, some scholars think that DKI is valuable in identifying pathological grade of HCC[4].Materials and Methods
The present study retrospectively analyzed 39 cases (male: 29 cases, female: 10 cases; age: (62.49±9.73) years old) which pathological confirmed as HCC. All patients have underwent preoperative MR examinations within one month, including routine scanning (T1WI, T2WI, and dynamic contrast-enhanced MR imaging and additional DKI sequence (b value=0, 1000, 2000 (s/mm2)). According to the pathological grade, 39 cases were divided into poorly differentiated HCC group (20 cases) and non-poorly differentiated HCC group (19 cases). MK, Ka, Kr, FAK, MD, Da, Dr and FA images were derived using Functool software on GE AW4.6 workstation, where these values were measured. The radiologist manually outlined the region of interests (ROIs) at the maximum slice of the lesion and its adjacent two slices, with ROI size of 1/3-1/2 of the lesion, avoiding necrosis and bleeding area (Figure 1-2). Data analyses were performed using SPSS 21.0 statistical software. Independent sample t test was used to compare Kr and FA values between the two groups, and Mann-Whitney U test was used to compare MK, Ka, FAK, MD, Da and Dr values. Diagnostic performance was evaluated by receiver operating characteristic (ROC) analysis.Results
There was a significant difference in FA value between poorly differentiated HCC group (0.287±0.088) and non-poorly differentiated HCC group (0.373±0.120), P value was 0.014. However, there was no statistical difference in Kr, MK, Ka, FAK, MD, Da and Dr values between the two groups, with P values of 0.636, 0.757, 0.361, 0.482, 0.643, 0.187 and 0.811, respectively (Table 1). Results indicated that FA was the optimal strategy to identify poorly differentiated HCC and non-poorly differentiated HCC (AUC: 0.716, Cutoff value:≥0.287; sensitivity: 73.7%, specificity: 65.0% ) (Figure 3).Discussion and Conclusion
The FA value reflects the anisotropy level of water molecule movement in the tissue and is closely related to the integrity of the tissue fiber bundle and the consistency of direction[5]. There was a statistical difference in FA value between two groups in this study, and it is speculated that there are different in fiber bundle integrity and direction consistency between the two groups, which may be related to the different degree of destruction of fiber bundle in two groups. MK, Ka and Kr values are all proportional to the complexity of the organization; MD, Da and Dr values are all proportional to the degree of freedom of movement of water molecules and FAK value represents anisotropy between diffusional kurtosis in the 3 axis directions of the diffusion of water molecules[6]. There were no statistical differences of the seven parameters between the poorly and non-poorly differentiated HCC groups. The possible reason is that it has little difference in micro-blood supply and the structure of tumor survival microenvironment between poorly and non-poorly differentiated HCC groups. So that, the change of water molecular movement between two groups is not obvious. The study needs to be further explored.The FA value derived from DKI has some value in preoperative identification of pathological grade of HCC.
Acknowledgements
No acknowledgement found.References
[1] SIEGEL RL, MILLER KD, JEMAL A. Cancer statistics, 2018. CA Cancer J Clin, 2018, 68(1): 7-30.
[2] Jensen JH, Helpern JA, Ramani A, et a1. Diffusional kurtosis imaging: the quantification of non gaussion water diffusion by means of magnetic resonance imaging[J]. Magn Reson Med, 2005, 53(6): 1432-1440.
[3] Jensen JH, HeIpern JA. MRI quantification of non-Gaussian water diffusion by kurtosis analysis[J]. NMR Biomed, 2010, 23(7): 698-710
[4] Budjan J, Sauter EA, Zocllner FG, et al. Diffusion kurtosis imaging of the liver at 3 Tesla: invivo comparison to standard diffusion weighted imaging[J]. Acta Radiol, 2018, 59: 18-25.
[5] McKenna BS, Brown GG, Archibald S, et al. Microstructural changes to the brain of mice after methamphetamine exposure as identified with diffusion tensor imaging[J]. Psychiatry Res, 2016, 249(1): 27-37.
[6] Zhao L, Wang Y, Jia Y, et al. Microstructural abnormalities of basal ganglia and thalamus in bipolar and unipolar disorders: a diffusion kurtosis and perfusion imaging study [J]. Psychiatry Investig, 2017, 14(4): 471-482.
Figures
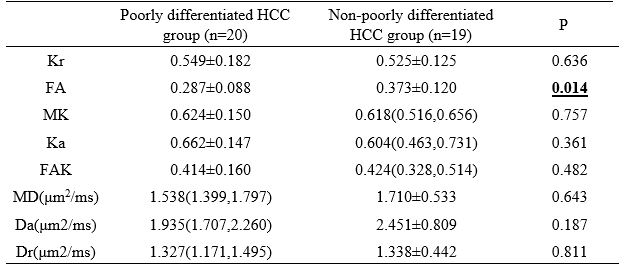
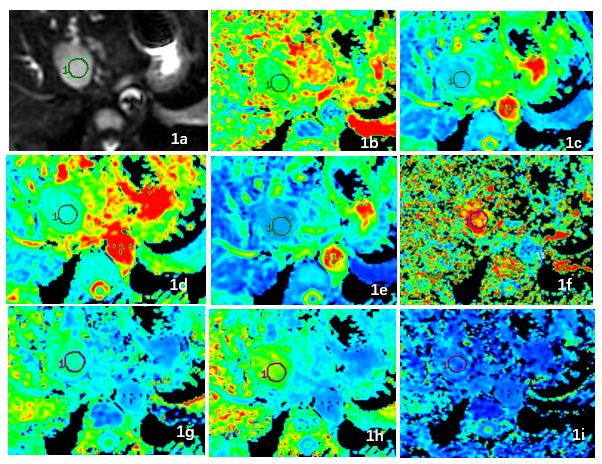
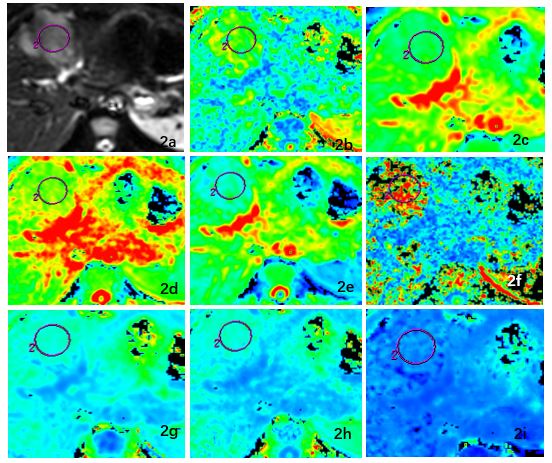
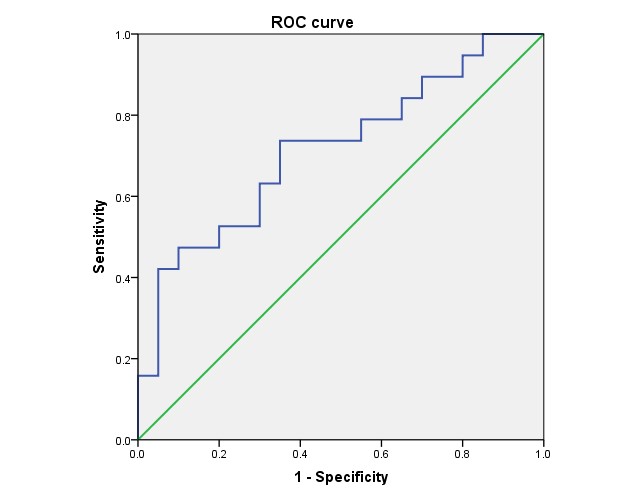
Figure 3. The ROC curve that prediction of non-poorly
differentiated HCC group of FA.