2407
Longitudinal study of liver imaging reporting and Data system LR-2, LR-3 and LR-4 observations in cirrhosis on MRI1The Third Hospital Affiliated of Nantong University, Nantong, China
Synopsis
Using LI-RADS v2018 on MRI, LR-2, LR-3 and LR-4 lesions in cirrhosis have different natural outcomes, LI-RADS lesions demonstrate increasing risk of progression to HCC with increasing category. About two-fifths of LR-4 observations progressed to a malignant category. LR-3 observations with APHE or threshold/subthreshold growth upgraded to LR-5 were significantly higher. Most LR-2 observations that remain stable in category for at least a year.
Introduction
Hepatocellular carcinoma (HCC), the most common primary hepatic malignancy worldwide, is a growing health care issue. Cirrhosis is the predominant risk factor for HCC, with 80% of HCC developing in a back-ground of cirrhosis. MRI plays a vital role in the diagnosis and staging of HCC, as early detection and treatment leads to improved outcomes. The Liver Imaging Reporting and Data System (LI-RADS) has been developed to standardize the terminology for reporting, assessing, and recommending action in liver imaging. The main purpose of LI-RADS is to minimize the likelihood of a false diagnosis of definite HCC. LI-RADS stratifies nodules into five categories according to the perceived risk of HCC. LR-1 (definitely benign) observations include cysts and typical hemangiomas. LR-5 (definitely HCC) observations demonstrate arterial phase hyper-enhancement in conjunction with one or more additional major features (washout appearance, capsule appearance, or threshold growth), taking into account the observation diameter. LR-2 (probably benign), LR-3 (intermediate probability for HCC), or LR-4(probably HCC) observations that are thought to have an intermediate and increasing likelihood of HCC. Although Tanabe and Hong et al previously demonstrated that observations categorized as LR-1, LR-2, LR-3, and LR-4 had different imaging outcomes, however those studies were limited by standardized imaging techniques, unable to assess longitudinal clinical outcomes with the recently released LI-RADS v2018, and few LR-2 observations progressed to LR-5. The purpose of this study was to characterize the MR imaging features and natural outcomes of LR-2, LR-3, and LR-4 nodules, with an emphasis on upgrade to LR-5 or higher by using LI-RADS v2018.Methods
Data from 158 patients(245 lesions)of cirrhosis who underwent at least one follow-up magnetic resonance imaging (MRI) examination in our institution from May 2012 to September 2018, and were index category as LR-2, LR-3 and LR-4 lesions without biopsy or operation,were retrospectively reviewed. Among all the lesions, 105 were LR-2, 97 were LR-3 and 43 were LR-4. Follow-up duration and category modifications that progressed, remained stable, or decreased were recorded for each observation. The single-factor analysis was used to analyze the follow-up interval of LR-2, LR-3 and LR-4 lesions, and cumulative incidence curves for progression were analyzed using Kaplan-Meier method and Log-rank analysis by SPSS 22.0.Results
The mean follow-up interval of LR-2, LR-3 and LR-4 were(20.5±11.4),(18.1±10.5)and(13.8±9.9) months respectively, the difference were statistically significant(P=0.002). Among 105 index LR-2 lesions, 5 upgraded to LR-5, 2 upgraded to LR-4, 4 upgraded to LR-3, 73 remained stable, and 23 decreased to LR-1. Among 97 index LR-3 lesions, 17 upgraded to LR-5, 6 upgraded to LR-4, 57 remained stable and 18 decreased to LR-1/-2. Among 43 index LR-4 lesions, 15 upgraded to LR-5, among them, 5 demonstrated threshold growth, 7 demonstrated subthreshold growth; 2 progressed to LR-TIV with venous invasion, 23 remained stable and 3 decreased to LR-1. The cumulative incidence of progression to LR-5/-TIV was higher for LR-4 lesions than for LR-3 or LR-2 lesions (each P<.001). Among them, the cumulative incidence of upgraded to LR-5 in 3, 6, and 12 months, LR-4 lesions were 4.7%、11.6%、31.2%, LR-3 lesions were 0、4.2%、6.6% respectively, and LR-2 lesions were 0. The cumulative incidence of progression to LR≥4 was higher for LR-3 lesions than for LR-2 lesions (P<.001).Discussion
This study demonstrates that LR-2, LR-3, and LR-4 observations have significantly different longitudinal outcomes by using LI-RADS v2018. LR-2, LR-3, and LR-4 have an increasing likelihood of progression to malignant categories(LR-5 or LR-TIV): in particular, LR-2 observations have a cumulative incidence of progression to LR-5 of 0%, 0%, 0%, and 3.6% at 3 months, 6 months, 1 year, and 2 years, respectively; LR-3 observations have a cumulative incidence of progression to LR-5 of 0%, 4%, 9%, and 23%; and LR-4 observations have a cumulative incidence of progression to LR-5 of 5%, 12%, 31%, and 63%. In ourstudy, LR-2 observations were all homogeneous cirrhotic siderotic nodules(SN) that have no ancillary features(AF) malignancy, 4.8% (5/105) LR-2 SN progressed to LR-5, 6.7% of LR-2 SN upgrade to probable or definite HCC, iron clearance, hyperintense on T2WI and hypervascular transformation elevation on the follow-up MRI indicated the multi-step malignant evolution average within 22.5 months, suggested that LR-2 observations that remain stable in category for at least a year. 17.5% of index LR-3 observations progressed to LR-5 (four within 6months), 3 demonstrated threshold growth, 7 demonstrated subthreshold growth, and 23.7% progressed to either LR-4 or LR-5,LR-3 observations with APHE or threshold/subthreshold growth upgraded to LR-5 were significantly higher. In this study, most LR-4 observations have APHE, washout, and diameter less than 20 mm, approximately one-third of LR-4 observations upgrade to LR-5, 2 progressed to LR-TIV with venous invasion.Conclusion
In summary, using LI-RADS v2018 on MRI, LR-2, LR-3 and LR-4 lesions in cirrhosis have different natural outcomes, 4.8% of LR-2 siderotic nodules, 17.5% of LR-3 and 34.9% LR-4 observations upgrade toLR-5/-TIV. LI-RADS lesions demonstrate increasing risk of progression to HCC with increasing category.Acknowledgements
No acknowledgement found.References
1. Heimbach JK, Kulik LM, Finn RS, et al. AASLD guidelines for the treatment of hepatocellular carcinoma[J]. Hepatology, 2018, 67(1):358-380.
2. American College of Radiology: Liver Imaging Reporting and Data System. https://nrdr.acr.org/lirads/. 2018.
3. Li RK, Zeng MS, Qiang JW, et a1.Improving Detection of Iron Deposition in Cirrhotic Liver Using Susceptibility-Weighted Imaging With Emphasis on Histopathological Correlation [J]. J Comput Assist Tomogr, 2017, 41(1):18-24.
4. Bergmann OM, Mathahs MM, Broadhurst KA, et a1.Altered expression of iron regulatory genes in cirrhotic human livers: clues to the cause of hemosiderosis [J]? Lab Invest, 2008, 88(12):1349-1357.
5. Hong CW, Park CC, Mamidipalli A, et al. Longitudinal evolution of CT and MRI LI-RADS v2014 category 1, 2, 3, and 4 observations[J].Eur Radiol, 2019, 29(9):5073-5081.
6. Tanabe M, Kanki A, Wolfson T, et al. Imaging Outcomes of liver imaging reporting and Data system Version 2014 category 2,3, and 4 Observations Detected at CT and MR imaging[J]. Radiology, 2016, 281(1):129-139.
7. Shah A, Tang A, Santillan C, et al. Cirrhotic liver: What's that nodule? The LI-RADS approach [J]. J Magn Reson Imaging, 2016, 43(2): 281-294.
8. Choi JY, Cho HC, Sun M, et al. Indeterminate observations (liver imaging reporting and data system category 3) on MRI in the cirrhotic liver: fate and clinical implications [J]. AJR Am J Roentgenol, 2013, 201(5): 993-1001.
9. Van der Pol CB, Lim CS, Sirlin CB, et al. Accuracy of the Liver Imaging Reporting and Data System in Computed Tomography and Magnetic Resonance Image Analysis of Hepatocellular Carcinoma or Overall Malignancy-A Systematic Review[J]. Gastroenterology, 2018, 156(4):976-986.
10. Burke LM, Sofue K, Alagiyawanna M, et al. Natural history of liver imaging reporting and data system category 4 nodules in MRI[J]. Abdom Radiol (NY), 2016, 41(9): 1758-1766.
11. Sofue K, Burke LMB, Nilmini V, et al. Liver imaging reporting and data system category 4 observations in MRI: Risk factors predicting upgrade to category 5[J]. J Magn Reson Imaging, 2017, 46(3): 783-792.
Figures
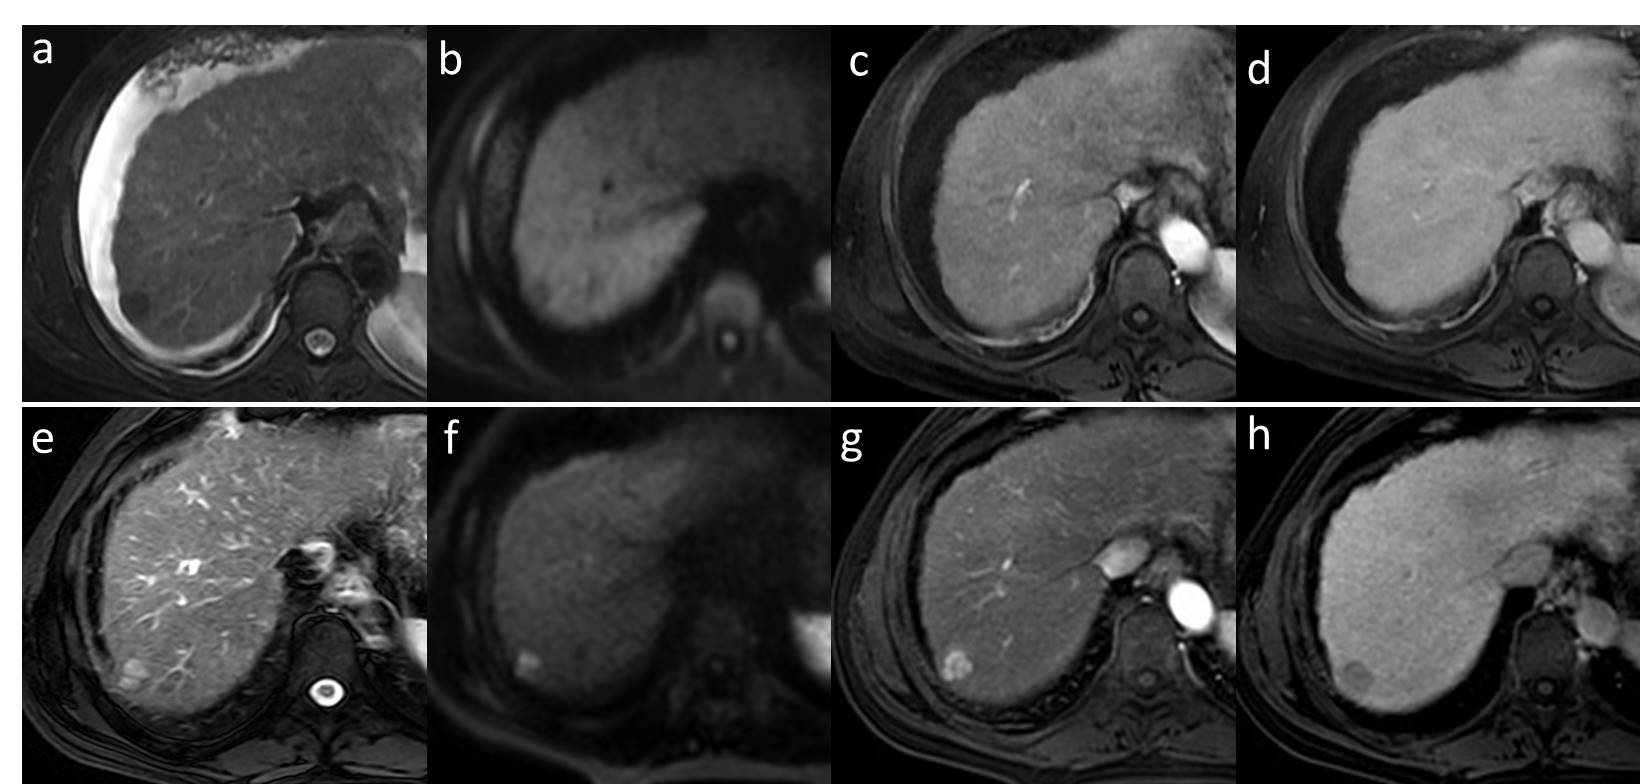
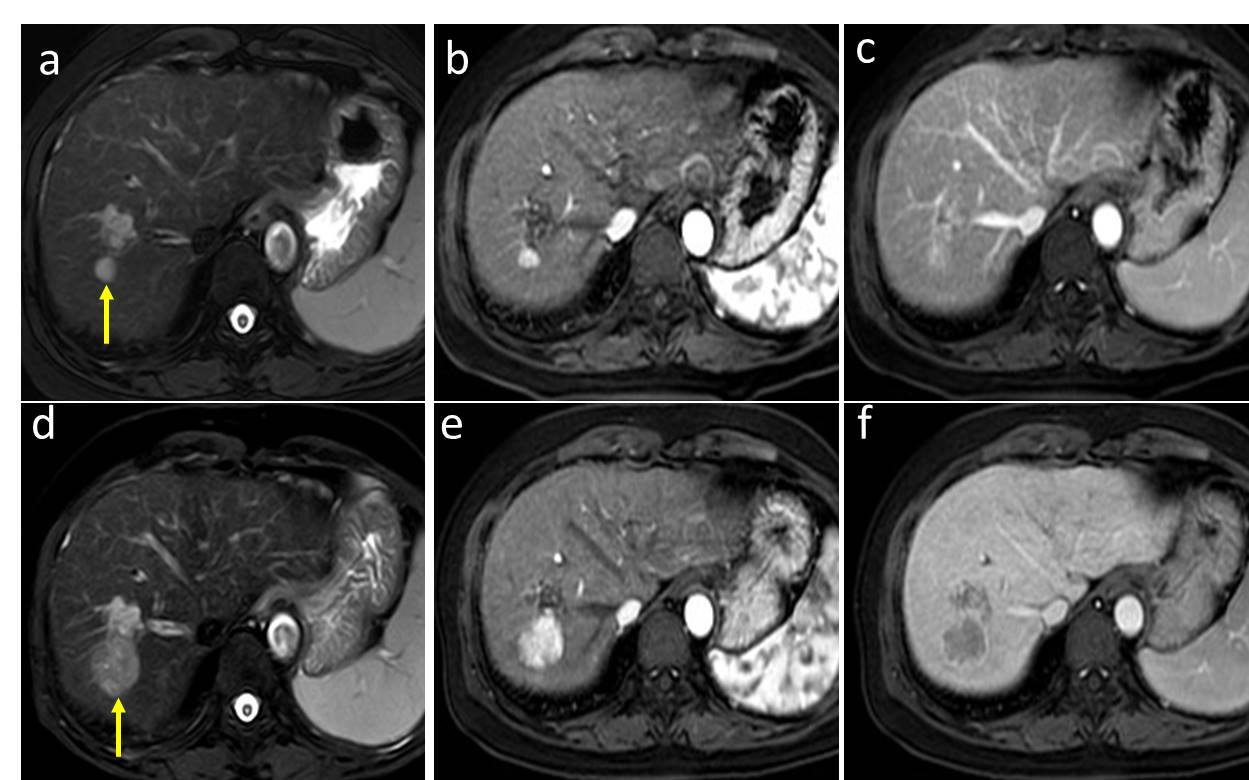
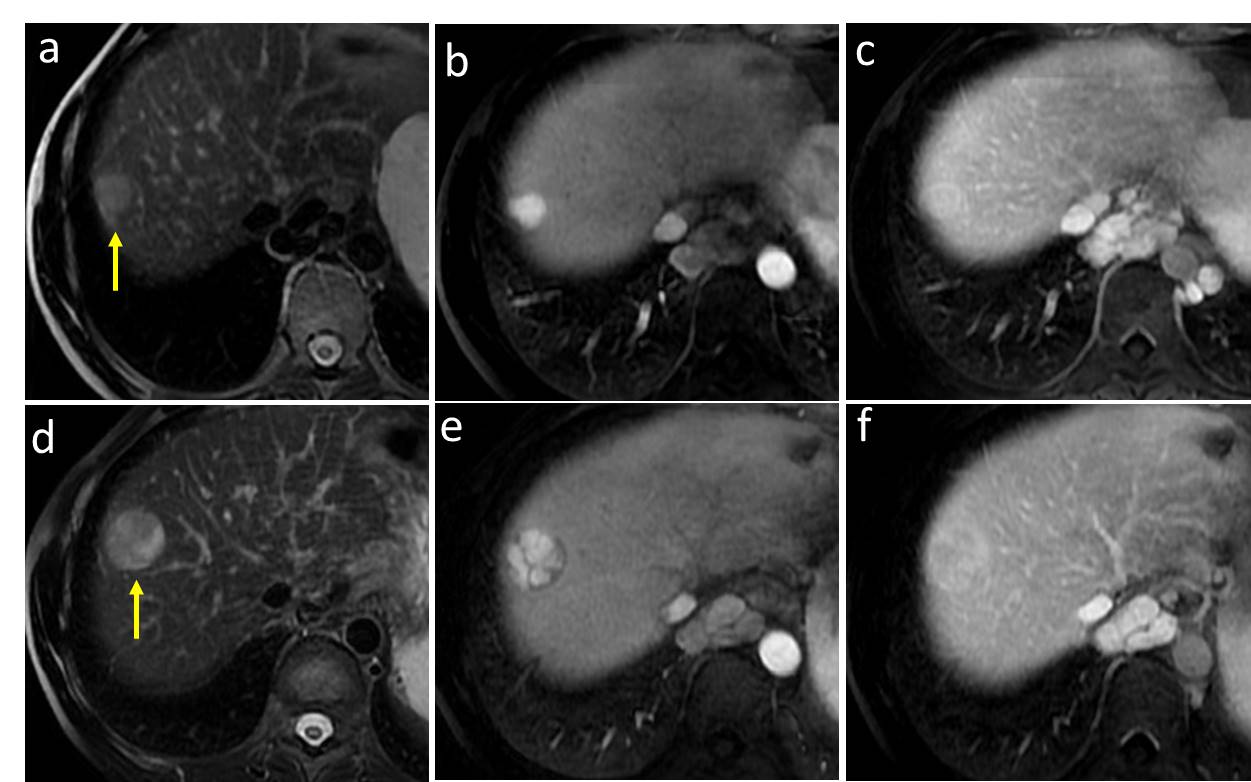

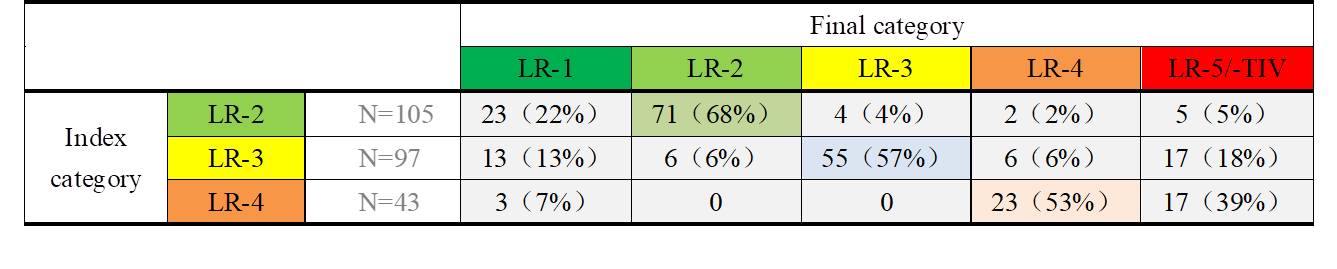
Diagram illustrates the transitions in LI-RADS v2018 categories during follow-up (from baseline to final examination) for index LR-2, LR-3, and LR-4 included in this study