2402
3D ROI Histogram Based on Intravoxel Incoherent Motion for Preoperative Evaluation of Pathological Differentiation of the Hepatocellular Carcinoma1Department of Radiology, the First Affiliated Hospital of Dalian Medical University, Dalian, China, Dalian, China
Synopsis
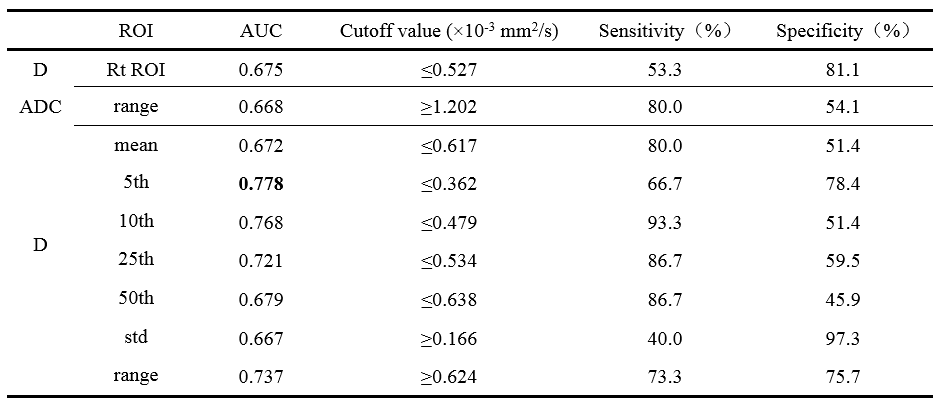
The purpose of this study was to preoperatively evaluate pathological differentiation of the whole hepatocellular carcinoma (HCC) by 3D ROI histogram of ADC, D, D* and f. The results showed that 3D ROI histogram of ADC, D can identify poor differentiated HCC. The D-5th achieved the highest AUC values (AUC: 0.778; sensitivity: 66.7%; specificity: 78.4%). Although there was no significant difference between AUC of 3D ROI histogram and routine ROI, 3D ROI histogram can reflect the heterogeneity to evaluate the differentiation of the whole tumor.
Purpose
To study the apparent diffusion coefficient (ADC), slow apparent diffusion coefficient mono (D), fast apparent diffusion coefficient mono (D*) and perfusion fraction mono (f), and their 3D ROI histogram to preoperatively evaluate the pathological differentiation of hepatocellular carcinoma (HCC).Introduction
Hepatocellular carcinoma (HCC) is a common malignant tumor. Recurrence occurs frequently after surgical resection1, and some scholars2 have shown that poorly differentiated (PD) HCC is more likely to recur after resection than non-poorly differentiated (NPD) HCC. Some surgeons3 believe that the scope of surgical resection should be determined according to the degree of differentiation of HCC to ensure that the margin is large enough. So, it is significant to preoperatively identify the PD HCC to predict prognosis or select treatment option4. Puncture biopsy can judge the differentiation of HCC, but it has some disadvantage-invasive examination, the risk of needle planting metastasis and unable to reflect the differentiation of the whole tumor. As a non-invasive imaging examination and without the risk of needle metastasis, the routine ROI measurement of DWI and IVIM can evaluate the differentiation of the tumor by detecting diffusion of water molecules, but the routine ROI can not reflect the differentiation of the whole tumor. 3D ROI histogram can incorporate the whole tumor into the analysis. So, the 3D ROI histogram of DWI and IVIM could be a good way to detect the differentiation of the whole tumor.Materials and Methods
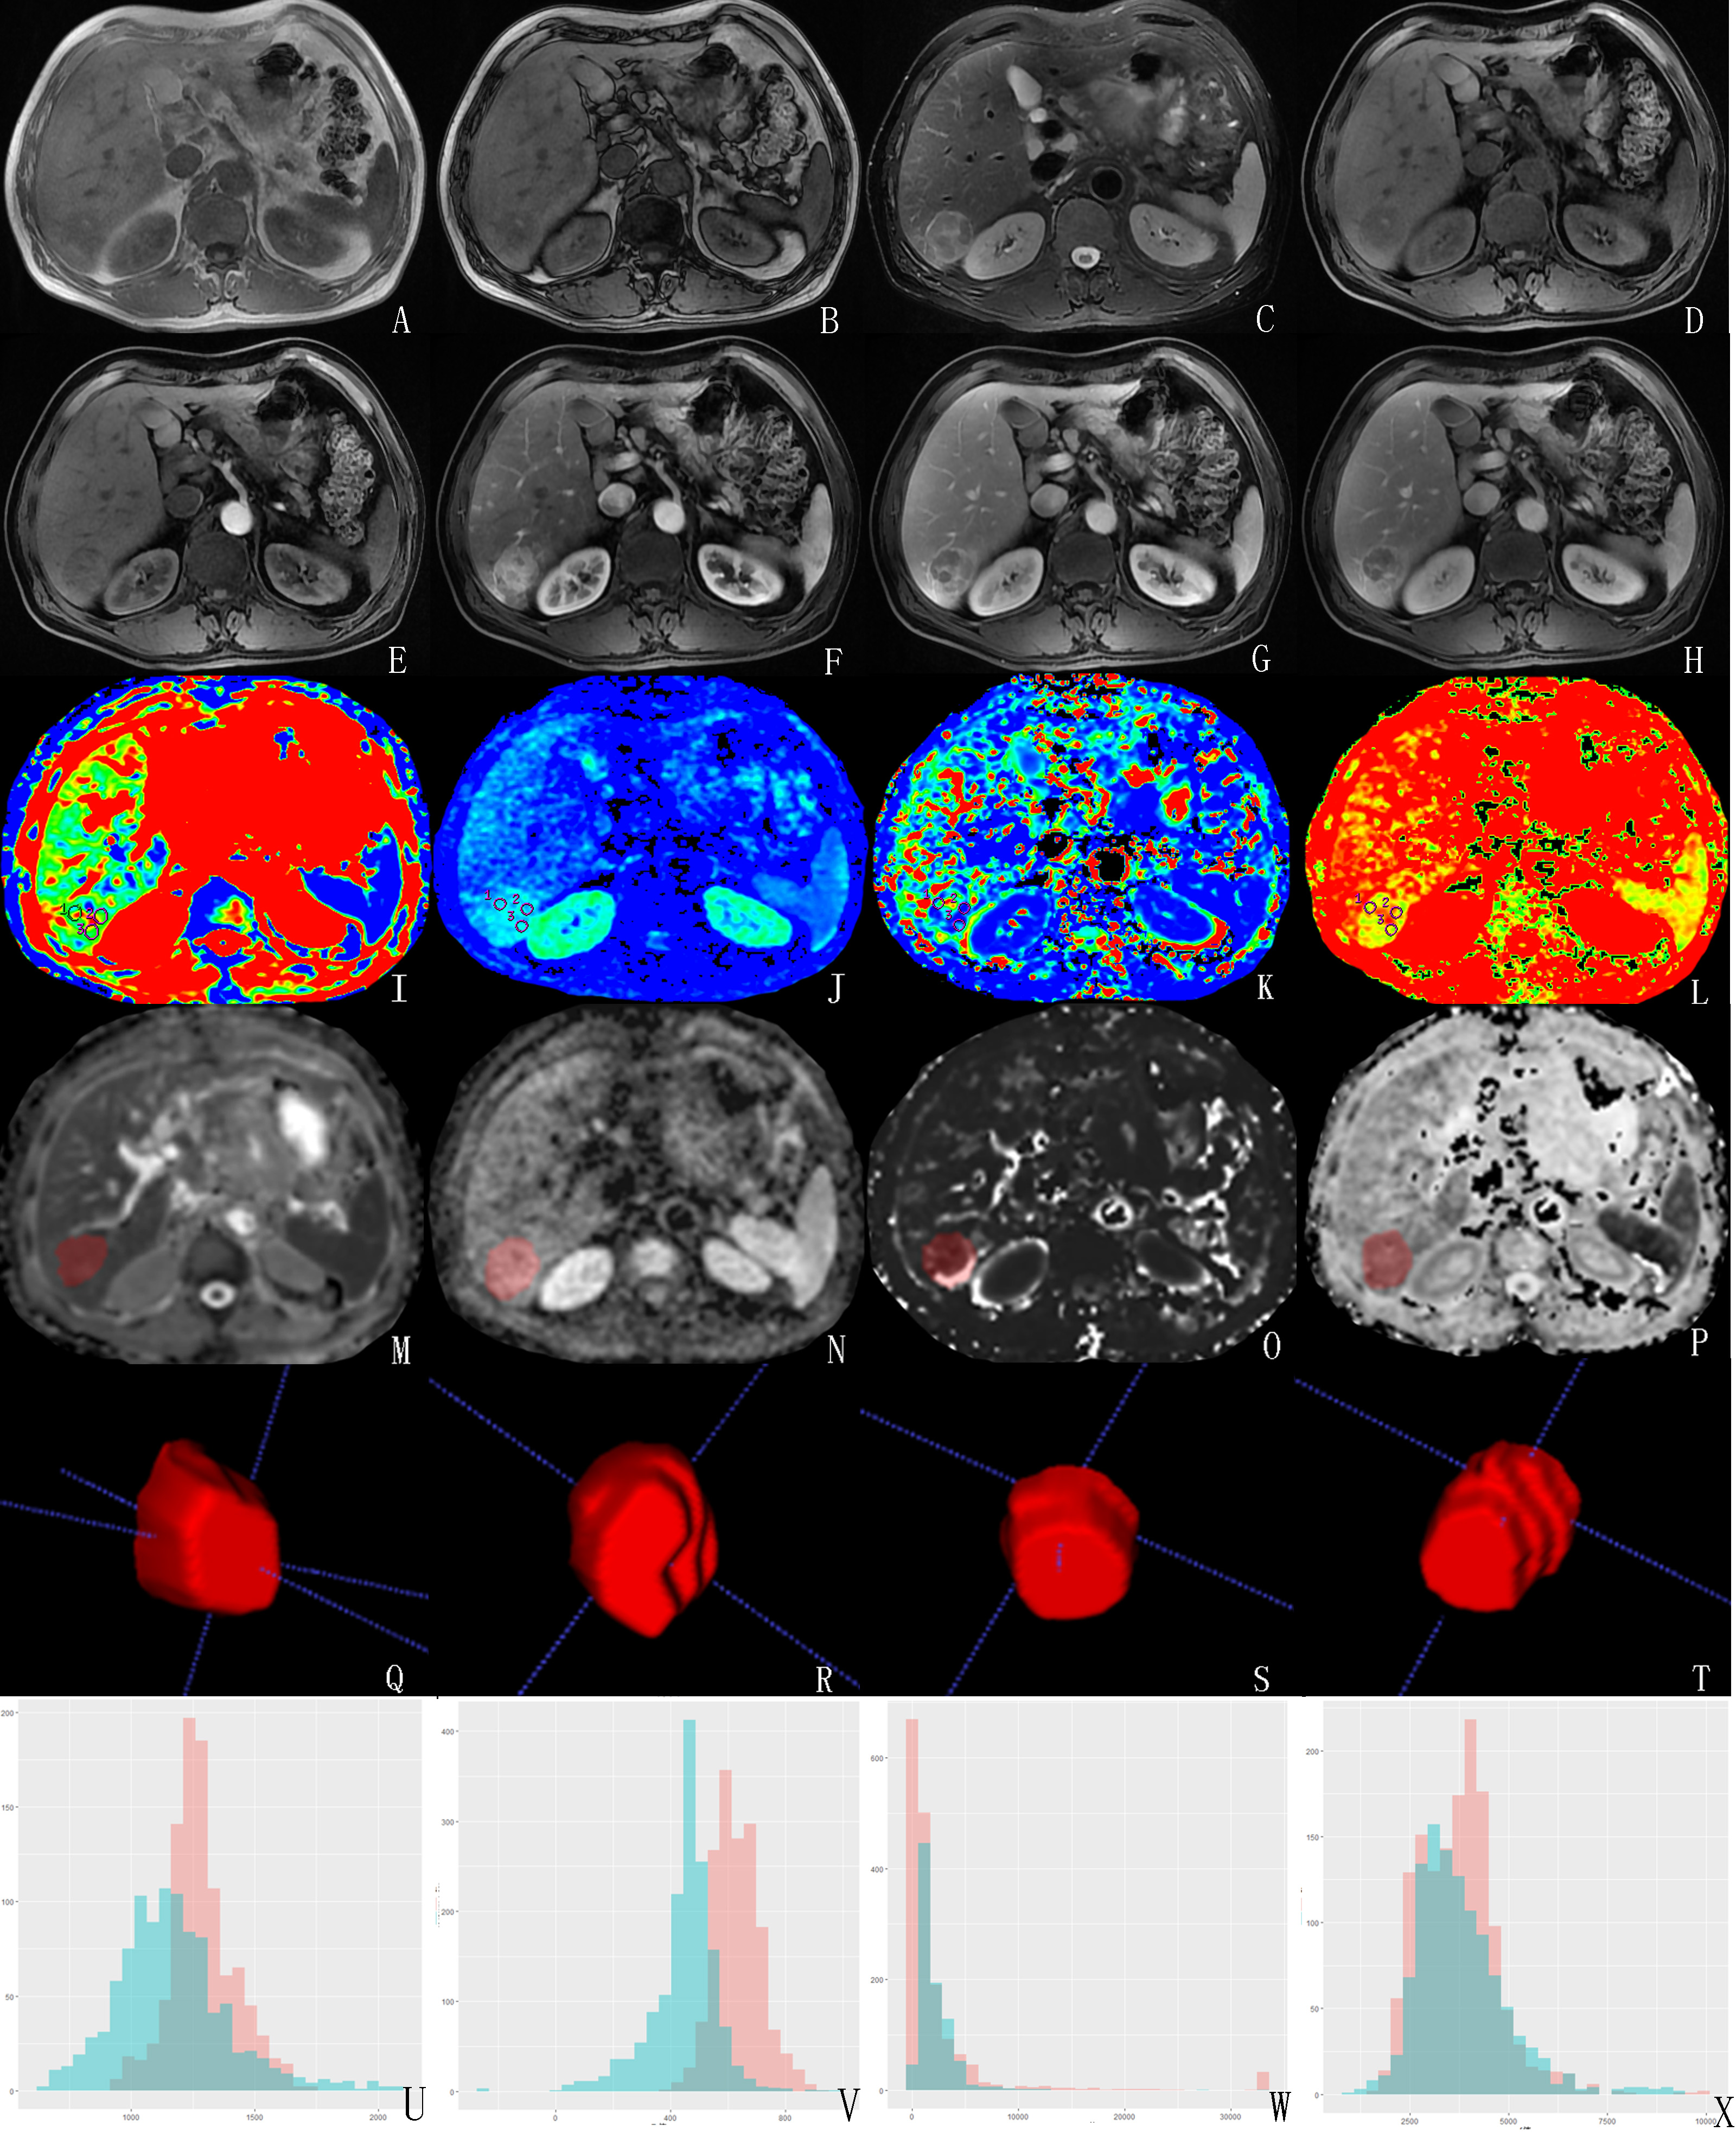
The present study retrospectively enrolled 51 HCC patients (52 HCC lesions) confirmed by pathology, including 15 PD HCC lesions and 37 NPD HCC lesions (9 well differentiated HCC lesions, 13 well-moderately differentiation lesions , 15 moderately differentiated HCC lesions). All patients have underwent preoperative MR examinations, including routine scanning sequences (T1WI, T2WI, and dynamic contrast-enhanced MR imaging) followed by DWI (b=0, 600s/mm2) and IVIM (b=0, 20, 50, 100, 150, 200, 400, 800, 1200, 2000, 3000 s/mm2). ADC, D, D* and f maps were derived by using Functool software on GE AW4.6 workstation, where the routine ROI values of ADC, D, D* and f were measured (Figure 1, I~L). 3D ROI histograms of ADC, D, D* and f were analyzed by Omni-Kinetics (OK) software (GE Healthcare). The region of interests (ROIs) were delineated along the edge of each layer of lesions on ADC, D, D* and f signal intensity maps and merged into 3D ROIs respectively (Figure 1, M~T). 3D ROI histograms were generated automatically by OK software (Figure 1, U~X). The histogram related parameters consist of minimum (min), maximum (max), mean (mean), standard deviation (std), variance (var), range, skewness, kurtosis, quantile (5th, 10th, 25th, 50th, 75th, 90th, 95th). Data analyses were performed by using SPSS 25.0 and Medcalc software. If parameters meet the normal distribution, the parameters were recorded as “x±d”, and the differences of 3D ROI histograms or routine ROI value were compared between the PD and NPD HCC by independent sample t tests. If not,the parameters were recorded as “Median(25%, 75%)”, and the differences were compared by Mann-Whitney U test. The ROC curves were made, and then they were followed by the diagnostic performance analysis and comparison.Results
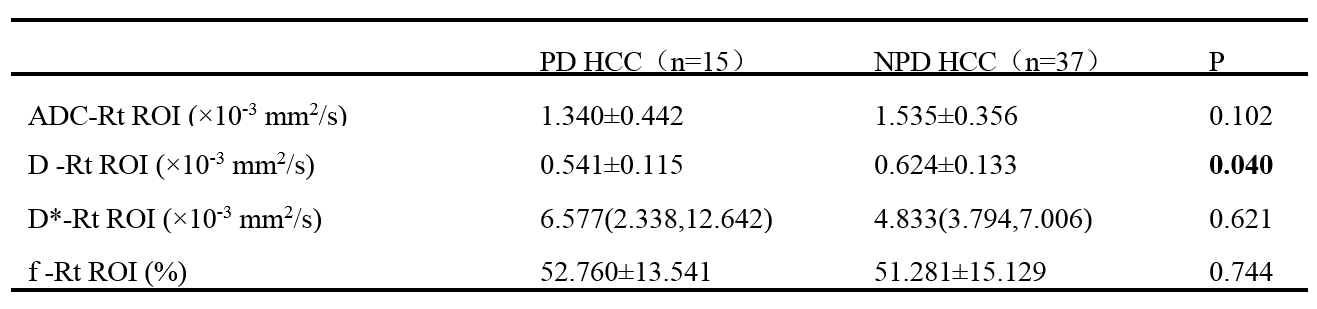
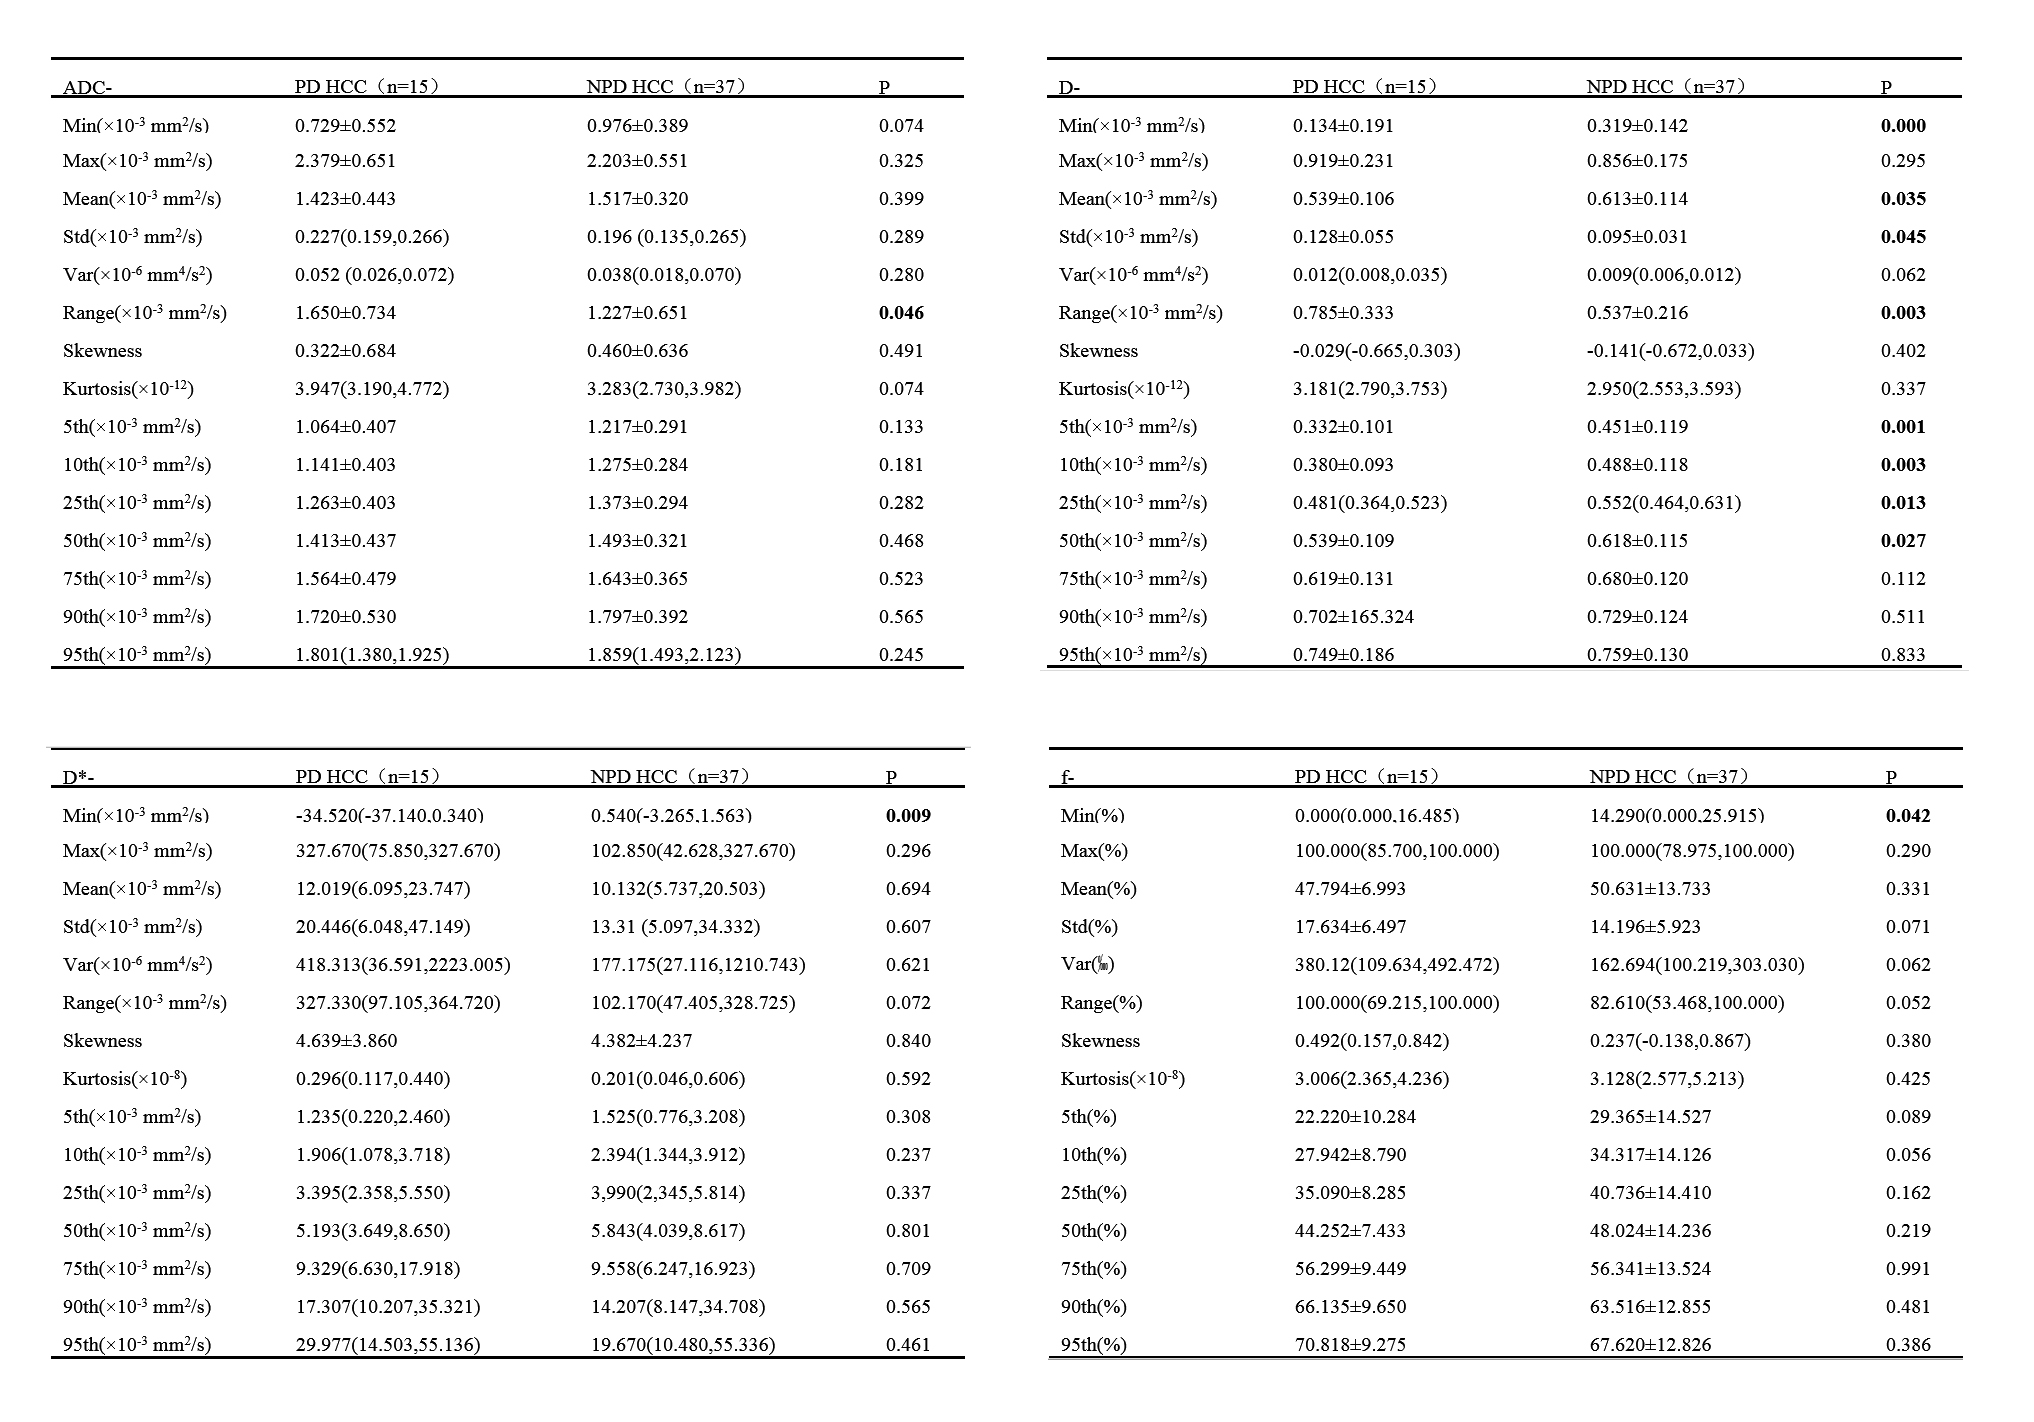
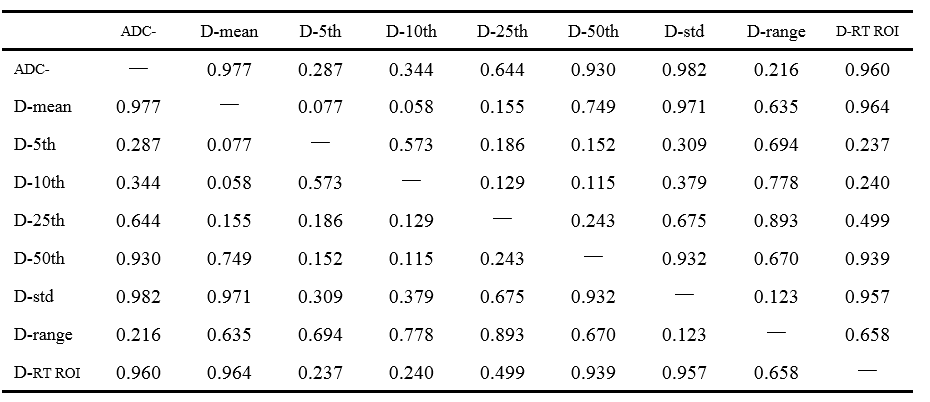
There was a significant difference in routine ROI (Rt ROI) values of D between the PD HCC and NPD HCC (P<0.05, Table 1). There was a significant difference in ADC-range, D-mean/std/range/min/5th/10th/25th/50th, D-min, D*-min and f-min between the PD HCC and NPD HCC. (P<0.05, Table 2). The remaining parameters were not statistically different (P>0.05). The min value of the histogram was negative in the patient's raw data due to the influence of image noise, which is not logical, so the diagnostic performance of the min value of 3D histogram was not analyzed. Results indicated that D-5th (AUC: 0.778, sensitivity: 66.7%, specificity: 78.4%) is the optimal strategy to distinguish PD HCC from NPD HCC (Table 3), but there was no significant difference between AUC of 3D ROI histogram and routine ROI (Table 4).Discussion
First, Mean and quantile of 3D ROI histogram and routine ROI reflect signal intensity on the map to revel the restricted degree of diffusion motion of water molecule. The nuclear mass ratio and the cell density are higher in PD HCC than that in NPD HCC, which results in a more restricted diffusion of water molecules in PD HCC, which in turn decreases the values of mean and quantile of 3D ROI histogram and routine ROI. Second, range and std of 3D ROI histogram reflect the heterogeneity of signal intensity of pixels on the map. The heterogeneity of NPD HCC cells is greater than that of non-PD HCC cells, which leads to a greater difference in the restricted degree of diffusion of water molecules, which leads to the range of ADC and D and std of D are greater in PD HCC than that in NPD HCC. To our best knowledge, this is the first study of IVIM based on histogram to identify the degree of differentiation of HCC.Conclusion
3D ROI histograms of ADC and D as well as the routine ROI of D are helpful for the preoperatively Identify differentiation of HCC. 3D ROI histogram provides more diagnostic parameters than routine ROI to reflects tumor heterogeneity.Acknowledgements
No acknowledgement found.References
1. Park J H, Koh K C, Choi M S, Lee J H, Yoo B C, Paik S W, Rhee J C, Joh J W. Analysis of risk factors associated with early multinodular recurrences after hepatic resection for hepatocellular carcinoma. American journal of surgery,2006,192 (1):29-33.
2. Zhou L, Rui J-A, Ye D-X, Wang S-B, Chen S-G, Qu Q. Edmondson-Steiner Grading Increases the Predictive Efficiency of TNM Staging for Long-term Survival of Patients with Hepatocellular Carcinoma After Curative Resection. World Journal of Surgery,2008,32 (8):1748.
3. Chen J, Wu M, Liu R, Li S, Gao R, Song B. Preoperative evaluation of the histological grade of hepatocellular carcinoma with diffusion-weighted imaging: a meta-analysis. Plos One,2015,10 (2):e0117661.
4. An C, Park M S, Jeon H M, Kim Y E, Chung W S, Yong E C, Kim M J, Kim K W. Prediction of the histopathological grade of hepatocellular carcinoma using qualitative diffusion-weighted, dynamic, and hepatobiliary phase MRI. European Radiology,2012,22 (8):1701-1708.
Figures