2401
Visualize the micro-hemorrhage of HCC through SWI and intravoxel incoherent motions to predict the microvascular invasion1Sun Yat-sen University Cancer Center, Guangzhou, China, 2United Imaging Healthcare, Shanghai, China
Synopsis
Tightly correlated with the prognosis, microvascular invasion (MVI) serves as one significant predictor determining the clinical management. Abnormal angiogenesis, one typical character during carcinogenesis, can lead to the abnormal micro-vessel manifestations including micro-hemorrhage and more, which may correlate with another abnormal vascular manifestations—MVI. Hence, this research aims to predict the MVI via visualizing the intra-tumor hemorrhage with susceptibility weighted imaging (SWI) widely proven to be powerful for imaging hemorrhage and IVIM hypothesized to be effective for visualizing the hemorrhage via quantifying the abnormal perfusion. The results displayed that visualizing the micro-hemorrhage holds great potential for predicting MVI of HCC.
Introduction
Being tightly correlated with the prognosis of hepatocellular carcinoma (HCC) such as recurrence and poor response to therapy as well as playing a significant role for the subsequent clinical management, MVI has attracted the attention of innumerable researchers.1-3 As another abnormal vascular manifestations, angiogenesis, serving as one representative character during carcinogenesis, is the main cause of many abnormal micro-vessel changes containing intra-tumoral hemorrhage, hyper-vascularity and so on.4 Therefore, we hypothesized that visualizing the intra-tumoral hemorrhage may be enlightening for predicting the MVI as they are all sourced from the abnormal micro-vessel, which may overcome the disadvantages of the histopathological examination, current gold standard, such as the sampling bias, invasiveness and so on. With the ability of quantifying the perfusion, we speculated that D* (pseudo diffusion coefficient) and f (perfusion fraction) obtained from IVIM parametric maps may be helpful for sensitively visualizing the micro-vessel hemorrhage related to the abnormal perfusion in the molecular dimension.5 Differently, due to the fact that SWI applies the phase information to enhance the contrast of susceptibility change with “intrinsic contrast agents”, some paramagnetic substances, such as deoxygenated hemoglobin and so on, SWI (Susceptibility Weighted Imaging) is able to offer the macroscopical visibleness of abnormal micro-vessel manifestations including micro-hemorrhage and so on.6,7 Since IVIM and SWI can respectively reflect the micro-vessel changes in the microscopic dimension with high sensitivity and in the macroscopic dimension with high specificity, respectively, this research aims to predict the MVI via visualizing the intra-tumor hemorrhage with the assistance of SWI and IVIM. As far as we are aware, neither have the SWI and IVIM been combined for clinical application, nor have the visualization of micro-vessel hemorrhage been applied for predicting the MVI of HCC.Methods
The number of patients recruited into this research was 28, in total. One 3T MR scanner (uMR 780, United Imaging Healthcare Co Ltd) was utilized for completing all MR examinations. The main MR sequences in this research included T2WI sequence, SWI sequence and IVIM sequence. Detailed parameters of SWI sequence were as the followings: TR/TE/FA: 120 ms/10 ms/30°, Rows*Columns: 303*384 and slice thickness: 5 mm. Detailed parameters of IVIM sequence were as the followings: TR/TE/FA: 4294 ms/ 67.1 ms/90°, Rows*Columns: 256*202, slice thickness: 5 mm and b values: 0, 10, 20, 30, 40, 60, 80, 100, 200, 400, 600, 800 s/mm2. The parametric maps of IVIM were calculated according to the most-widely used fitting model. One experienced radiologist with more than 8 years’ experience was asked to define the ROI in IVIM parametric maps and SWI images. The histogram metrics of the whole tumor lesion were extracted for subsequent statistics. Patients were classified into MVI positive termed as MVI(+) and MVI negative termed as MVI(-) according to whether there existed MVI in the tumor according to the histopathological results. Besides, micro-hemorrhage in the tumor was also assessed according to the histopathological examination. Mann-Whitney U test was performed to see whether there existed significant difference (p < 0.05) between MVI(-) and MVI(+) HCC patients for each histogram metrics extracted from IVIM and SWI images. ROC analysis was performed to evaluate the diagnostic performance.Results
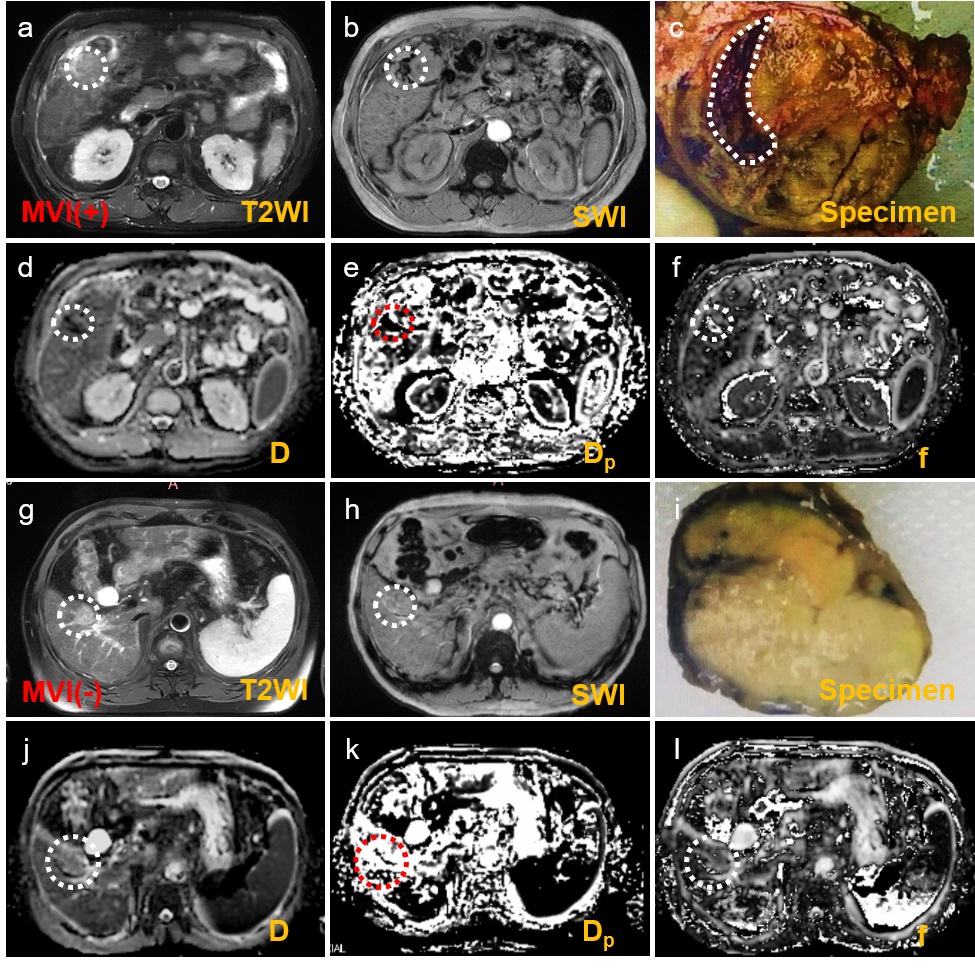
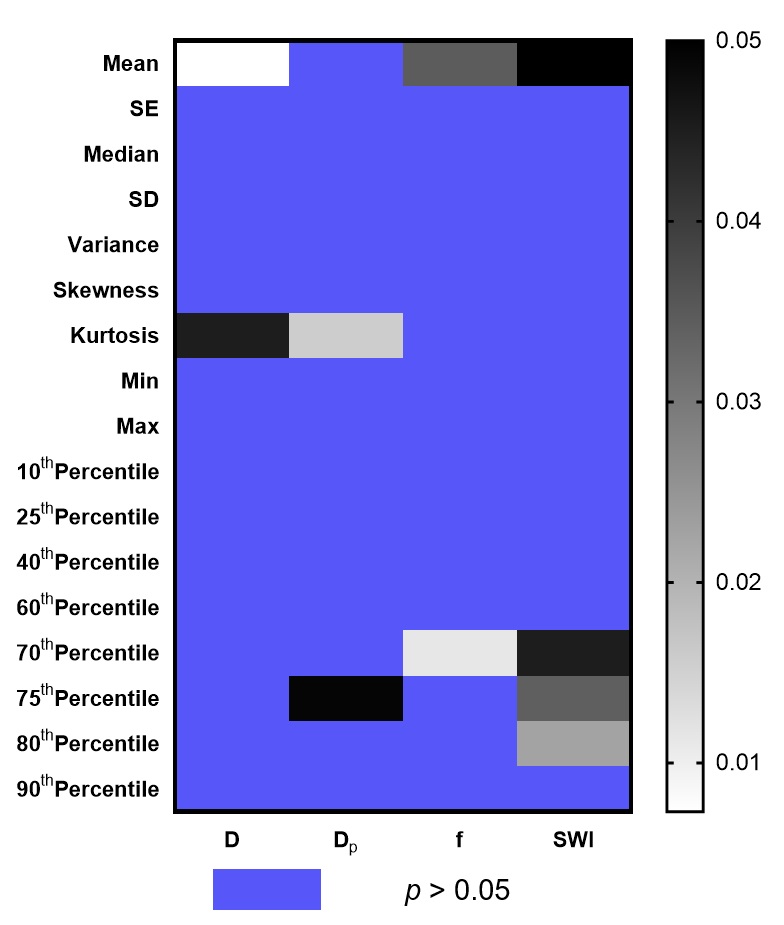
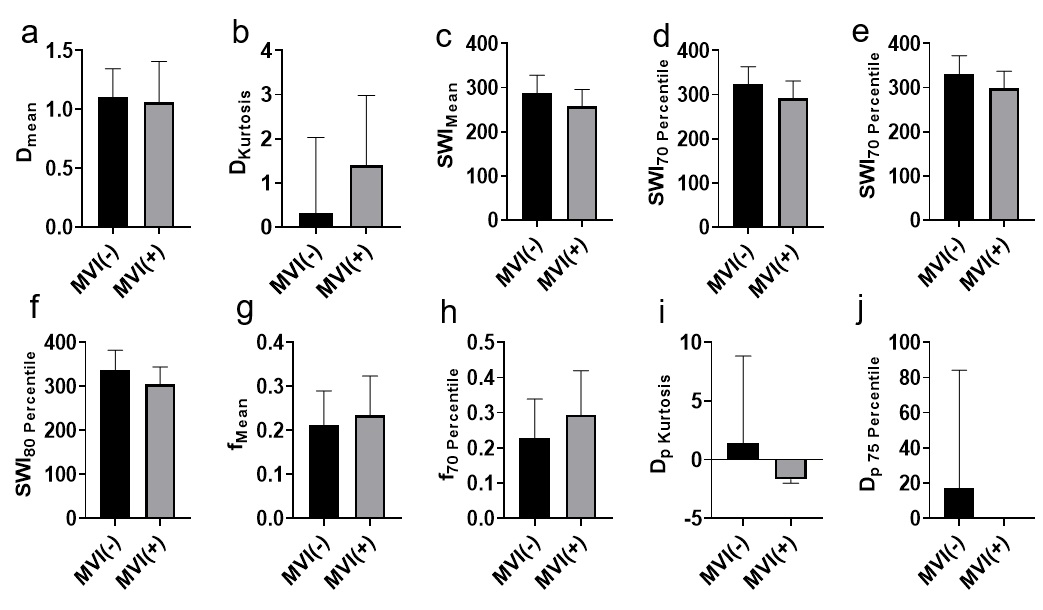
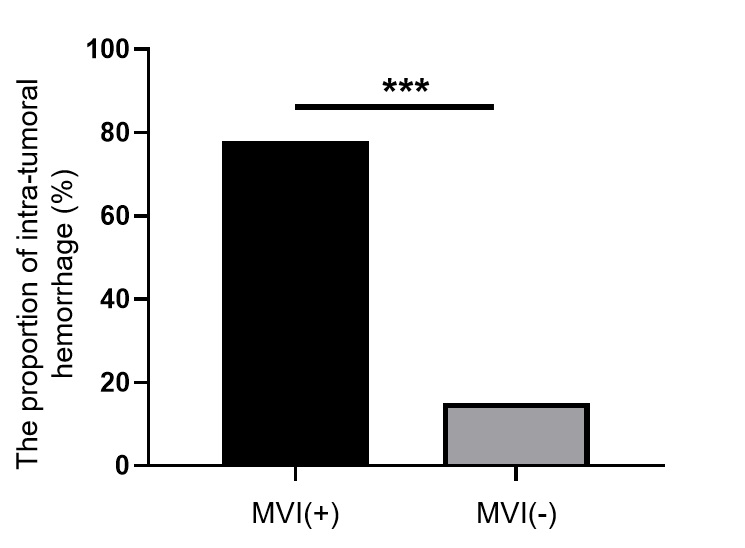
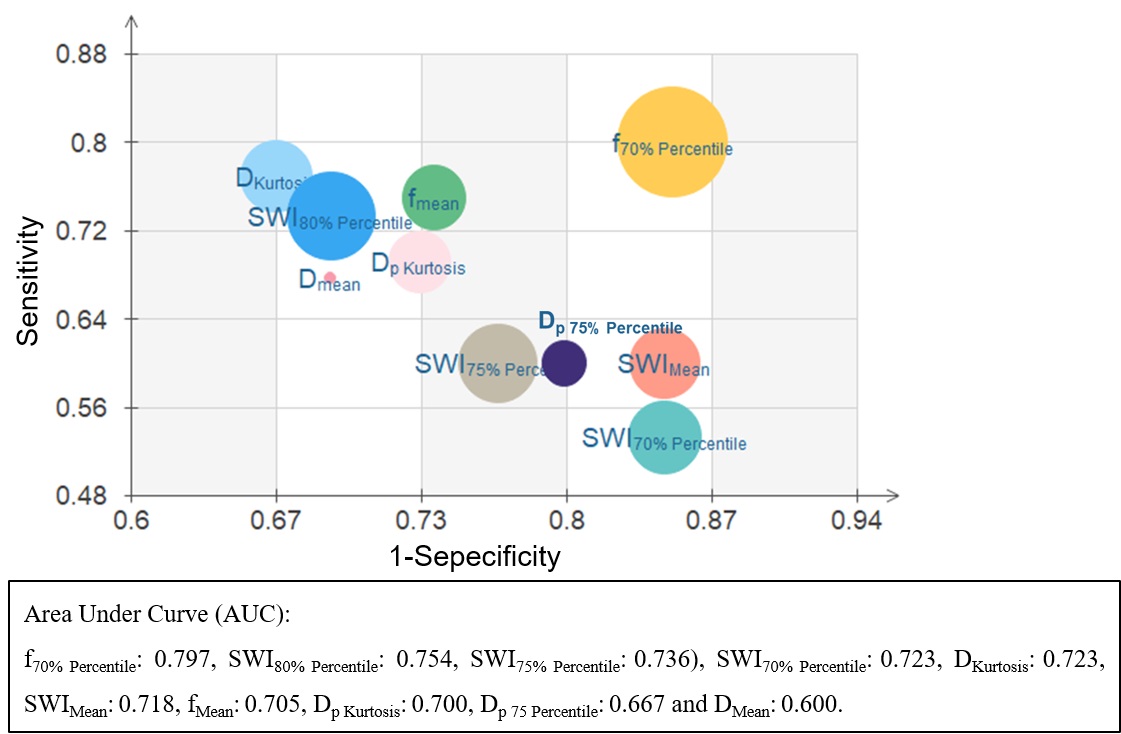
Representative IVIM parametric images and SWI images were displayed in Figure 1 together with the images of tumor specimens. Interestingly, the areas of micro-hemorrhage in tumor specimens well matched the corresponding areas of SWI and IVIM parametric images in MVI(+) HCC patient with abnormal image manifestations. Heat map in Figure 2 showed that Dmean, Dkurtosis, SWIMean, SWI70% Percentile, SWI75% Percentile, SWI80% Percentile, fmean, f70% Percentile, Dp Kurtosis and Dp 75% Percentile in MVI(-) group were significantly different from those of MVI(+) group (p < 0.05). Detailed values and comparisons were exhibited in Figure 3. Interestingly, the proportion of patients pathologically diagnosed having micro-hemorrhage in MVI (-) group was significantly lower than that of MVI(+) group (15% vs 78%, p < 0.05). The diagnostic performance of each index having significant difference between MVI(-) and MVI(+) patients for discriminating MVI(+) patients from MVI(-) patients from good to bad were f70% Percentile (AUC = 0.797), SWI80% Percentile (AUC = 0.754), SWI75% Percentile (AUC = 0.736), SWI70% Percentile (AUC = 0.723), DKurtosis (AUC = 0.723), SWIMean(AUC = 0.718), fMean (AUC = 0.705), Dp Kurtosis (AUC = 0.700), Dp 75 Percentile (AUC = 0.667) and DMean (AUC = 0.600).Discussion
For MVI(+) patients, the probability of suffering micro-hemorrhage was much higher than that of MVI(-) group, which indicates that micro-hemorrhage may serve as a predictive marker for diagnosing MVI. Besides, the result of that f70% Percentile and SWI80% Percentile have the best diagnostic performance may be explained by the following points: 1) The abnormal micro-vessel manifestations including MVI and micro-hemorrhage were tightly correlated to each other. 2) f value is able to sensitively reflect the abnormal tissue perfusion.8 3) With the help of endogenous “contrast agents” such as deoxygenated hemoglobins, SWI can sensitively visualize the micro-hemorrhage area with specific hypo-intensity.9Conclusion
Visualizing the micro-hemorrhage of HCC via the combination of SWI and IVIM holds great potential for accurately predicting the MVI.Acknowledgements
No acknowledgements.References
1. You Z, Chen LP, Ye H. Predictors of microvascular invasion in patients with solitary small hepatitis B related hepatocellular carcinoma. Pakistan journal of medical sciences 2014;30(2):331-334.
2. Cortese S, Morales J, Martin L, et al. Hepatic resection with thrombectomy in the treatment of hepatocellular carcinoma associated with macrovascular invasion. Cirugia espanola 2019.
3. Server S, Sabet S, Yaghouti K, Namal E, Inan N, Tokat Y. Value of Imaging Findings in the Prediction of Microvascular Invasion in Hepatocellular Carcinoma. Transplant Proc 2019;51(7):2403-2407.
4. Carmeliet P, Jain RK. Angiogenesis in cancer and other diseases. Nature 2000;407(6801):249-257.
5. Le Bihan D. What can we see with IVIM MRI? Neuroimage 2019;187:56-67.
6. Li RK, Palmer SL, Zeng MS, et al. Detection of Endogenous Iron Reduction during Hepatocarcinogenesis at Susceptibility-Weighted MR Imaging: Value for Characterization of Hepatocellular Carcinoma and Dysplastic Nodule in Cirrhotic Liver. PLoS One 2015;10(11):e0142882.
7. Yang SH, Lin J, Lu F, et al. Contrast-enhanced susceptibility weighted imaging with ultrasmall superparamagnetic iron oxide improves the detection of tumor vascularity in a hepatocellular carcinoma nude mouse model. JMRI 2016;44(2):288-295.
8. Jakab A, Tuura RL, Kottke R, et al. Microvascular perfusion of the placenta, developing fetal liver, and lungs assessed with intravoxel incoherent motion imaging. JMRI 2018;48(1):214-225.
9. Li RK, Zeng MS, Rao SX, et al. Using a 2D multibreath-hold susceptibility-weighted imaging to visualize intratumoral hemorrhage of hepatocellular carcinoma at 3T MRI: correlation with pathology. JMRI 2012;36(4):900-906.
Figures