2400
Post processing decisions, independent of institution and fit, influence the perceived diagnostic utility of prostate cancer diffusion maps1Biophysics, Medical College of Wisconsin, Milwaukee, WI, United States, 2Radiology, Medical College of Wisconsin, Milwaukee, WI, United States, 3Pathology, Medical College of Wisconsin, Milwaukee, WI, United States, 4Biostatistics, Medical College of Wisconsin, Milwaukee, WI, United States, 5Urological Surgery, Medical College of Wisconsin, Milwaukee, WI, United States, 6Radiology, University of Michigan, Ann Arbor, MI, United States, 7Radiation Oncology, University of Michigan, Ann Arbor, MI, United States, 8Biomedical Engineering, University of Michigan, Ann Arbor, MI, United States, 9Radiology, Brigham and Womens Hospital, Boston, MA, United States, 10Neuroimaging Research, Barrow Neurological Institute, Phoenix, AZ, United States, 11Translational and Molecular Imaging Institute, Icahn School of Medicine at Mount Sinai, New York, NY, United States, 12Medical Physics, Memorial Sloan Kettering Cancer Center, New York, NY, United States, 13Radiology, Memorial Sloan Kettering Cancer Center, New York, NY, United States, 14Institute for Computer Engineering and Sciences, University of Texas, Austin, TX, United States, 15Radiology, University of Texas Southwestern Medical Center, Dallas, TX, United States, 16Radiology and Neurology, University of Washington, Seattle, WA, United States, 17Radiology, Johns Hopkins University, Baltimore, MD, United States, 18Radiology, Medical College of Wisconsin, wauwatosa, WI, United States
Synopsis
Diffusion data from 33 prospectively recruited patients was distributed to 14 sites, who returned monoexponential, biexponential, and diffusion kurtosis fits of the data. Receiver operator characteristic curve AUC was evaluated while varying the positive condition in the ROC analysis, minimum lesion size included, and method of extracting values from the ROI. Cluster size and stratification technique have a significant impact on the AUC and should be explicitly stated in future rad-path studies.
Purpose
The purpose of this study was to quantify the variability in perceived diagnostic utility of prostate cancer diffusion maps caused by common post-processing decisions in radiology-pathology correlation studies.Methods
Data from 33 patients was included in this IRB approved study. Patients underwent MP-MRI prior to prostatectomy on a 3T MRI scanner (General Electric, Waukesha, WI) using an endorectal coil. MP-MRI included field-of-view (FOV) optimized and constrained undistorted single shot (FOCUS) diffusion weighted imaging (DWI) with ten b-values (b=0, 10, 25, 50, 80, 100, 200, 500, 1000, and 2000) and T2-weighted imaging. Robotic prostatectomy was performed, and prostate samples were sectioned using patient-specific custom 3D printed slicing jigs to match the slice orientation to the T2 weighted image. (1)DICOM datasets of the FOCUS DWI were de-identified and distributed to collaborating sites for analysis. Each site was asked to calculate diffusion parameters using locally developed or deployed software, implemented to fit the b-values with common models. (2) This included a mono-exponential (ME) fit (parameter: MEADC), diffusion kurtosis (parameters: kurtosis (K), and diffusion (DK)), and a bi-exponential fit (parameters: diffusion (BID), pseudo-diffusion (BIDS) and perfusion fraction (BIPF)). Each site submitted the calculated maps back to the primary institution for comparative analysis. Once submitted, site results were pre-processed by the coordinating site to ensure each map was in a common space and scaled properly to the same units, as outlined in detail below. Each map was then re-sliced and resampled into the T2 space for comparison to the pathologist annotated ROIs.
Median values were extracted from each pathologist region of interest larger than 200 voxels in plane. Each ROI was classified as benign, low grade (Gleason pattern 3), or high grade (Gleason patterns 4 and 5, including cribriform glands) based on the pathologist’s annotation. Receiver operator characteristic curves were calculated to quantify how well each fit separated regions of interest under three conditions: cancer (G3+) vs benign, high grade vs all (G3-), and high-grade vs low-grade. The area under the curve (AUC) was measured for each ROC and plotted by fit type for each condition. (3,4)
Several methods of extracting values from regions of interest have been reported in the literature. For each fit, the mean, median, and 10th percentile value were extracted from the pathologist drawn ROIs. Receiver operator characteristic curves were generated to quantify how well the fit differentiated high grade regions from all other ROIs under each condition and the AUC was plotted by fit for each condition.
Median values were extracted from each pathologist region of interest. A cluster limit was varied between 100 and 500 voxels in plane, regions of interest smaller than the cluster limit were excluded from the analysis. Successive receiver operator characteristic curves were calculated under each condition, and the area under the curve was plotted by fit for each condition.
Results
Table 1 shows the mean AUC values from the stratification experiment; the AUC values are shown in scatter plot form in Figure 2. Table 2 and Figure 3 show the results from the cluster size analysis. Table 3 and Figure 4 show the results from the ROI analysis. Method of extracting a region of interest: mean, median, or 10th percentile value, had little measurable effect on the measured AUC. Additionally, there was little difference between high grade vs all and cancer vs not cancer when defining the positive case for the receiver operator characteristic analysis. Eliminating non-cancerous ROIs and including only high-grade vs low-grade caused the AUC to drop by approximately 10%. Varying the minimum lesion size for inclusion in the study had a large positive effect on AUC, increasing the output values by 10% or more independent of which fit is tested. Monoexponential and diffusion kurtosis fits consistently outperform biexponential fits and cluster more tightly around the group mean, indicating higher reliability between sites.Discussion and Conclusion
This study aimed to quantify the variability caused by common post processing techniques in radiology-pathology correlation studies on the cancer differentiation ability. Cluster size and stratification point both had a significant impact on the measured performance of the fits independent of fit type or institution of origin. Often in the field of imaging biomarkers the perceived diagnostic utility of an image is based on the reported AUC. This study demonstrates the potential need for standardizing these parameters. Potential sources of error include imperfect alignment of whole mount tissue to the imaging and the relatively low resolution of the diffusion imaging. The acquisition parameters of the distributed DICOMs may be different than the parameters each site has optimized their fits for, causing additional noise and variability.Acknowledgements
Advancing a Healthier Wisconsin, the State of Wisconsin Tax Check off Program for Prostate Cancer Research, National Center for Advancing Translational Sciences, NIH UL1TR001436, TL1TR001437, R01CA218144, U01CA176110, R21CA231892, U01CA166104, R01CA190299, P01CA085878, U24CA180918, R01CA160902, U01CA151261, R01CA158079, U01CA172320, U01CA211205, P30CA008748, U01CA142565, U01CA207091, U01CA154602, R50CA211270, 5P30CA006973 (Imaging Response Assessment Team-IRAT), U01CA140204, U01CA183848 U01CA176110 and R01 CA221938.References
1. McGarry SD, Hurrell SL, Iczkowski KA, Hall W, Kaczmarowski AL, Banerjee A, Keuter T, Jacobsohn K, Bukowy JD, Nevalainen MT, Hohenwalter MD, See WA, LaViolette PS. Radio-pathomic Maps of Epithelium and Lumen Density Predict the Location of High-Grade Prostate Cancer. Int J Radiat Oncol Biol Phys. 2018;101(5):1179-87.
2. Maurer MH, Heverhagen JT. Diffusion weighted imaging of the prostate-principles, application, and advances. Transl Androl Urol. 2017;6(3):490-8.
3. Halligan S, Altman DG, Mallett S. Disadvantages of using the area under the receiver operating characteristic curve to assess imaging tests: a discussion and proposal for an alternative approach. Eur Radiol. 2015;25(4):932-9.
4. Dwyer AJ. In pursuit of a piece of the ROC. Radiology. 1996;201(3):621-5.
Figures
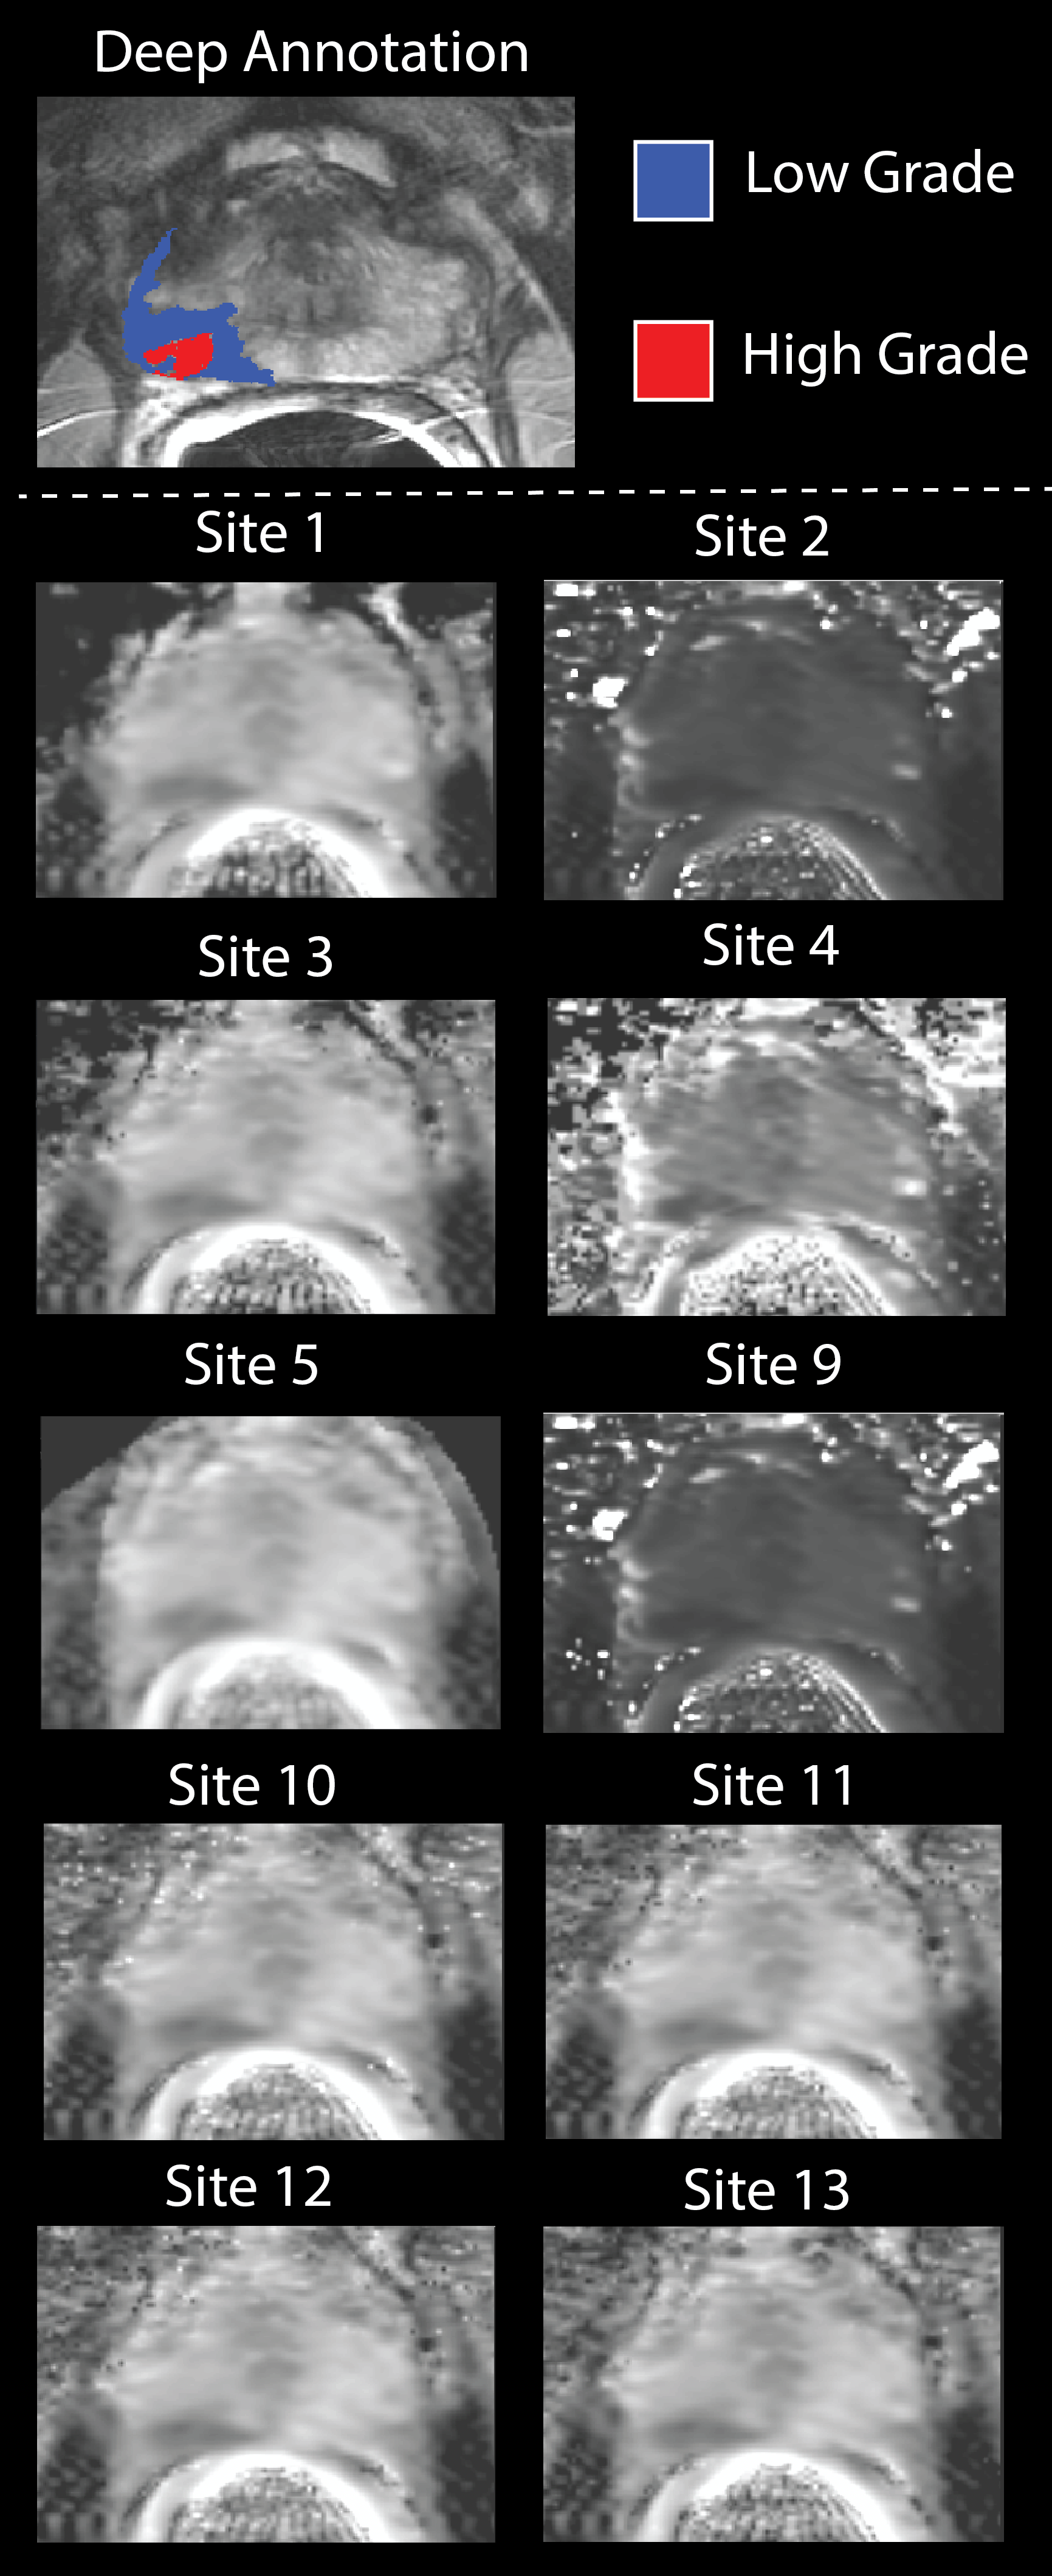
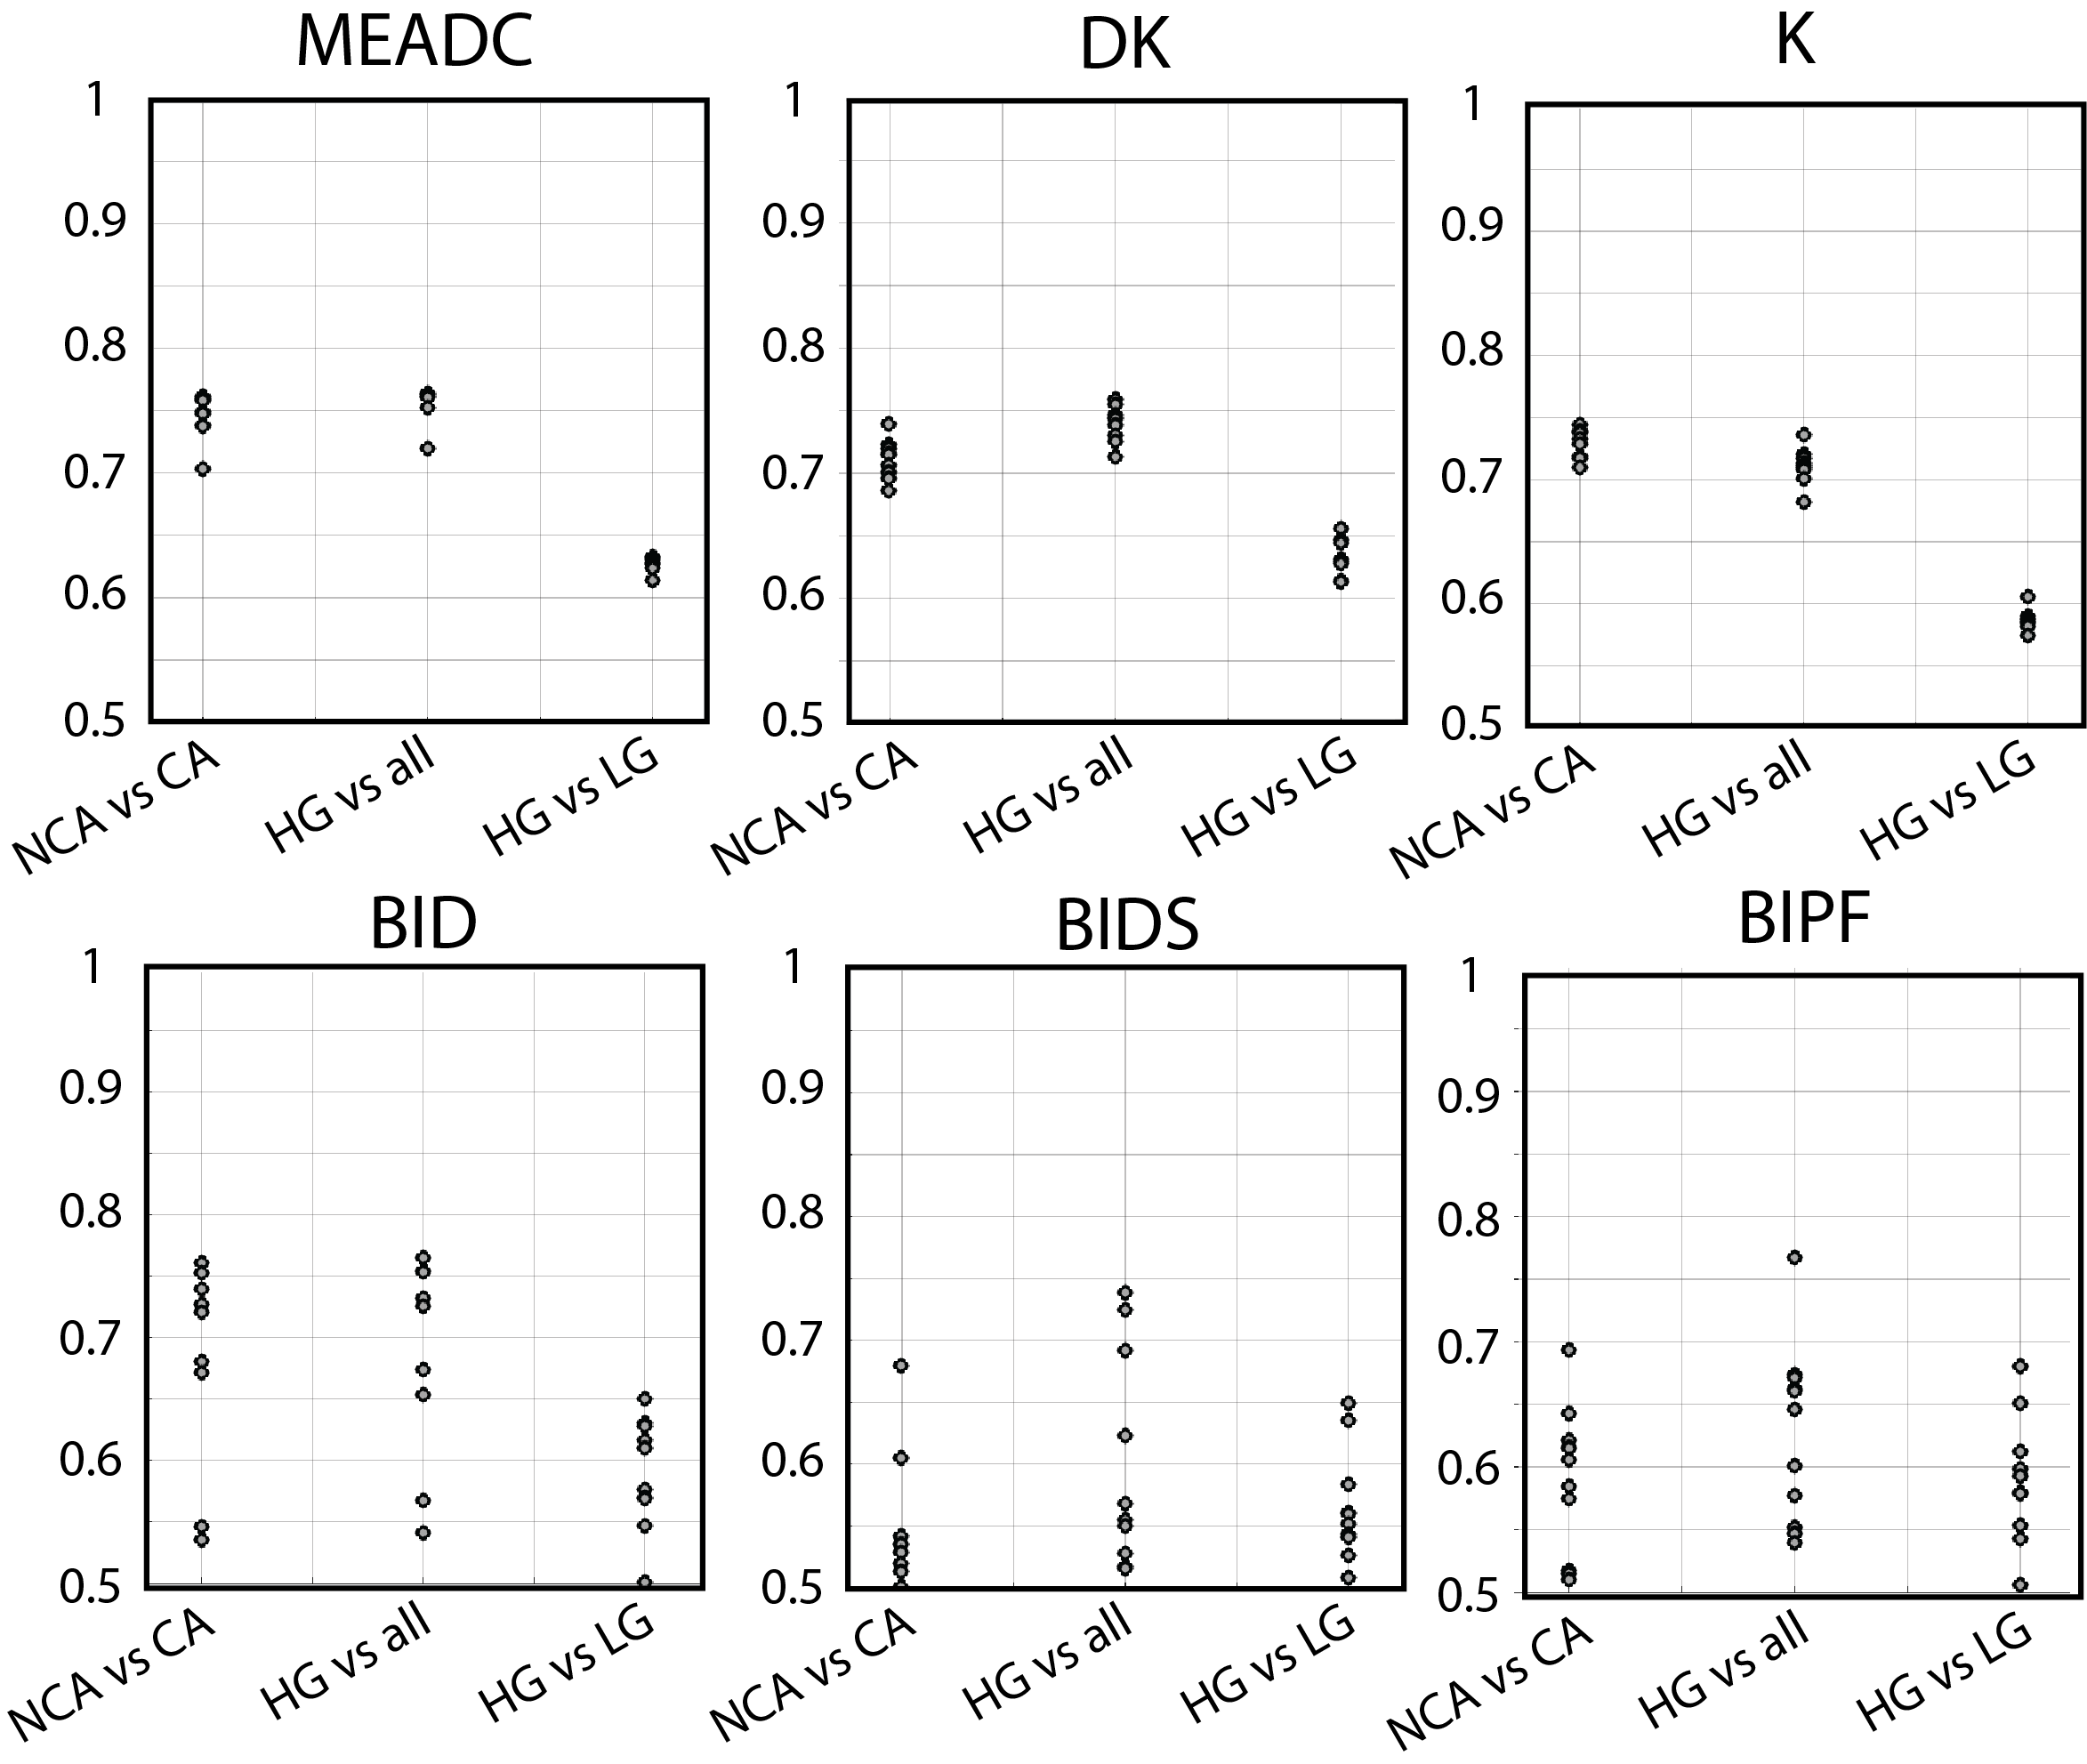
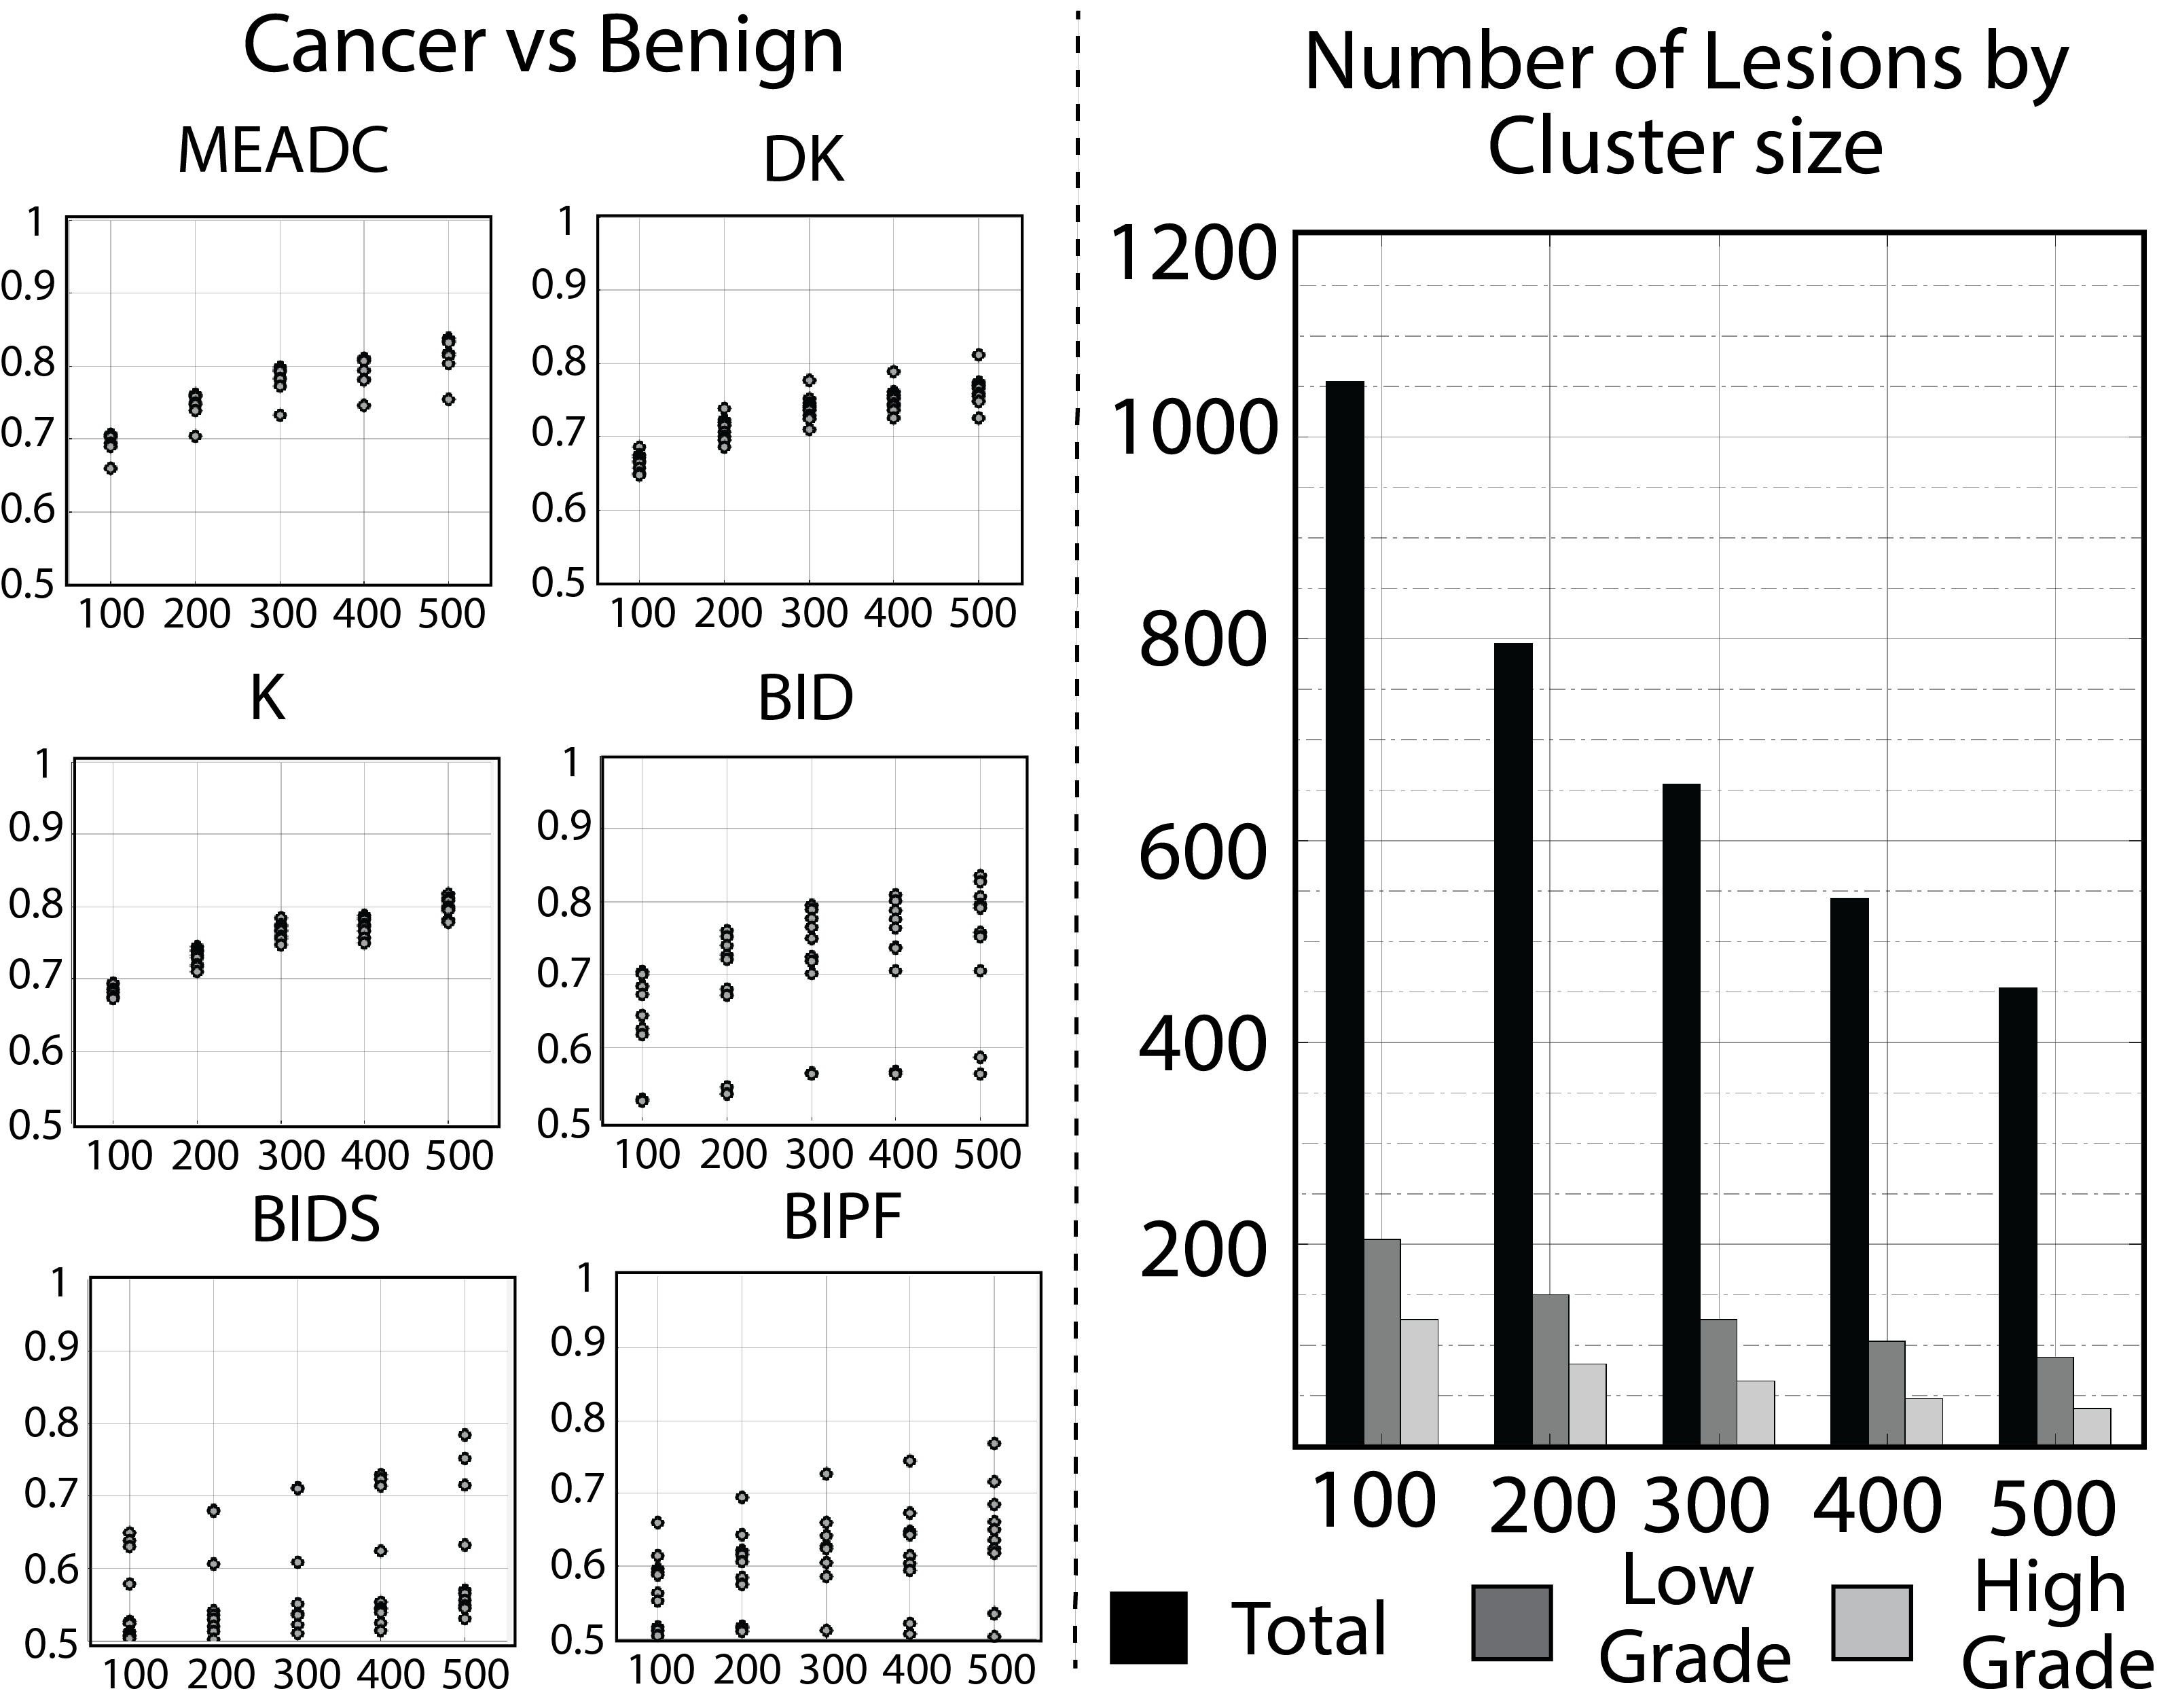
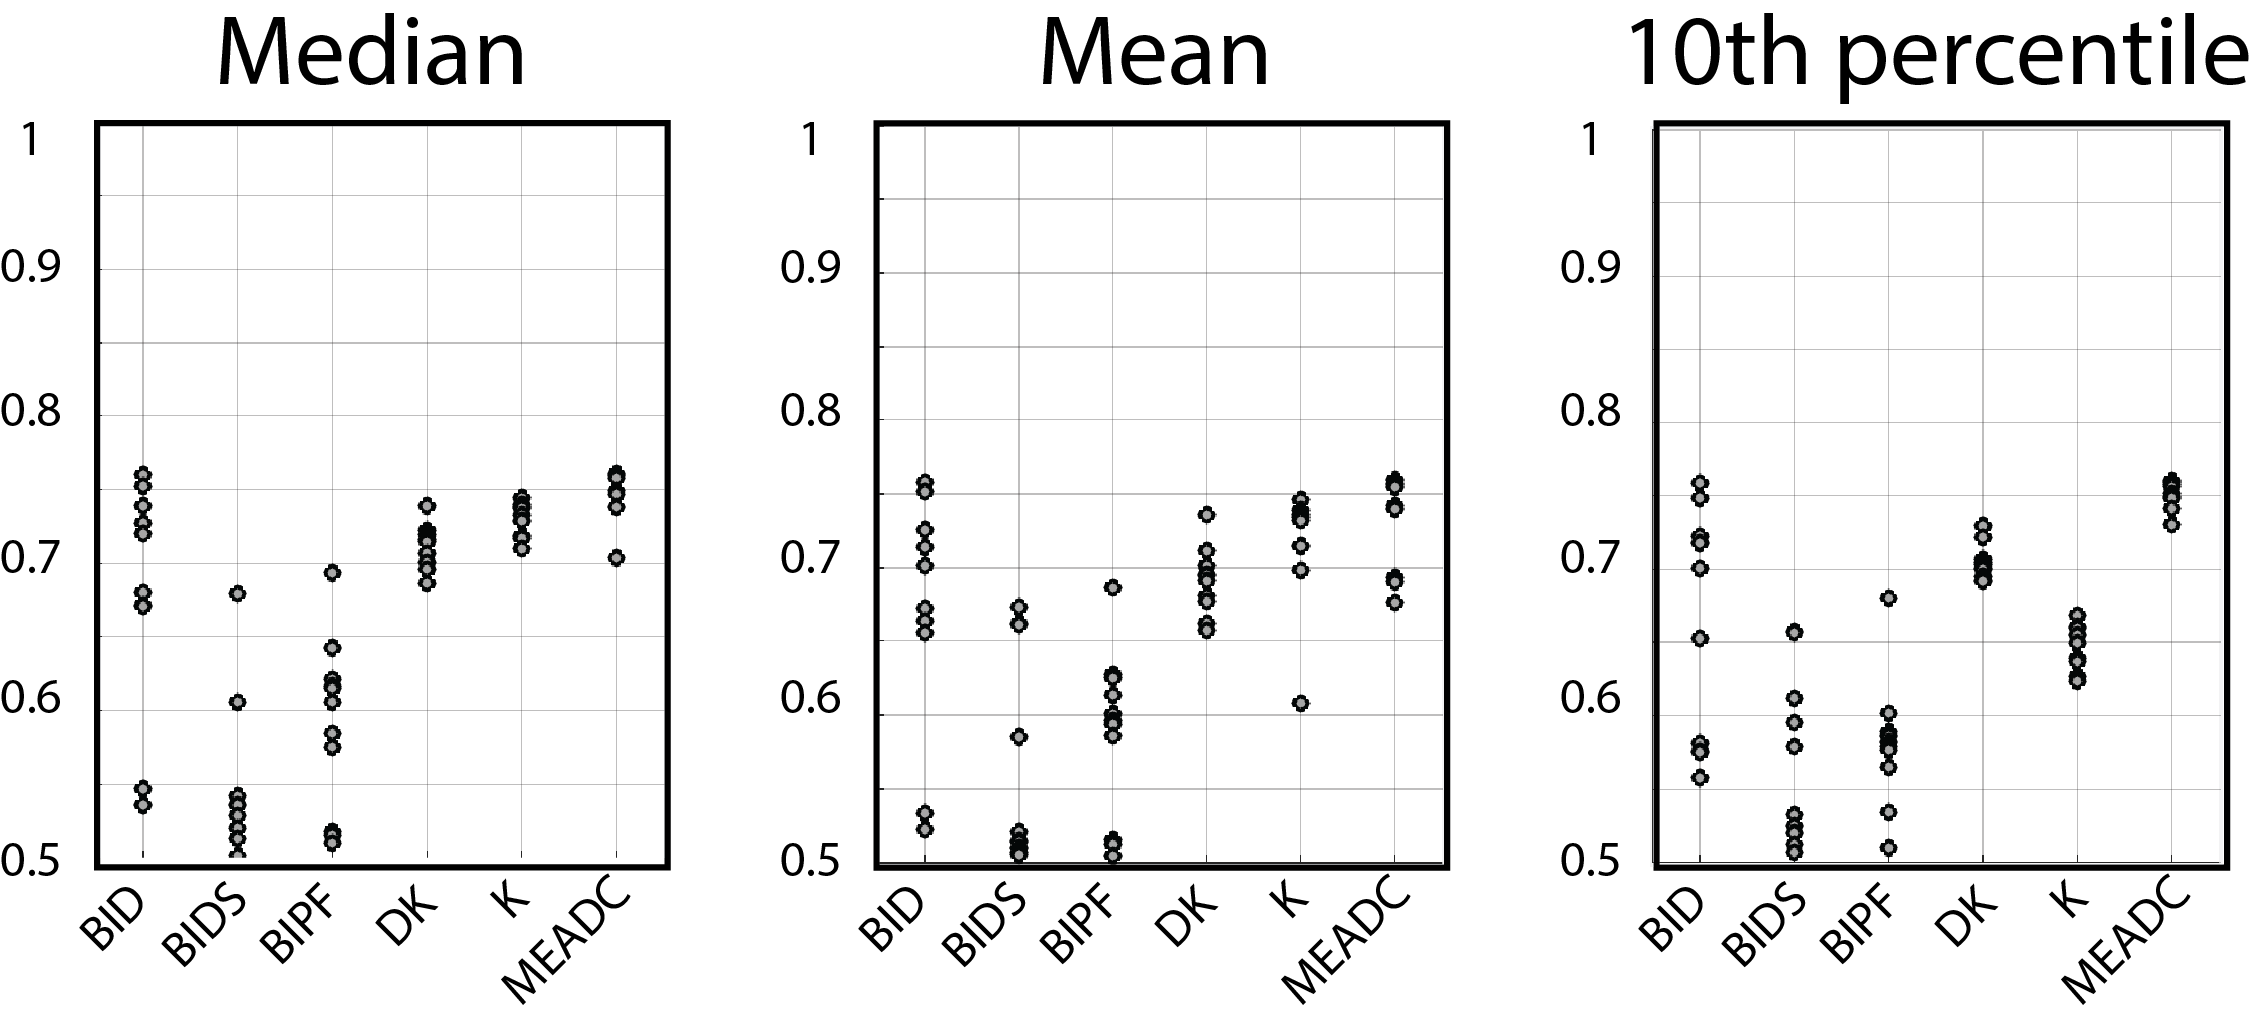
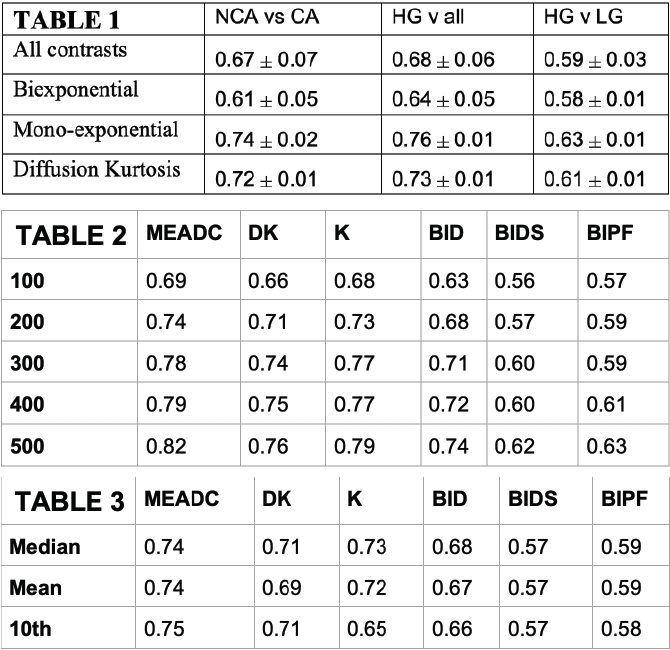
Table 1. Resulting area under the curve stratifying regions of interest as cancer (G3+) vs healthy tissue, high grade (G4+) vs all, and high grade (G4+) vs low grade (G3) grouped by all contrasts, biexponential fits (BID, BIDS, BIPF), diffusion kurtosis (K, DK), and monoexponential (MEADC).
Table 2. Area under the curve by contrast varying the minimum lesion size included in the analysis. Lesions are measured as contiguous in plane regions.
Table 3. Area under the curve by contrast varying the method for extracting values from the region of interest.