2398
Characterization of the Metabolomic Signature of Prostate Cancer by Mass Spectrometry and Magnetic Resonance Spectroscopy of Urine1MGH/Harvard, Boston, MA, United States, 2Human Metabolome Technologies, Boston, MA, United States
Synopsis
We used Capillary Electrophoresis Time of Flight Mass Spectrometry and Magnetic Resonance Spectroscopy to analyze urine from men undergoing prostate biopsy to investigate their metabolomic profiles and look for potential biomarkers. CE-MS analysis identified 60 metabolites that were statistically different between urine samples of men with PCa and PCa-free men and had overlap with MRS. Pathway analysis of these showed high activity in ceramide, short chain fatty acid (SCFA), branched chain amino acid, serine, threonine and tryptophan metabolism. Targeted studies of these metabolites are underway in our lab; if validated, they have potential to serve as non-invasive biomarkers for PCa.
Introduction
Prostate cancer (PCa) pathogenesis is influenced by alterations in cellular metabolism. Metabolomics measures these biochemical changes to create global tissue metabolite profiles. Urinary studies are noninvasive and can potentially identify biomarkers for PCa. We used Capillary Electrophoresis Time of Flight Mass Spectrometry (CE-TOFMS) and Magnetic Resonance Spectroscopy (MRS) to analyze urine from men undergoing prostate biopsy (PBx) for suspicion of PCa to investigate their metabolomic profiles.Methods
Urine samples were prospectively collected from men undergoing PBx in urology clinic. From our total cohort of 150 men, we retrospectively selected 40 urine samples (20 from men with PBx demonstrating PCa, 20 from men with benign PBx) to be investigated by CE-MS. Analysis of charged metabolites by CE-TOFMS was performed as described (Soga, 2003). Urinary metabolites were extracted from 100 ul urine by vigorous shaking with methanol containing 20 μM of internal standards. All CE-TOFMS experiments were performed using the Agilent CE capillary electrophoresis system (Agilent Technologies, Palo Alto, CA), Agilent G3250AA LC/MSD TOF system (Agilent Technologies), Agilent 1100 series binary high-performance liquid chromatography pump, G1603A Agilent CE-MS adapter, and G1607A Agilent CE-ESI-MS sprayer kit. MRS metabolomic evaluation of urine samples was done using methods previously described (Dinges, 2019). MRS was done on a Bruker 600MHz spectrometer, at 37ºC. Spectra were processed with curve fitting and transformed into statistical matrices using a MatLab-based program. Screening of potential biomarkers was performed with statistical protocols and pathway analyses. Metabolites with concentrations below the detection limit were substituted with zero and metabolites whose levels were below the detection limit in all the samples were excluded. Relative abundances of metabolites were normalized to levels of creatinine. Information regarding metabolite associated pathways and spectra was obtained from the Human Metabolome Database (HMDB).Results
CE-TOFMS analysis produced thousands of features in the combined anionic and cationic modes (Figure 1). A volcano plot comparing p values against fold change identified 60 metabolites that were statistically different between urine samples of men with PCa and those of PCa-free men (Figure 2). Pathway analysis of these metabolites using MetaboAnalyst (Chong, 2019) showed cancerous prostates had high activity in ceramide, short-chain fatty acid (SCFA), branched-chain amino acid, serine, threonine, and tryptophan metabolism while having low activity in ornithine and histidine metabolism (Figure 3). Metabolomic signatures of urine from men with PCa and PCa-free men were graphically contrasted using a radar plot (Figure 4). From HMDB, 1H MRS spectra of the metabolites which showed the most significant fold change differences between cancer and control on CE-TOFMS were obtained. These peaks were correlated with 1H MRS spectral regions found to be statistically different between urine of men with PCa and urine of PCa-free men on MRS analysis on the same specimens; these correlations were visually demonstrated (Figure 5).Discussion
CE-TOFMS analysis identified over 60 metabolites which were significantly different between urine of men with PCa and PCa-free men. These metabolites were subsequently grouped using a pathway analysis utilizing HMDB and MetaboAnalyst, which showed several metabolic pathways that were upregulated in urine of men with PCa. These metabolites are involved in steroid, aromatic, microorganism and SCFA processes and warrant targeted studies that are underway in our lab. The significant metabolites and pathways identified on CE-TOFMS also had graphical overlap with the regions of interest that we isolated in our MRS analysis comparing urine from men with and without PCa. Further analyses of the correlation between the CE-TOFMS and MRS metabolomic data are underway in our lab.Conclusion
If validated, the metabolites and pathways we identified with these experiments have the potential to serve as non-invasive urine-based biomarkers that could aid in PCa diagnosis or severity characterization.Acknowledgements
No acknowledgement found.References
Soga, T., Ohashi, Y., Ueno, Y. et al. Quantitative metabolome analysis using capillary electrophoresis mass spectrometry. J Proteome Res. 2003; 2: 488–494
Chong, J., Yamamoto M. and Xia, J. (2019) MetaboAnalystR 2.0: From Raw Spectra to Biological Insights, Metabolites 2019, 9(3), 57.
Dinges, S.S., Hohm, A., Vandergrift, L.A. et al. Cancer metabolomic markers in urine: evidence, techniques and recommendations. Nat Rev Urol 16, 339–362 (2019) doi:10.1038/s41585-019-0185-3
Figures
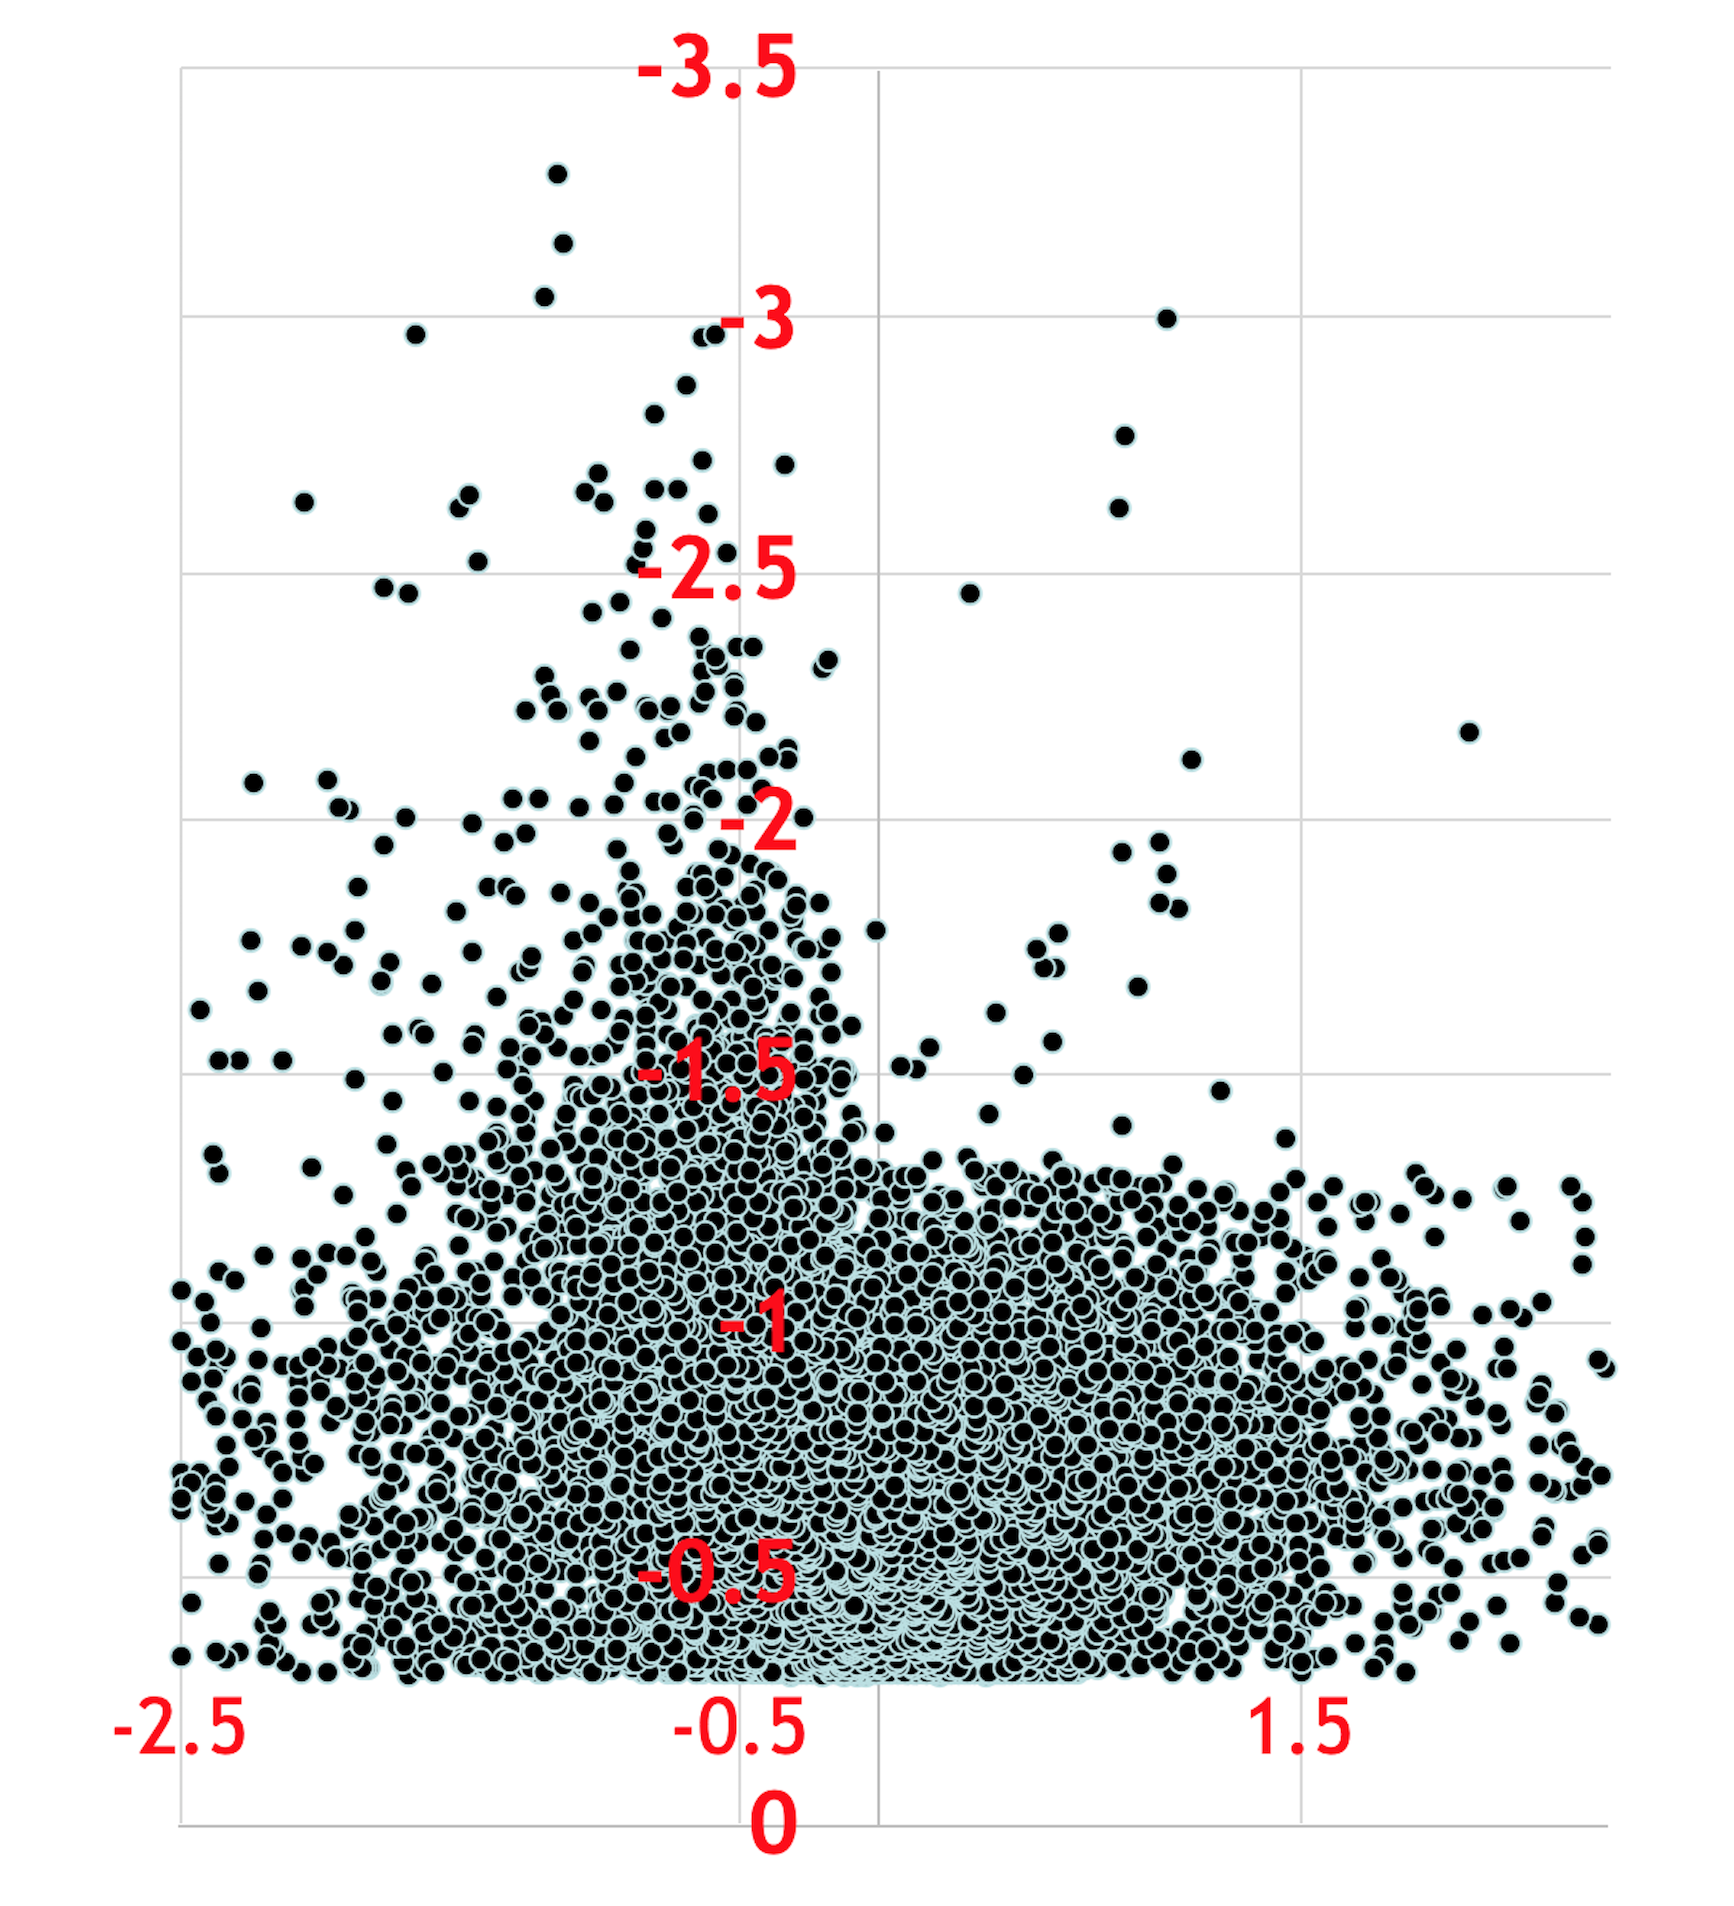
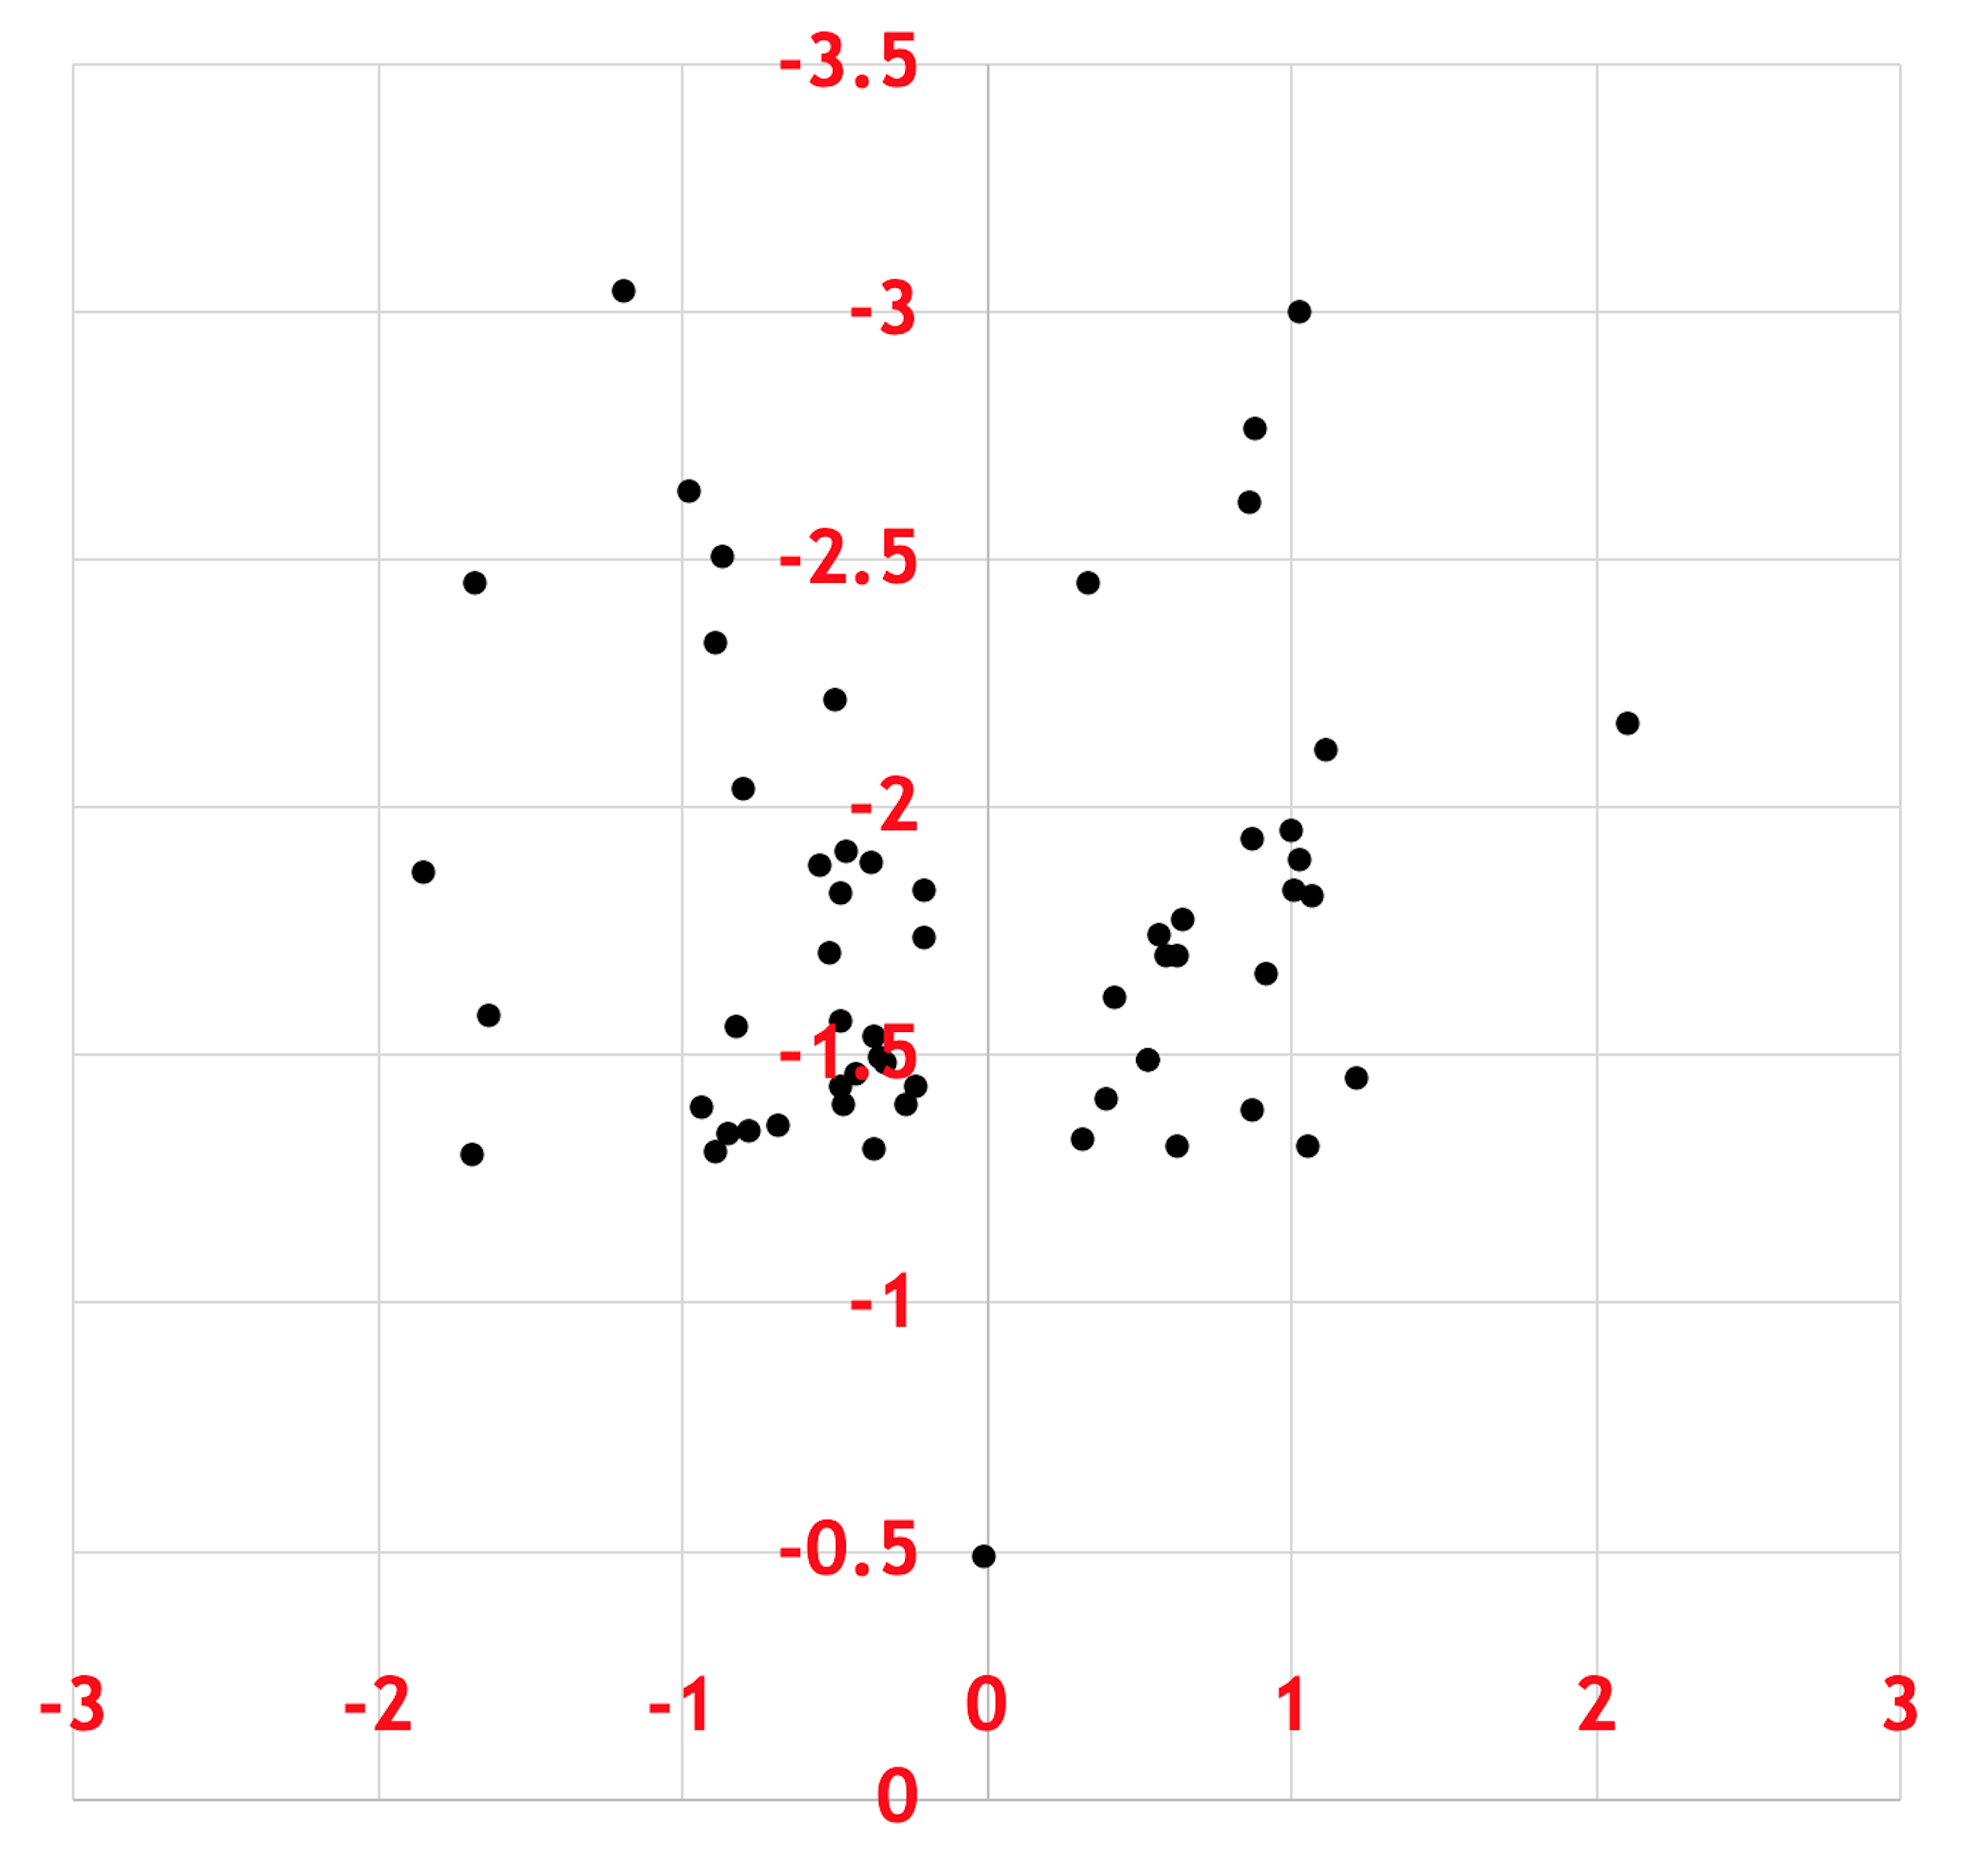
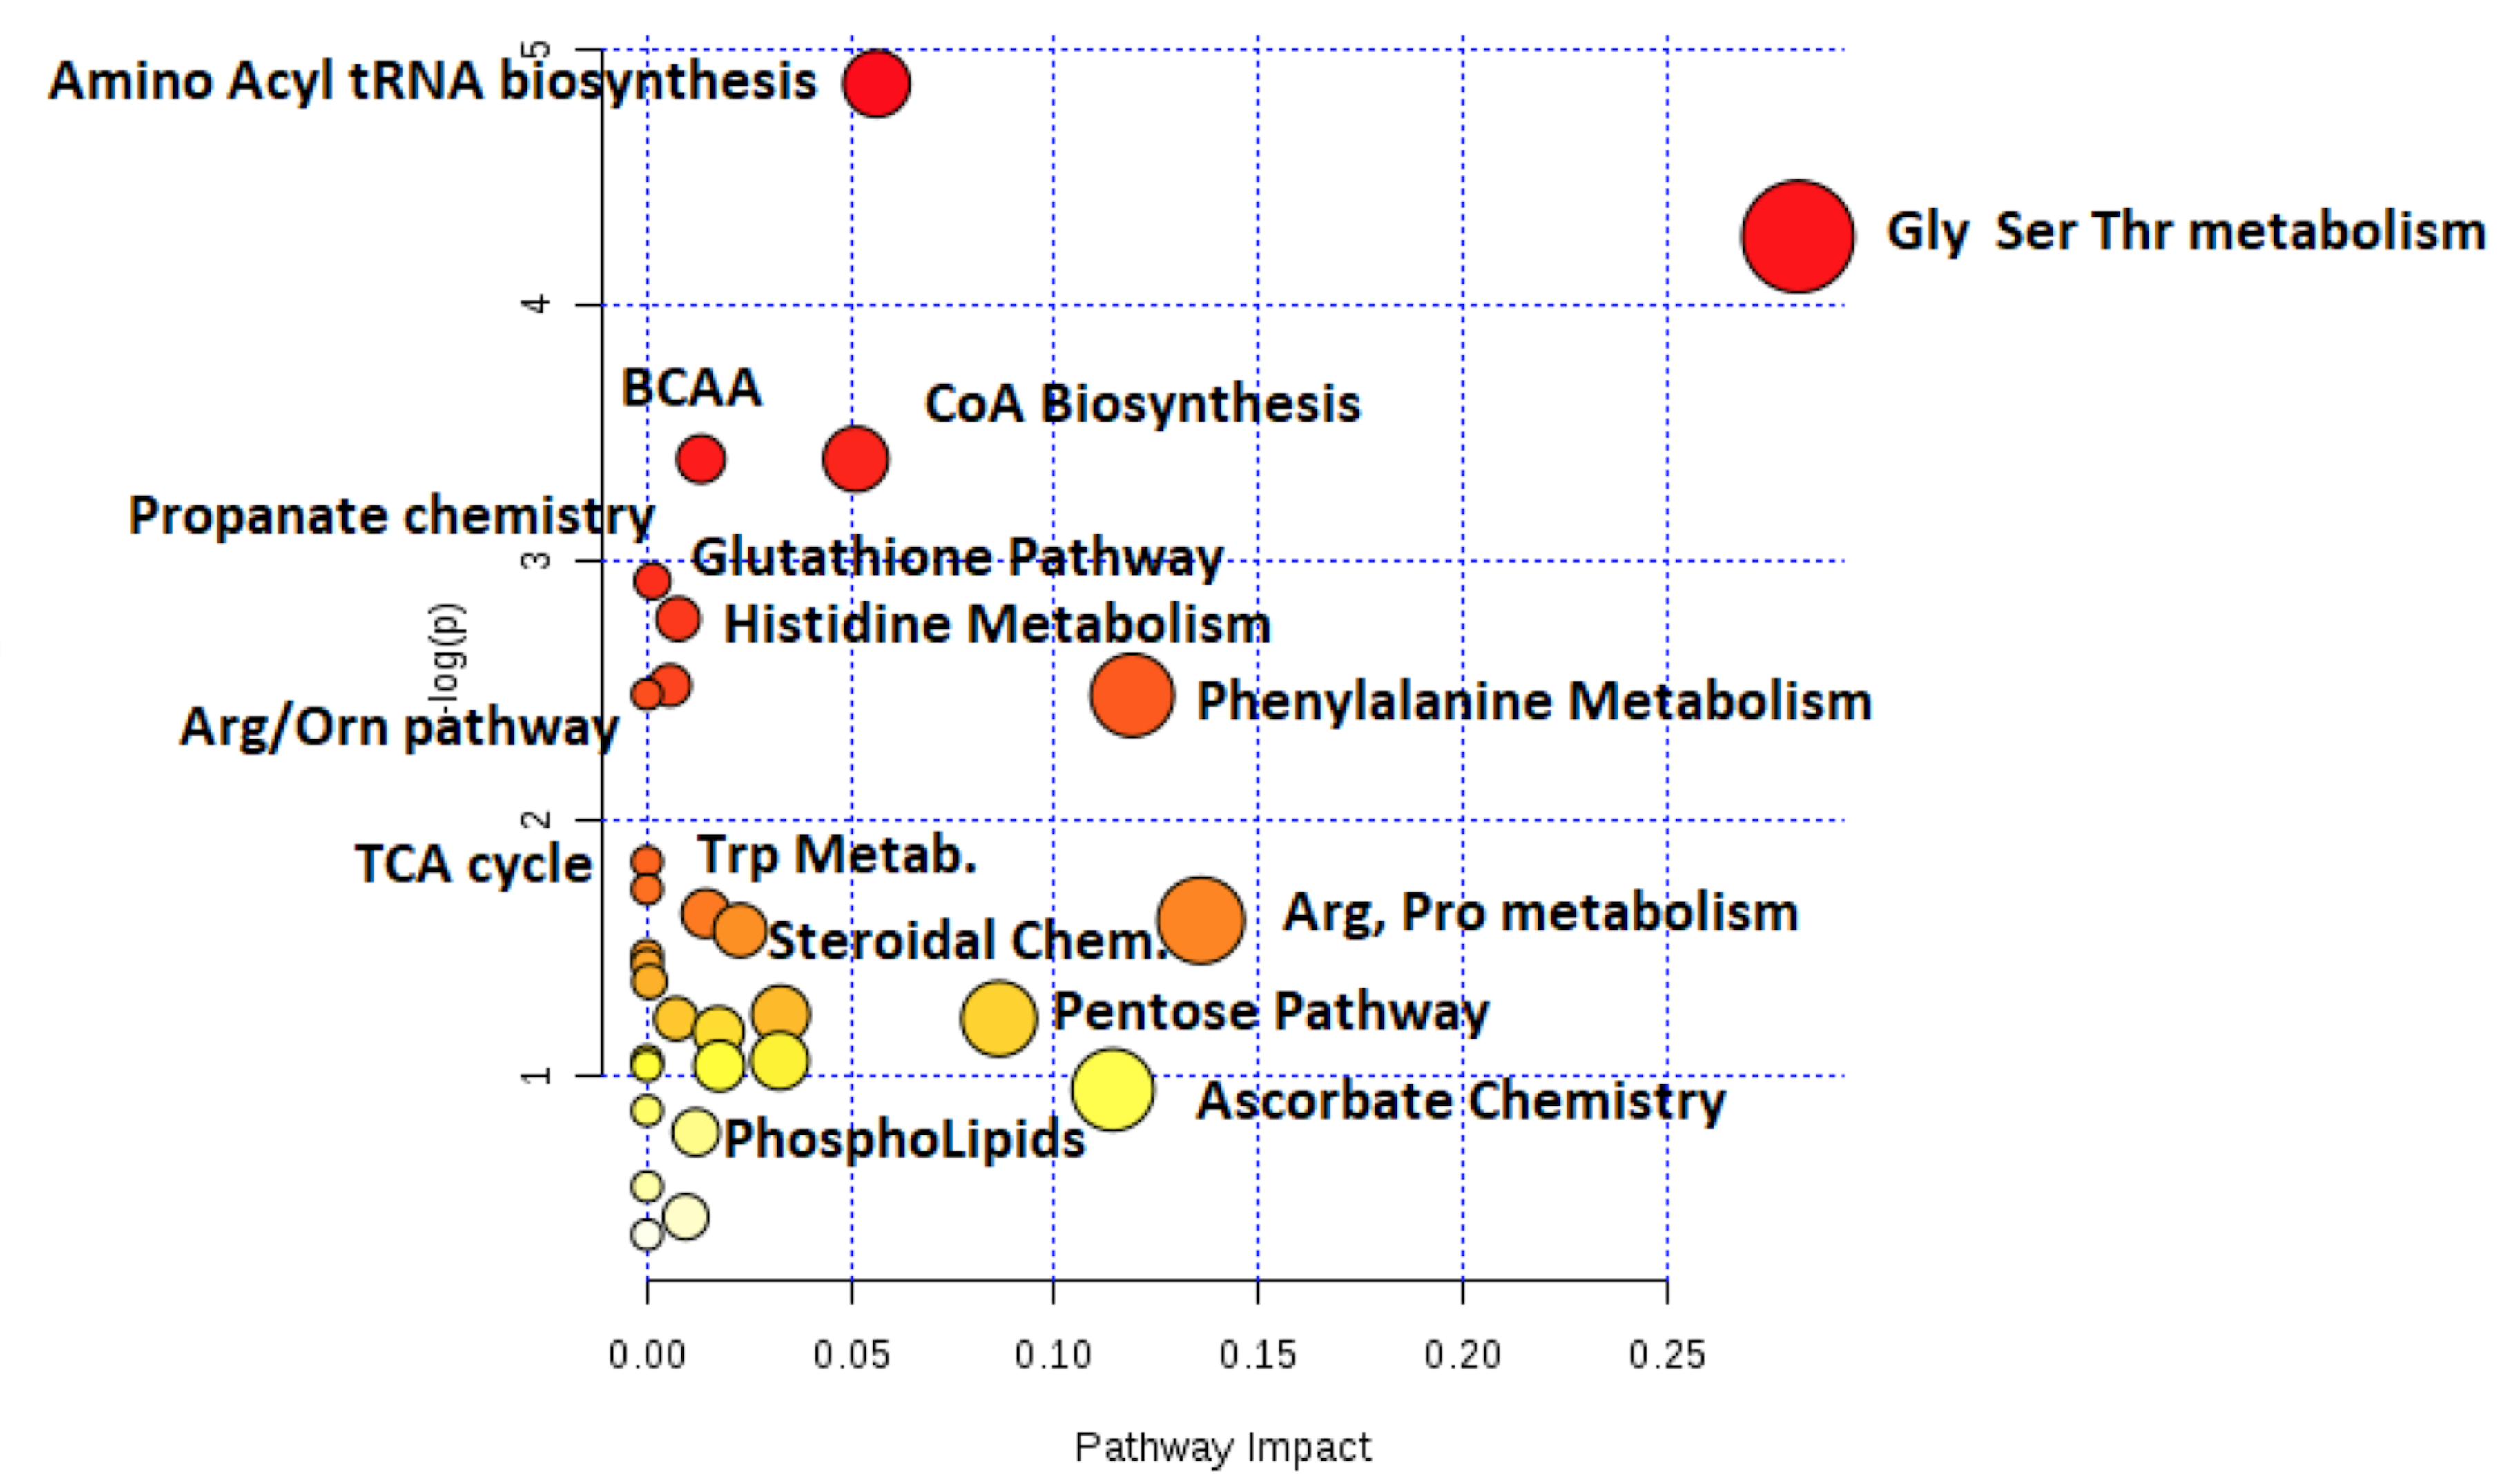
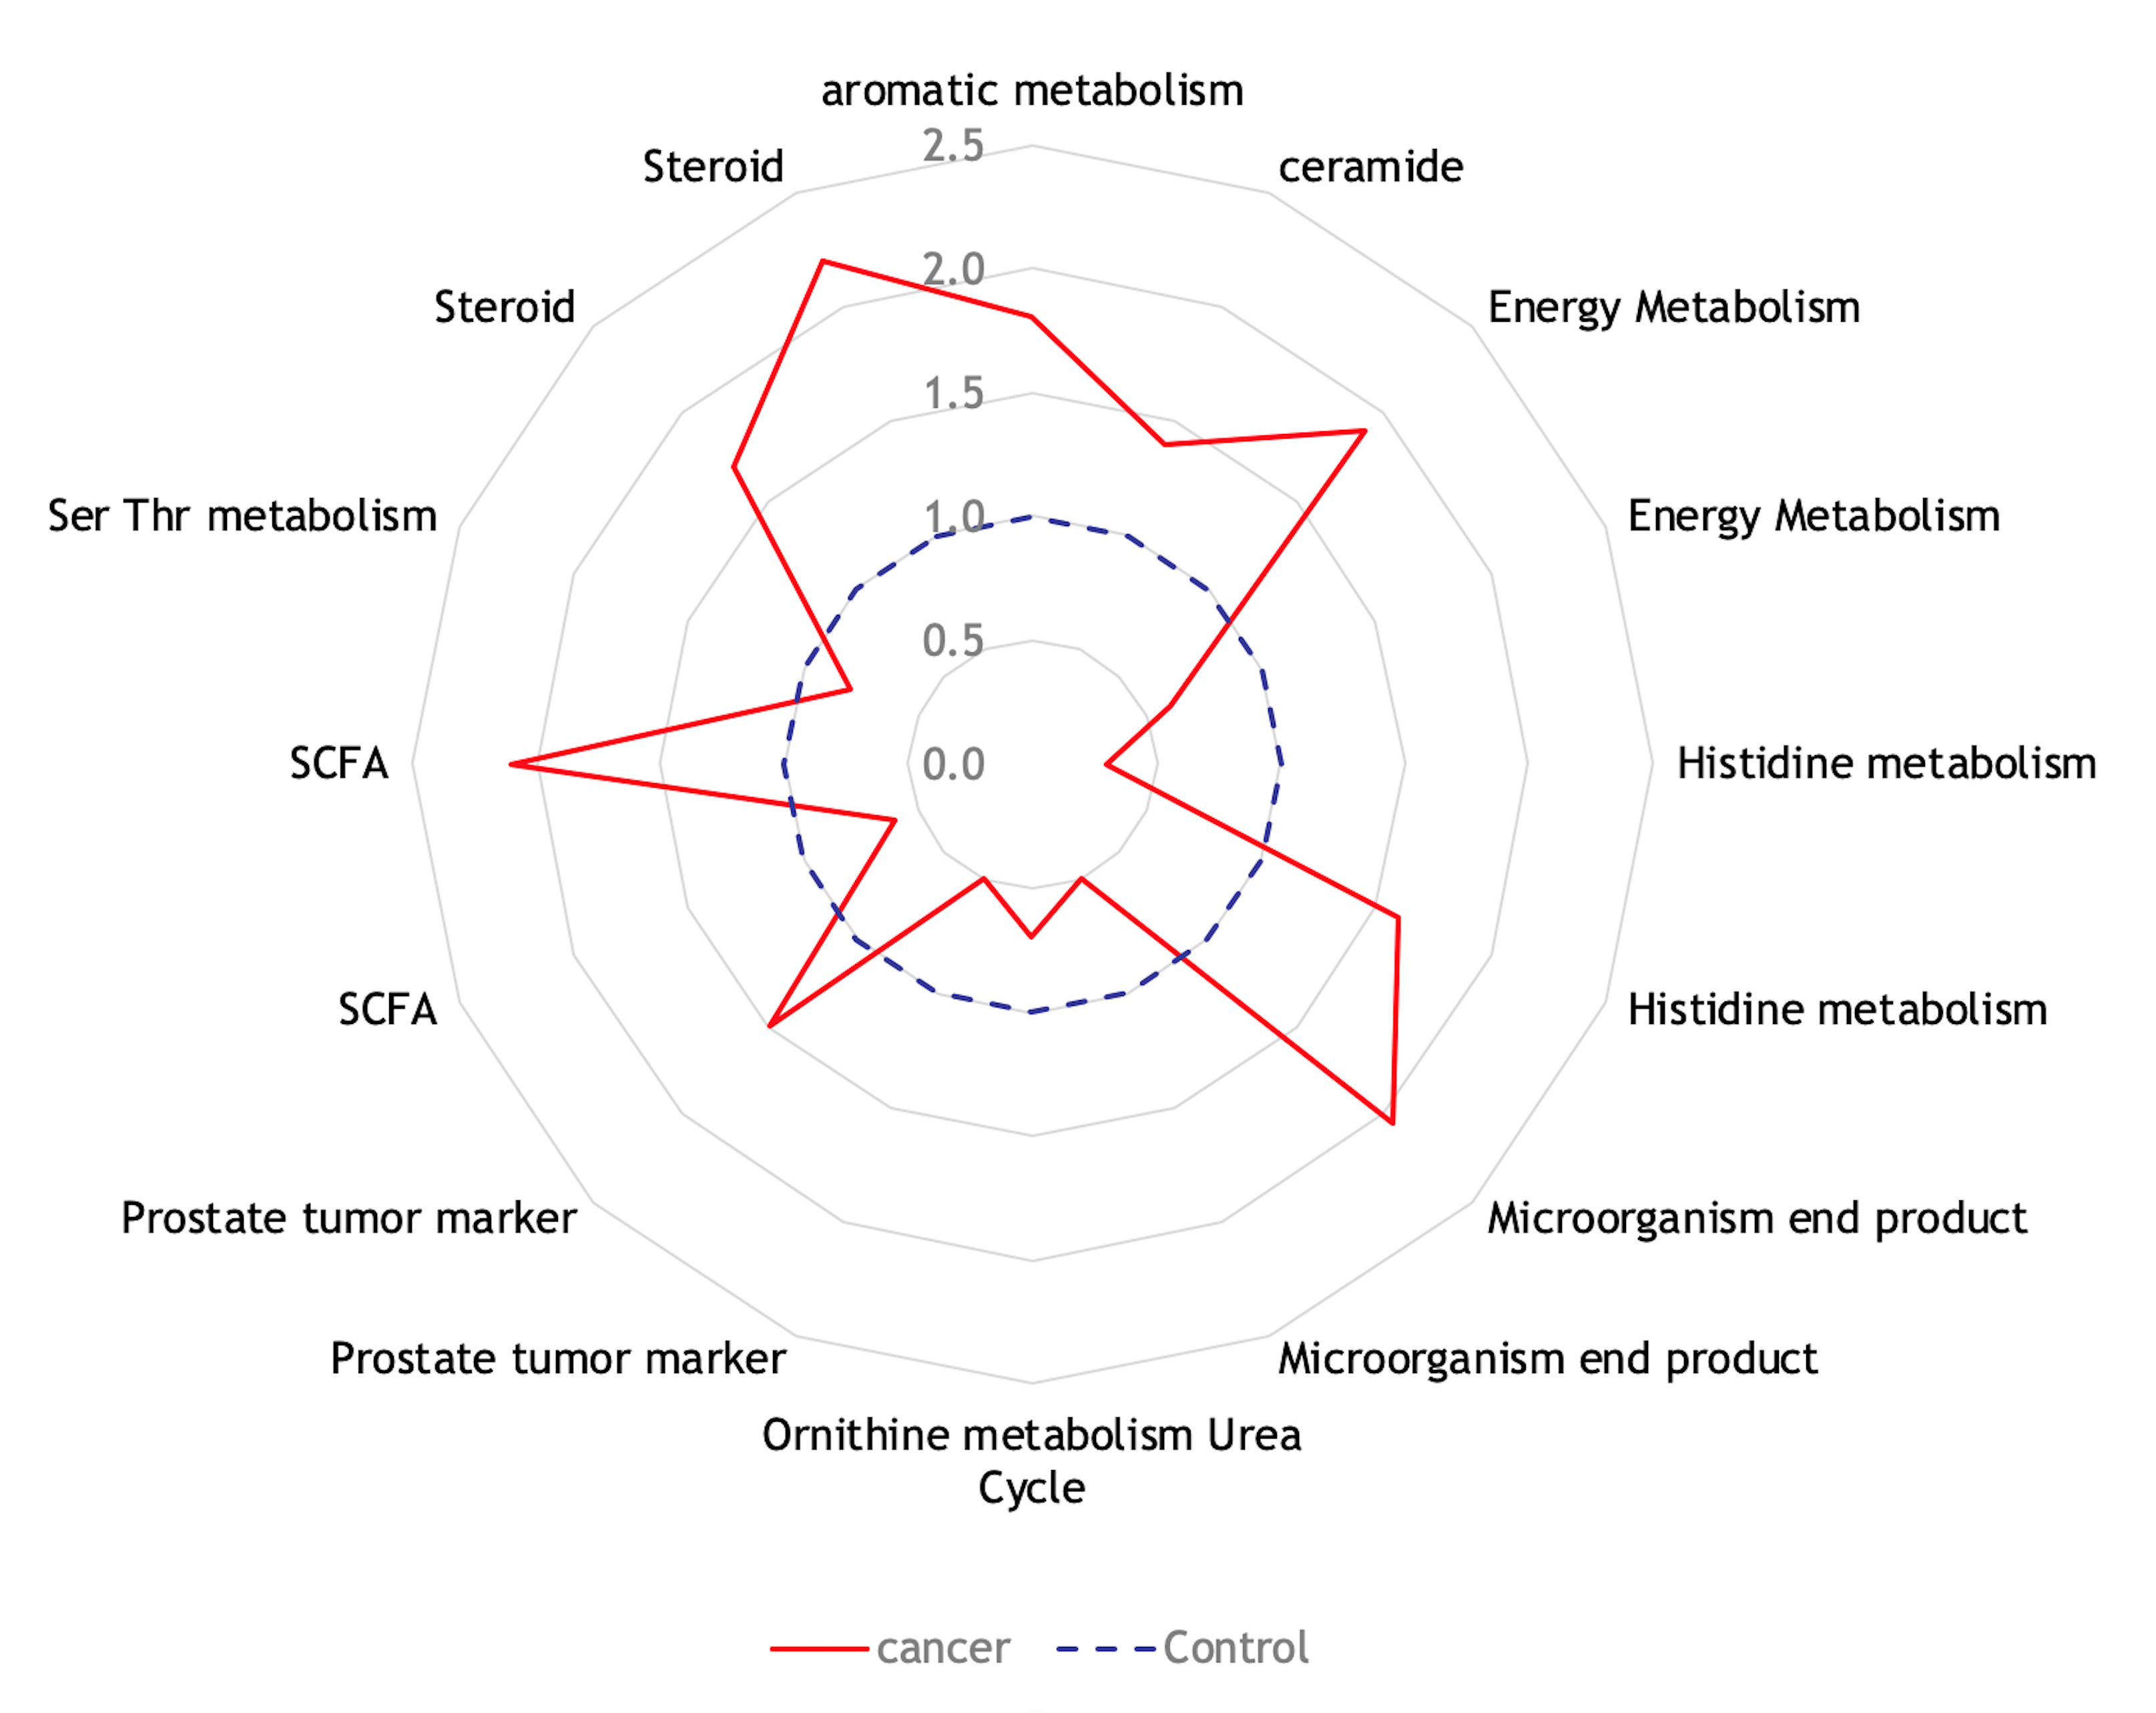

Figure 5: Comparison of metabolites identified by CE-TOFMS and MRS modalities. On a 1H MRS spectra, squares represent peaks of metabolites found on CE-TOFMS, while circles represent peaks of statistically significant metabolites found on MRS. Red color indicates higher levels in cancer, blue indicates lower levels in cancer. Boxes demonstrate overlap of significant metabolites found by CE-TOFMS and MRS.