2397
Differential diagnosis of prostate cancer and benign prostatic hyperplasia using texture features based on multiple high b-values DWI
Jingjun Wu1, Ailian Liu1, Jiazheng Wang2, Zhiwei Shen2, Lihua Chen1, Qingwei Song1, Renwang Pu1, and Bingbing Gao1
1Department of Radiology, the First Affiliated Hospital of Dalian Medical University, Dalian, China, 2Philips Healthcare, Beijing, China
1Department of Radiology, the First Affiliated Hospital of Dalian Medical University, Dalian, China, 2Philips Healthcare, Beijing, China
Synopsis
This work aimed for multiple high b-values DWI texture features based strategy to identify prostate cancer and benign prostatic hyperplasia, which may provide more abundant and comprehensive quantitative information, and promote clinical decision-making. The results showed that the diagnostic value was improved with AUC of 0.832 (sensitivity: 0.800, specificity: 0.762) based on combined texture features from ultra-high b value (b = 800, 1200, 2000s/mm2) DWI images, which is a valuable strategy for clinical practice.
Purpose
To investigate the value of texture features based on multiple high b-values diffusion-weighted imaging (DWI) images in differentiation of prostate cancer and benign prostatic hyperplasia.Introduction
Prostate cancer is the second most common cancer among males and it features high death rate[1]. DWI might be used as a biomarker for tumor aggressiveness, and various reports have been made on using DWI in distinguishing prostate cancer from benign prostatic hyperplasia[2]. Texture analysis is a new image analysis method, which has been used for malignant tumor grade or prognosis evaluations[2,3,4]. MR texture analysis can quantify the distribution of signal intensity of voxels within the tumor to reflect tumor heterogeneity[3]. We hypothesize that it is feasible to identify prostate cancer from benign prostatic hyperplasia by multiple high b-values DWI texture features based strategy.Materials and Methods
The present study retrospectively enrolled 36 patients from May 2019 to September 2019 in our hospital who were pathologically or follow-up imaging confirmed as prostate cancer (n=17), benign prostatic hyperplasia (n=19), respectively. All patients have underwent preoperative MR examinations (3.0T MR scanner, Ingenia CX, Philips, Holland), including routine scanning (T1WI, T2WI, and dynamic contrast-enhanced MR imaging) sequences and additional multiple b-values DWI sequence (b values = 0, 20, 50, 100, 150, 200, 400, 800, 1200, 2000, 3000 (s/mm2)). On the IntelliSpace Portal (ISP) workstation, the multiple high b-values DWI images (b values = 800, 200, 2000, 3000 (s/mm2), respectively) were imported to Omni-Kinetics software (GE Healthcare) for texture feature measurements. The radiologist reviewed the MR images and manually outlined the region of interests (ROIs) on the largest slice of the tumor on four high b-value DWI images, respectively. Texture features were generated automatically (shown in Figure 1). Texture related parameters, including MinIntensity, MaxIntensity, MedianIntensity, MeanValue, stdDeviation, skewness, kurtosis, uniformity, Energy, Entropy, ShortRunHighGreyLevelEmphasis, LongRunHighGreyLevelEmphasis, was used in this study. Statistic analysis were performed using SPSS 20.0 software. Independent sample t test or Mann-Whitney U test was used to test the difference in texture parameters among DWI images with different b . Diagnostic performance was evaluated by receiver operating characteristic (ROC) analysis, and combined diagnosis was evaluated by logistic regression.Results
On DWI images with b=800 s/mm2, the skewness and kurtosis were significantly different in prostate cancer and prostatic hyperplasia groups (P=0.008, 0.016, respectively). On DWI images with b=1200 s/mm2, the skewness, kurtosis, uniformity, energy, and entropy were all significantly different in prostate cancer and prostatic hyperplasia groups (P=0.041, 0.007, 0.01, 0.031, 0.037, respectively). On b=2000 s/mm2 DWI images, the uniformity was significantly different in prostate cancer and prostatic hyperplasia groups (P=0.017) (Table 1). The areas under ROC curves on DWI images with b value of 800, 1200, and 2000 s/mm2were 0.751, 0.803, 0.683, respectively. Based on combined texture features from ultra-high b value (b = 800, 1200, 2000s/mm2) DWI images, the diagnostic value was improved with AUC of 0.832 (sensitivity: 0.800, specificity: 0.762) (Table 2).Discussion and Conclusion
The multiple high b-values DWI texture features serve as a preoperative and non-invasive method for identifying prostate cancer and benign prostatic hyperplasia, which may provide more abundant and comprehensive quantitative information and promote clinical decision-making. When combined texture features from ultra-high b value (b = 800, 1200, 2000s/mm2) DWI images, the diagnostic value can be improved with AUC of 0.832 (sensitivity: 0.800, specificity: 0.762), forming a valuable strategy for clinical practice.Acknowledgements
No acknowledgement.References
[1]World Cancer Research Fund International/American Institute for Cancer Research Continuous Update Project Report: Diet, Nutrition, Physical Activity, and Prostate Cancer. 2014.[2] Liney GP, Holloway L, Al Harthi TM, et al. Quantitative evaluation of diffusion-weighted imaging techniques for the purposes of radiotherapy planning in the prostate. British Institute of Radiology. 2015, 88(1049):20150034.[3]Aerts Hugo J W L., Velazquez Emmanuel Rios., Leijenaar Ralph T H., Parmar Chintan., Grossmann Patrick., Carvalho Sara., et al. Decoding tumour phenotype by noninvasive imaging using a quantitative radiomics approach. Nat Commun (2014) 5: 4006. doi: 10.1038/ncomms5006Figures
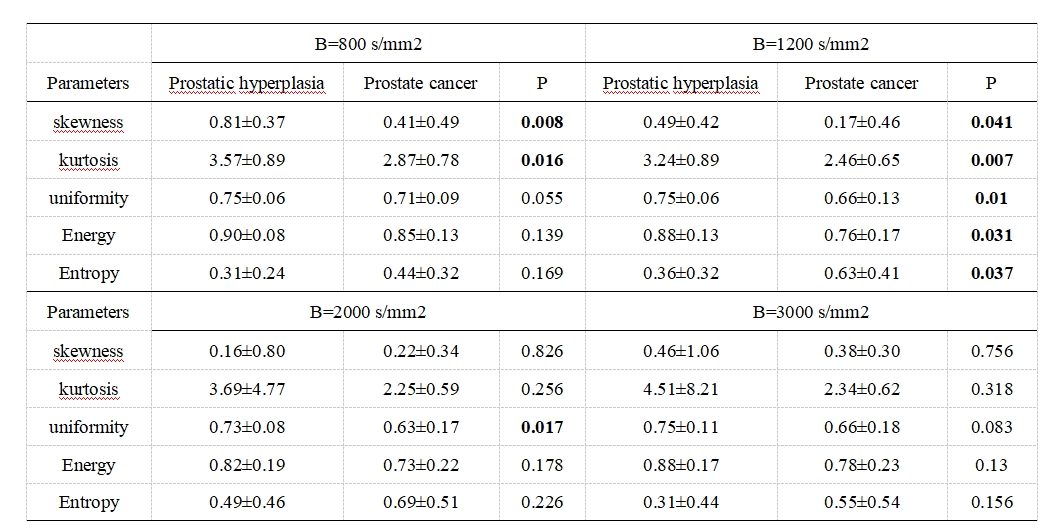
Table 1. Comparison of texture features of multiple high b-values DWI between prostate cancer and benign prostatic hyperplasia
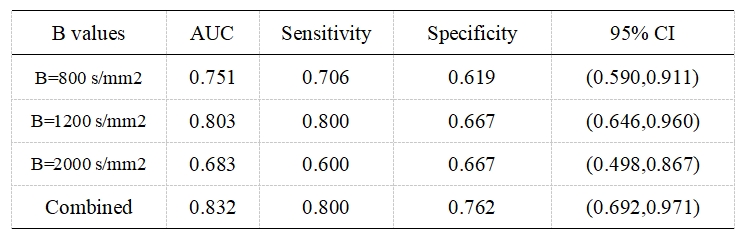
Table 2. Diagnostic efficiency of texture features of high b-values DWI

Figure 1A-1H showed a 48 year-old male with benign prostatic hyperplasia. We manually outlined region of interests (ROIs) on the largest slice of the tumor on DWI images which b values were 800 s/mm2, 1200 s/mm2, 2000 s/mm2 and 3000 s/mm2, respectively (Fig. 1A-1D), and histogram was generated automatically (Fig. 1E-1H). Figure 2A-2H showed a 50 year-old male with prostate cancer. Fig. 2A-2D showed DWI images which b values were 800 s/mm2, 1200 s/mm2, 2000 s/mm2 and 3000 s/mm2, respectively, and histogram was generated automatically (Fig. 2E-2H).