2393
Prostate Tumor Characterization using Texture Analysis of Diffusion MRI1Centre for Biomedical Engineering, Indian Institute of Technology (IIT) Delhi, New Delhi, India, 2Department of NMR, All India Institute of Medical Sciences Delhi, New Delhi, India, 3Department of Radiology, All India Institute of Medical Sciences Delhi, New Delhi, India, 4Department of Biomedical Engineering, All India Institute of Medical Sciences Delhi, New Delhi, India
Synopsis
Accurate diagnosis of prostate-cancer(PCa) remains challenging due to high false-negative rate of biopsy and low-specificity of the screening test. Computer-aided diagnosis(CAD) systems are increasingly being used for detection and diagnosis of PCa. Texture analysis has been proved to be a significant CAD tool in medical applications. The aim of this research was to investigate the role of texture parameters extracted from diffusion-weighted MRI and machine-learning classifiers in distinguishing PCa from normal peripheral-zone(PZ). The proposed methodology has achieved 93% accuracy using support-vector machine classifier. Experiments showed that the application of texture-analysis could improve the accuracy of identifying healthy and cancerous prostate-regions.
Introduction
Automatic diagnosis of prostate-cancer(PCa) as part of a clinical decision support system can potentially assist radiologists for better diagnostics. Large proportion of prostate cancers arise from peripheral-zone (PZ) (70-75%) and transition-zone(TZ) (20-30%)1. According to prostate-imaging-reporting and data system version-2(PI-RADS v2), diffusion-weighted imaging(DWI) is a promising sequence to investigate the aggressiveness of PCa in PZ1. Quantitative and qualitative analysis of DWI at b-values>1000s/mm2 establishes improved MRI sensitivity for distinguishing between low and high-grade PCa in the PZ2. In the past years,texture-analysis has gained attention in healthcare imaging and has been shown as a promising tool for image analysis for problems that human eye cannot perceive3. Texture-analysis describes a wide range of techniques for quantification of gray-level patterns and pixel inter-relationships within an image providing a measure of heterogeneity4. Different texture features and classifiers have been used in the literature for automatic detection and classification of PCa on T2w MRI and multi-parametric MRI(T2w+DWI+DCE)5-9. The objective of this study was to evaluate texture-analysis for characterization of prostate tissues as healthy and cancerous in high b-value(b=1500s/mm2) DWI; design a computer-aided diagnostics(CAD) system using machine-learning classifier for better diagnostic accuracy.Methods
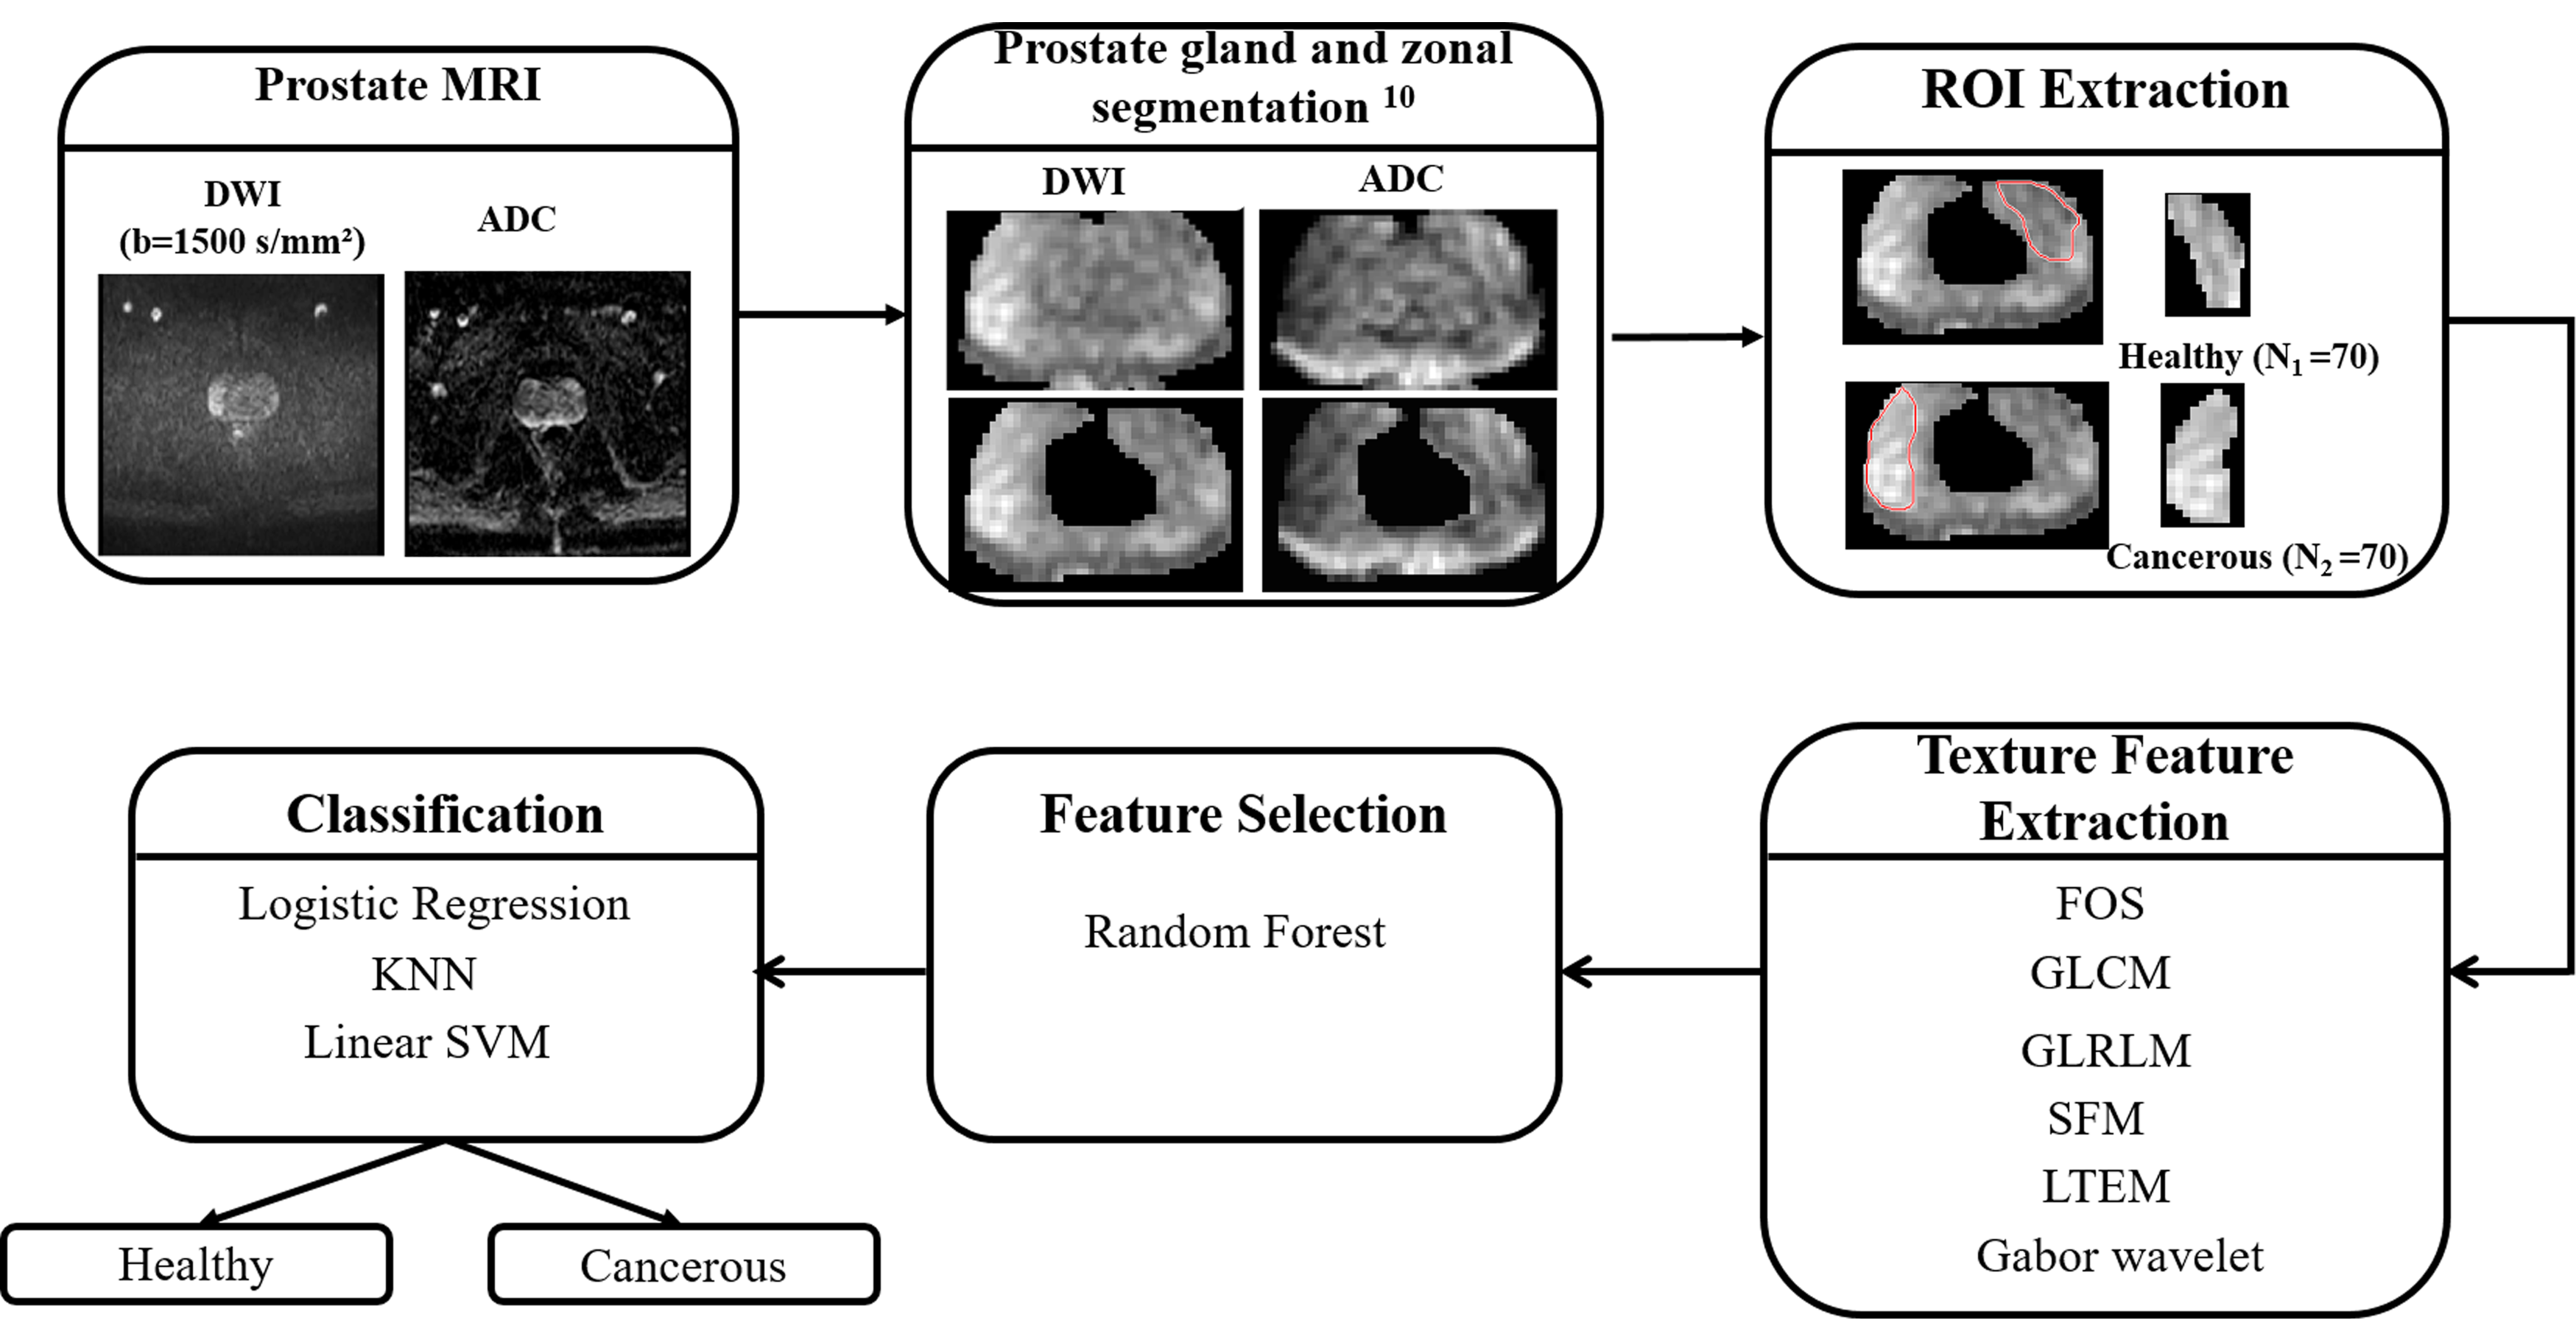
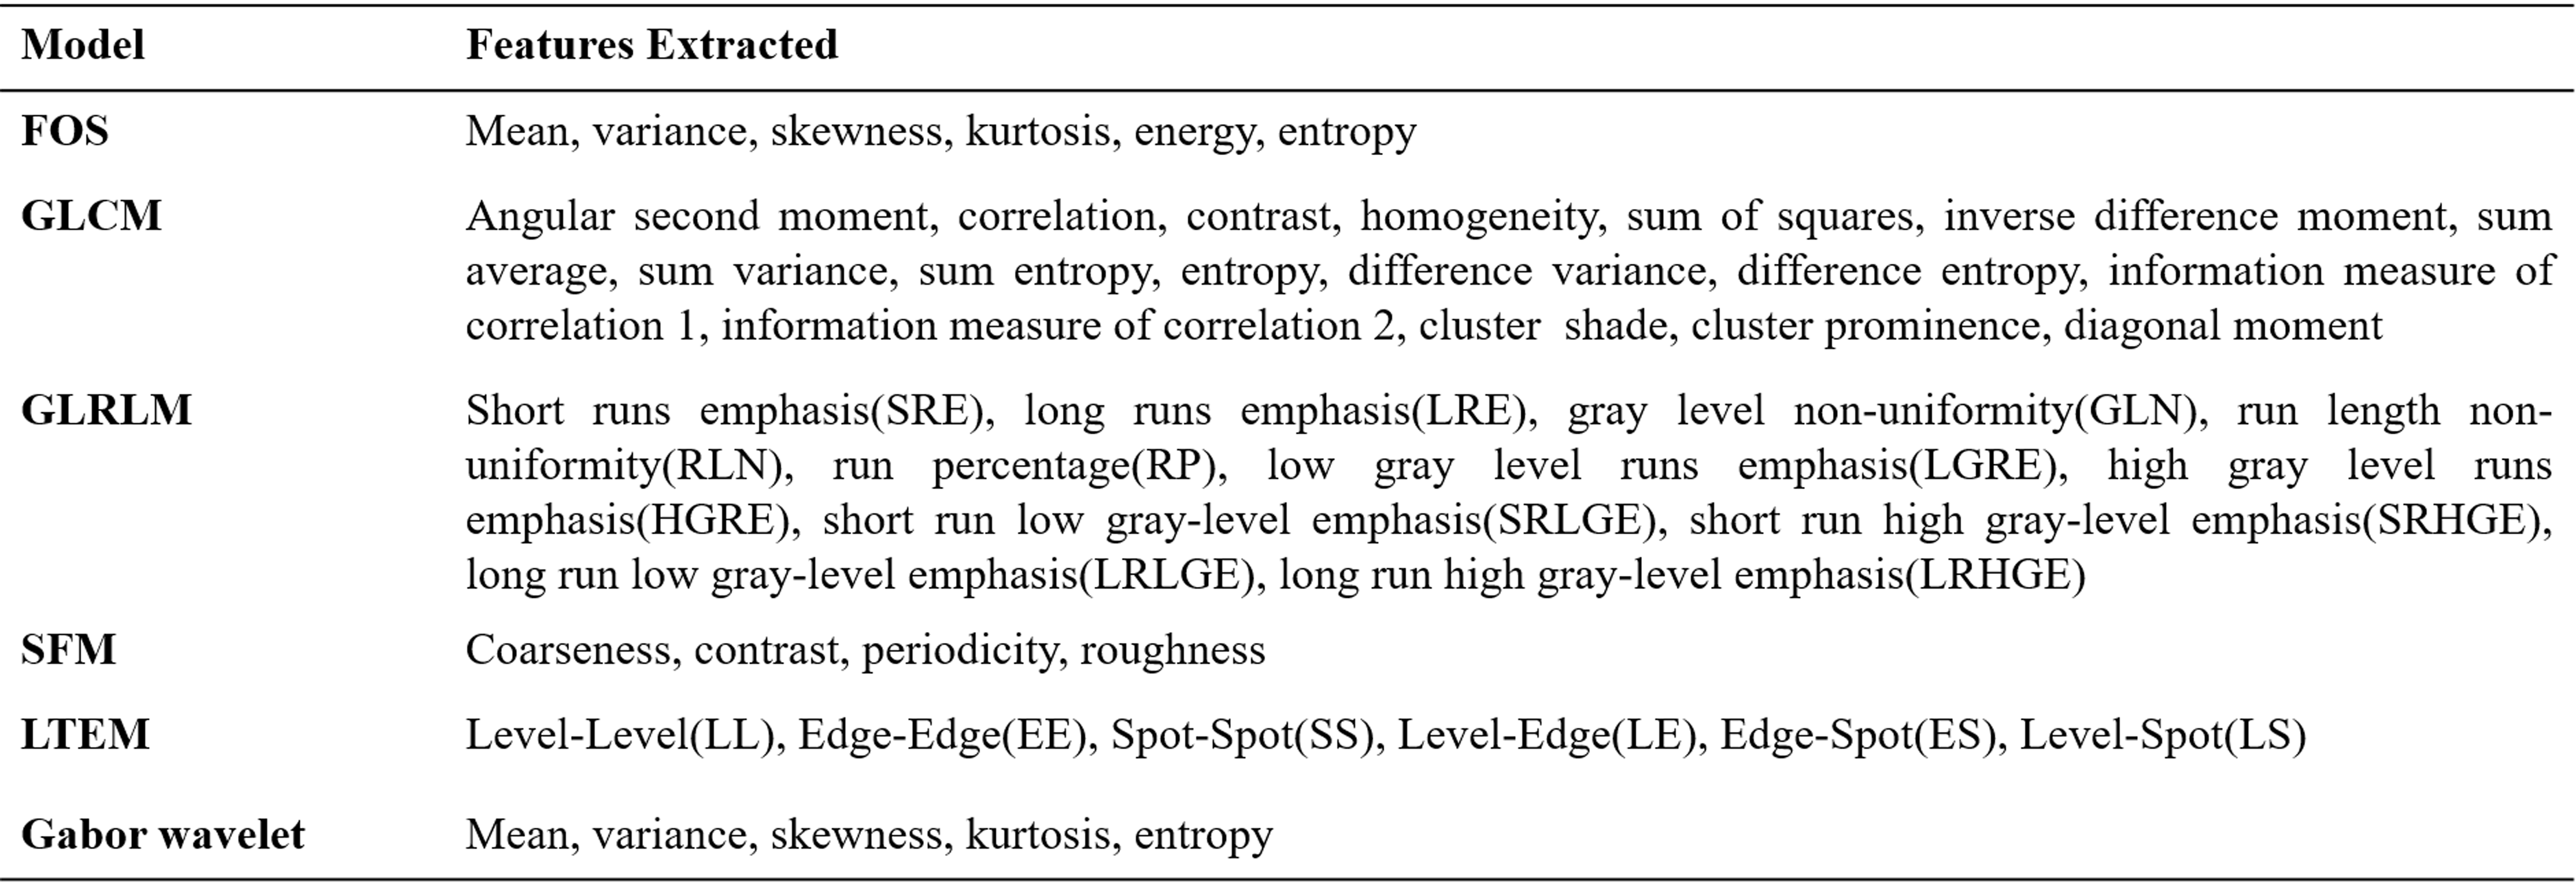
MRI data acquisition: A retrospective MRI dataset from 18 patients of PCa were used in this study. All prostate MRI examinations were acquired using a 3T MRI system (Ingenia,Philips,The Netherlands) using an external phased-array body coil. DWI sequence was performed using echo-planar imaging (TR/TE= 5521/75ms;FOV=177.6×177.6mm2;acquisition-matrix=176×176;voxel-size=1.01× 1.01×4mm3;slice-thickness=4mm;number of slice=30;with four b-values of 0,500,800 and 1500s/mm2).Methodology: The proposed system for prostate tissue classification has five steps: prostate-gland and zonal segmentation, ROI-extraction, texture feature calculation, feature-selection,and classification. The overview of the proposed CAD system is shown in figure-1. In the pre-processing step, prostate-gland and zonal segmentation were performed using active-contour model and atlas-based algorithm,as proposed by Singh et al.10. Primary objective of ROI-extraction was to demarcate prostate region that contains healthy and cancerous tissues in high b-value(b=1500s/mm2) diffusion-weighted images. Cancerous region marking was performed in PZ as per PI-RADS v2 guidelines with the help of an expert radiologist (>10 years of experience in prostate imaging). A total of 140 ROI images (size=32×48 pixels;number of healthy ROIs=70;number of cancerous ROIs=70) were used in this study. Approximately 8 ROIs were marked per patient. A total of 49 features were calculated using 6 texture models for classification purpose as presented in table-1. The main idea of feature-selection algorithms was to search for all promising combinations of features in order to find a subset that has high predictive ability. Random-forest algorithm was used for feature-selection. All texture features were fed into classifiers for the automated classification of prostate tissues into healthy and cancerous. Logistic-regression, k-nearest neighbour (KNN), and support-vector machine(SVM;kernel=linear) were evaluated for classification.
Data were processed using in-house developed routine in MATLAB-2018a(MathWorks). Performance of the classifiers was evaluated using 10-fold cross-validation. The performance was measured using sensitivity, specificity, accuracy, and area under receiver-operating characteristics curve(ROC-AUC).
Results
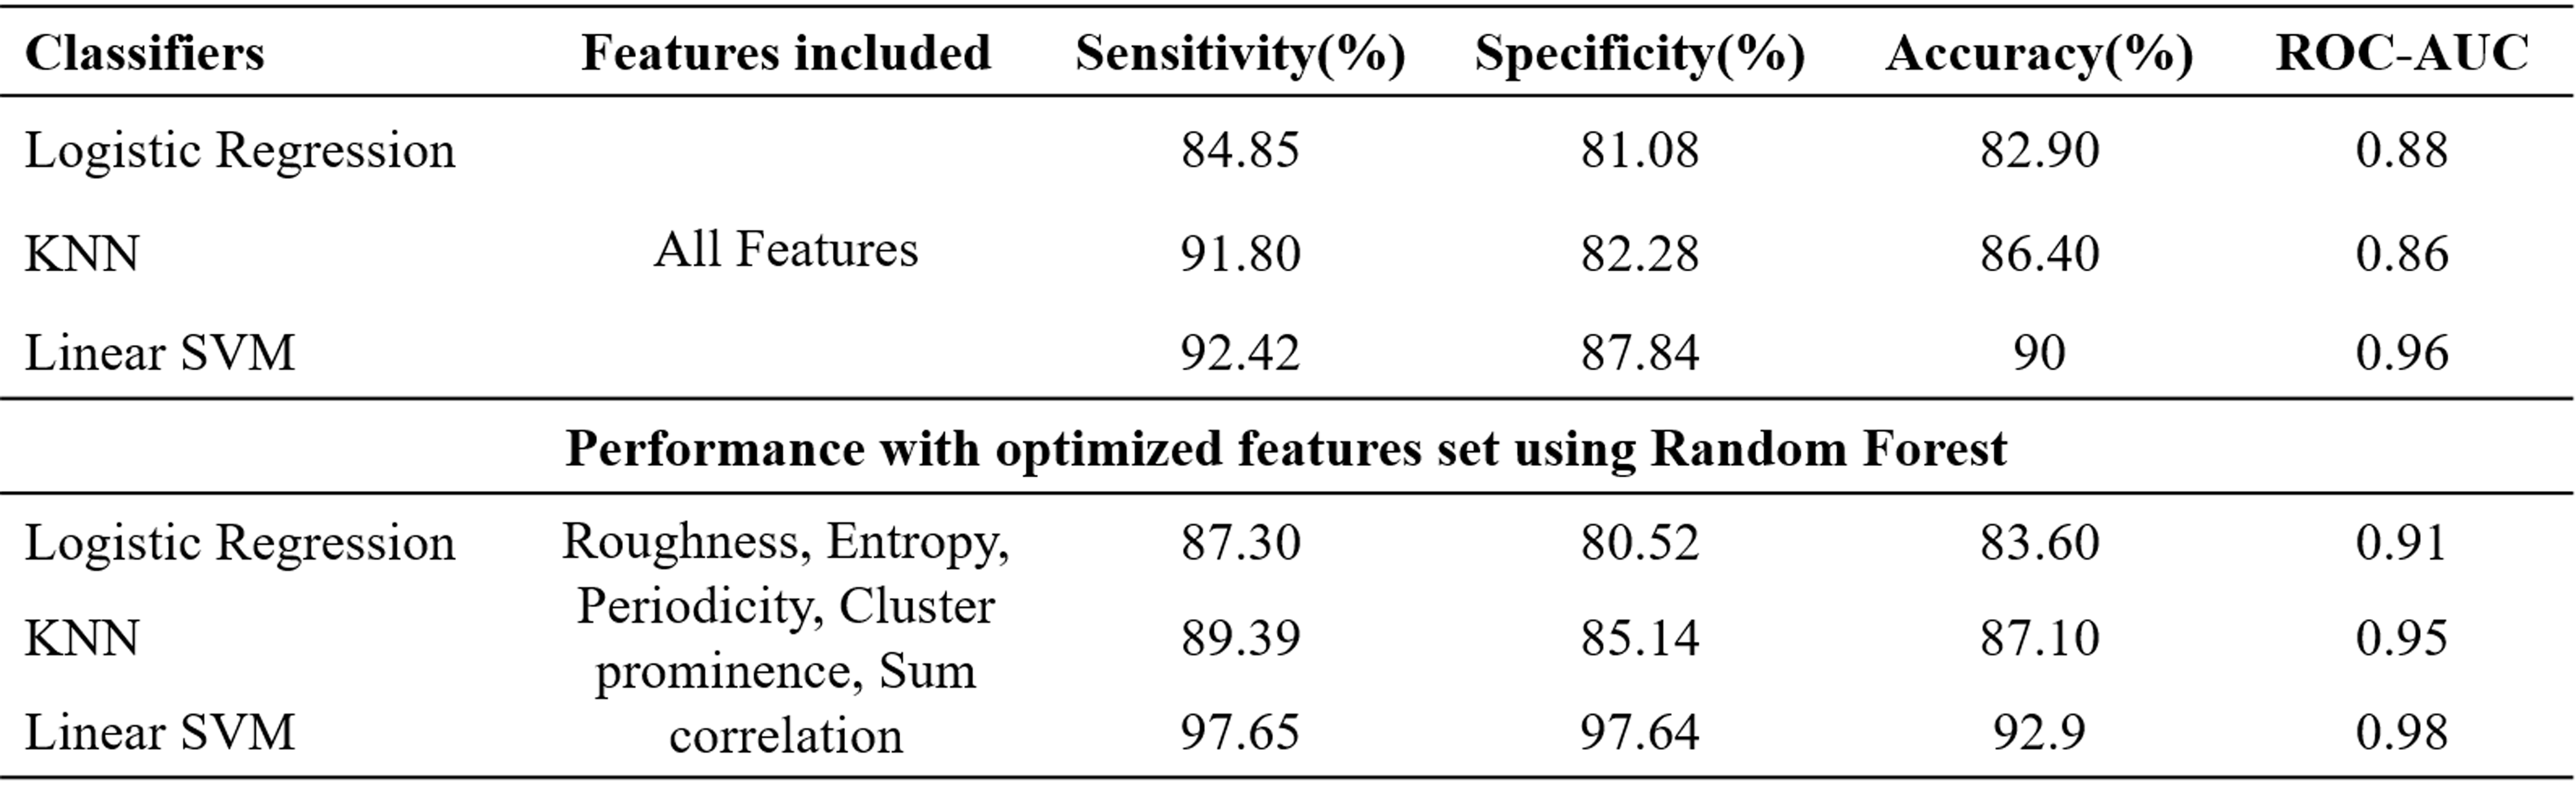
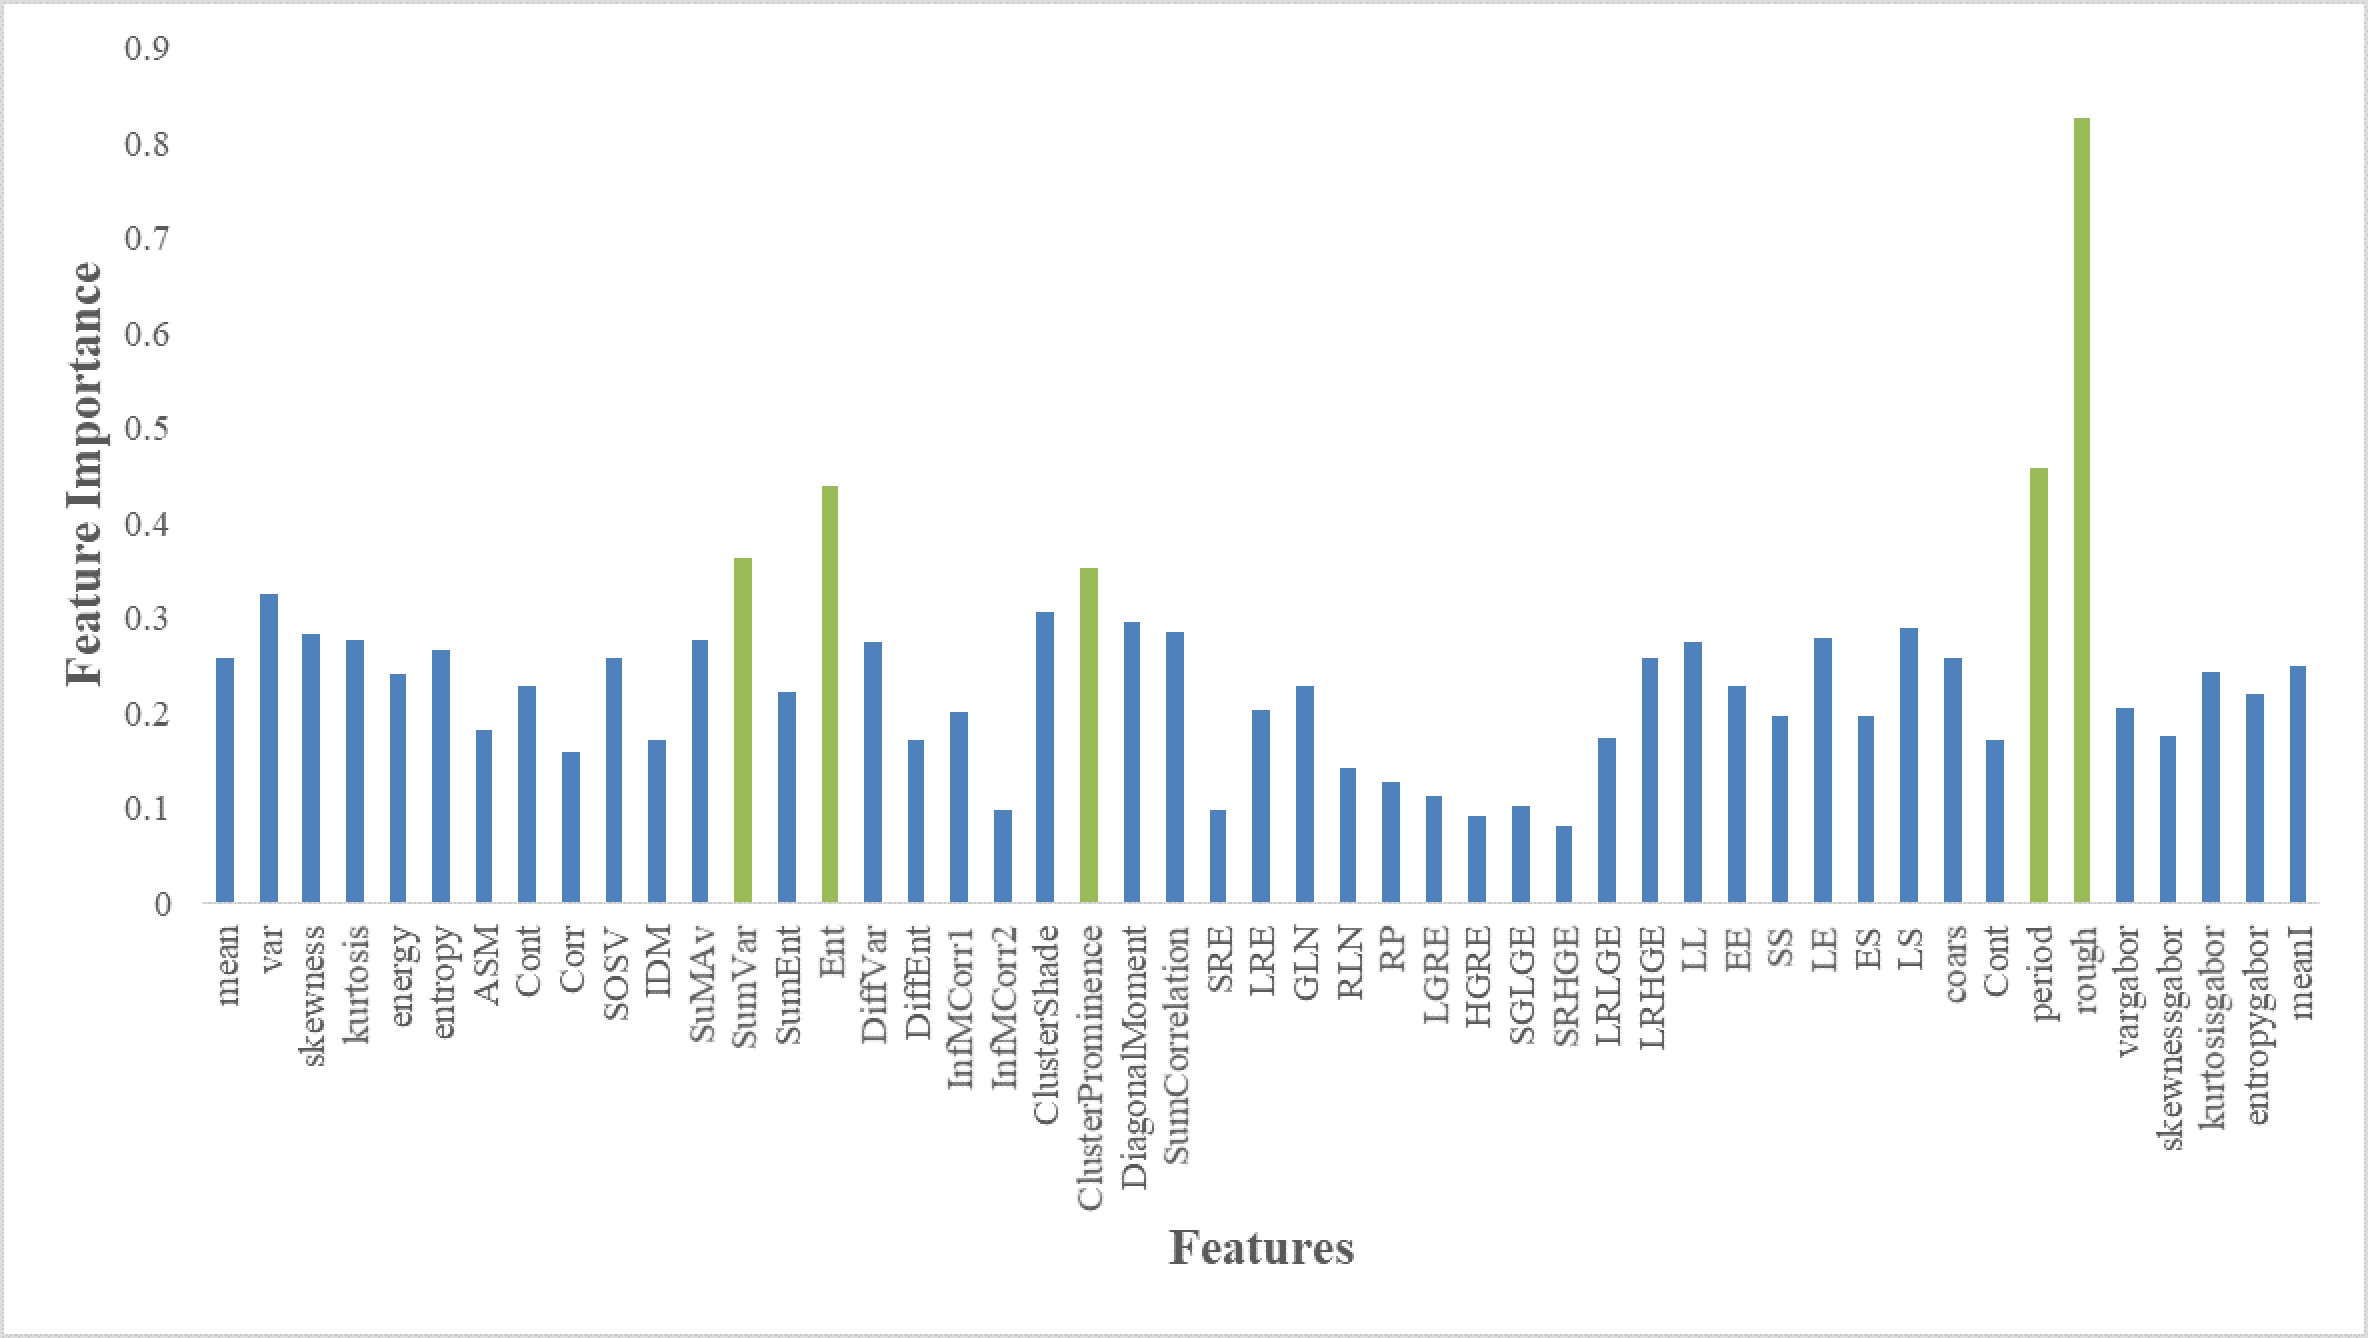
A total of 140 ROI images (healthy=70 and cancerous=70) from 18 subjects were used in this study. Total 49 texture features(f1-f49) such as first-order(histogram)(f1-f6), GLCM(f7-f23), GLRLM(f24-f34), SFM(f35-f38), LTEM(f39-f44), and Gabor(f45-f49) were measured from each image for two classes. All the features were fed into logistic-regression, KNN, and SVM classifier to classify the prostate tissues. The performance of the classification of all texture-features with and without feature-selection using different classifiers is shown in table-2. The accuracy of the classification was 82.90% for logistic-regression, 86.40% for KNN, and 90% for SVM with all texture features, and with optimized features set, the accuracy was 83.60% for logistic-regression, 87.10% for KNN and 92.90% for SVM. The top five optimal features provided by the random forest classifier based on feature importance value were roughness,entropy,periodicity,cluster-prominence, and sum-correlation. Figure-2 shows the optimal features selection process from random-forest.Discussion
This study has investigated the use of 49 features from various texture models (FOS,GLCM,GLRLM, SFM,LTEM, and Gabor-wavelet),feature-selection technique;random-forest, classifiers;logistic-regression, KNN and SVM for healthy and cancerous prostate tissue classification in high b-value(b=1500s/mm2) diffusion images. Majority of automated detection and classification based CAD systems were based on structural T2w MRI5-6 and multiparametric MRI (T2w+DWI+DCE)7-9 with pooled accuracy ~86%(73-89%). Previously, we have performed the prostate gland and zonal segmentation work using DWI, as presented in10. Therefore, the proposed CAD system using DWI fits well in pipeline to make the CAD process time-efficient. The top five optimal-features selected based on feature importance value from random-forest classifiers were roughness, entropy, periodicity, cluster-prominence, and sum-correlation. The classification accuracy was ~93% when feature-selection technique was applied to select the subset of optimal-features. The performance of selected features was evaluated using different classifiers;however SVM showed best accuracy. Based on the experimental results, we conclude that texture features can well characterize prostate tissues into healthy and cancerous. The algorithm can be used on larger dataset for further validation.Conclusion
This work proposed an automated approach to classify prostate tissue into healthy and cancerous using the multiple texture features. The proposed CAD system obtained high classification accuracy of 93%, which might help radiologists for precise and faster diagnosis of PCa. The proposed method can further be extended to classification of prostate tissue based on PI-RADS v2 standard in near future.Acknowledgements
This work is supported by IIT Delhi, India and AIIMS New-Delhi, India. DS was supported with the research fellowship fund from Ministry of Human Resource Development, Government of India.References
1.Weinreb JC, Barentsz JO, Choyke PL, et al. PI-RADS Prostate Imaging-Reporting and Data System: 2015, Version 2. European Urology. 2016; 69(1):16-40.
2.Grant KB, Agarwal HK, Shih JH, et al. Comparison of calculated and acquired high b value diffusion-weighted imaging in prostate cancer. Abdom Imaging 2015; 40(3): 578-586.
3. Castellano G, Bonilha L, Li LM, et al. Texture analysis of medical images. Clinical Radiology. 2004; 59: 1061-1069.
4. Larroza A, Bodí V, Moratal D. Texture analysis in magnetic resonance imaging: review and considerations for future applications. In: Constantinides C, ed. Assessment of cellular and organ function and dysfunction using direct and derived MRI methodologies. Rijeka, Croatia: InTech, 2016.
5. Viswanath SE, Bloch NB, Chappelow JC, Toth R, et al. Central gland and peripheral zone prostate tumors have significantly different quantitative imaging signatures on 3 Tesla endorectal, in vivo T2-weighted MR imagery. J Magn Reson Imaging. 2012; 36: 213-224.
6. Zhao K, Wang CY, Hu J, et al. Prostate cancer identification: quantitative analysis of T2-weighted MR images based on a backpropagation artificial neural network model. Sci China Life Sci, 2015,58: 666-673.
7. Shah V, Turkbey B, Mani H, Pang Y, et al. Decision support system for localizing prostate cancer based on multiparametric magnetic resonance imaging. Med Phys. 2012; 39: 4093-4103.
8. Kwak JT, Xu S, Wood BJ, et al. Automated prostate cancer detection using T2-weighted and high-b-value diffusion-weighted magnetic resonance imaging. Med Phys. 2015; 42:2368-2378.
9. Khalvati F, Wong A, Haider MA. Automated Prostate Cancer Detection via Comprehensive Multi-parametric Magnetic Resonance Imaging Texture Feature Models. BMC Med. Imaging. 2015;15(1):27
10. Singh D, Kumar V, et al. Gland and Zonal Segmentation of Prostate using Diffusion-Weighted MR Imaging, Proc. Intl. Soc. Mag. Reson. Med. 2019; 27.
Figures