2388
Improving the repeatability of radiomic analysis of the prostate through deep normalization of T2w MRI inputs1Polytechnique Montréal, Montréal, QC, Canada, 2Brigham and Women’s Hospital, Boston, MA, United States, 3Harvard Medical School, Boston, MA, United States, 4Centre Hospitalier de l’Université de Montréal, Montréal, QC, Canada
Synopsis
Radiomics analyses are being increasingly employed to investigate tissue heterogeneity present within the prostate gland. We present a method for improving the repeatability of radiomics features extracted from T2-weighted images using a deep normalization technique based on fully convolutional networks (FCNs). We test the repeatability of select radiomics features on a previously published test-retest prostate dataset. We demonstrate that the intraclass correlation coefficient of first-order statistics features extracted from images normalized using the FCN-based pre-processor is consistently higher than for features extracted from non-normalized images.
Introduction
Radiomics analyses of multi-parametric magnetic resonance imaging (mpMRI) of the prostate have the potential to provide useful quantitative information for eliciting details of tissue characterization1. A vast number of radiomics features are available, however, so it is important to select the most relevant and discriminative features possible. Repeatability is one such criterion for performing this selection.The repeatability of a feature refers to the degree to which its value remains stable over multiple image acquisitions on the same subject2. Schwier et al.3 recently published an extensive analysis of the repeatability of radiomics features in mpMRI of the prostate. They found that repeatability was highly sensitive to various pre-processing parameters, including normalization, which was found to reduce the repeatability of radiomics features extracted from T2-weighted (T2w) images.
The aforementioned repeatability study explored two types of normalization: 1) basic normalization in which the intensity values are scaled and shifted to a mean signal value of 300 and a standard deviation of 100 and 2) normalization based on a muscle region of interest (ROI) for which the intensity values were scaled and shifted such that the mean signal value in the ROI was 100 with a standard deviation of 10. Neither of these approaches was shown to consistently improve repeatability.
We perform the same repeatability analysis outlined in Schwier et al.3 using a deep normalization technique developed as part of a previously published pipeline for medical image segmentation4. This pipeline replaces the traditional pre-processing block with a fully convolutional network (FCN) that serves to normalize the data prior to segmentation prediction. In contrast to the results obtained by Schwier et al., we show improved repeatability of radiomics features extracted from T2w images that have undergone this deep normalization.
Methods
Data: The QIN-PROSTATE-Repeatability dataset5,6,7 was obtained from The Cancer Imaging Archive (TCIA)8. The data included test-retest T2w axial images (TR=3350-5109 ms, TE=84-107 ms, FOV=140-200 mm) of fifteen treatment-naïve patients (n=11 biopsy-confirmed and n=4 suspected prostate cancer). The second MRI was performed within two weeks of the baseline examination. ROIs for the whole prostate gland, peripheral zone, and suspected tumor lesion were identified by a radiologist with 10+ years of experience.Pre-processing: Bias field correction was applied to the images using N4 bias correction9 in 3D Slicer10.
Normalization: The combined FCN and FC-ResNet segmentation model was previously trained on T2w images provided by the PROMISE12 challenge11 for segmentation of the entire prostate gland4. Images were normalized using the FCN-based pre-processor. The FCN takes an image of the form (z, x, y, 1) as input. Since the method is a 2D approach, the process is performed slicewise. The output is a processed feature map.
Feature extraction: Radiomics features were extracted from both normalized and non-normalized images using pyradiomics12 (v1.3.0). A subset of texture (Entropy, Energy, Inverse Difference Moment (Idm), Correlation, Contrast) and first-order statistics features (Variance, Skewness, Median, Mean, Kurtosis, 10Percentile) previously shown to perform well in characterizing prostate cancer13,14 was selected for evaluating the effect of normalization. All feature extraction and subsequent data analysis was performed using code made available by the original study3 in order to obtain the most accurate comparison possible.
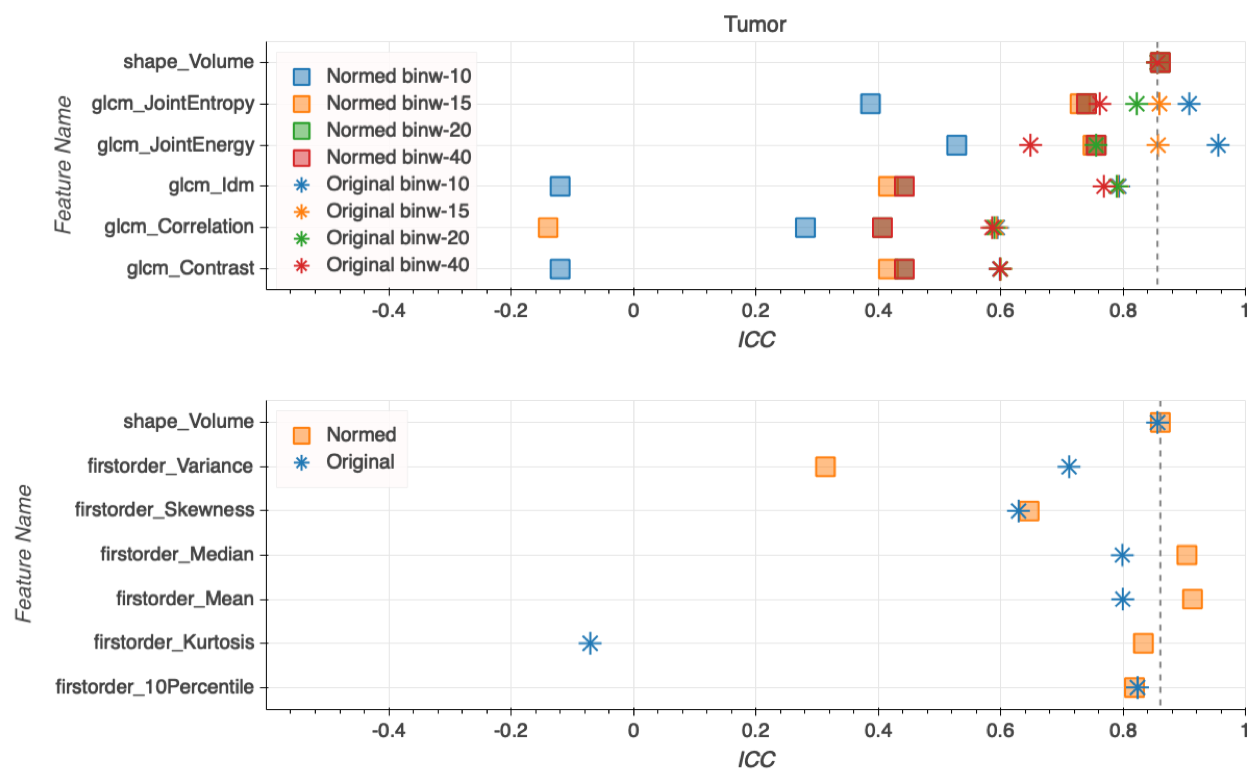
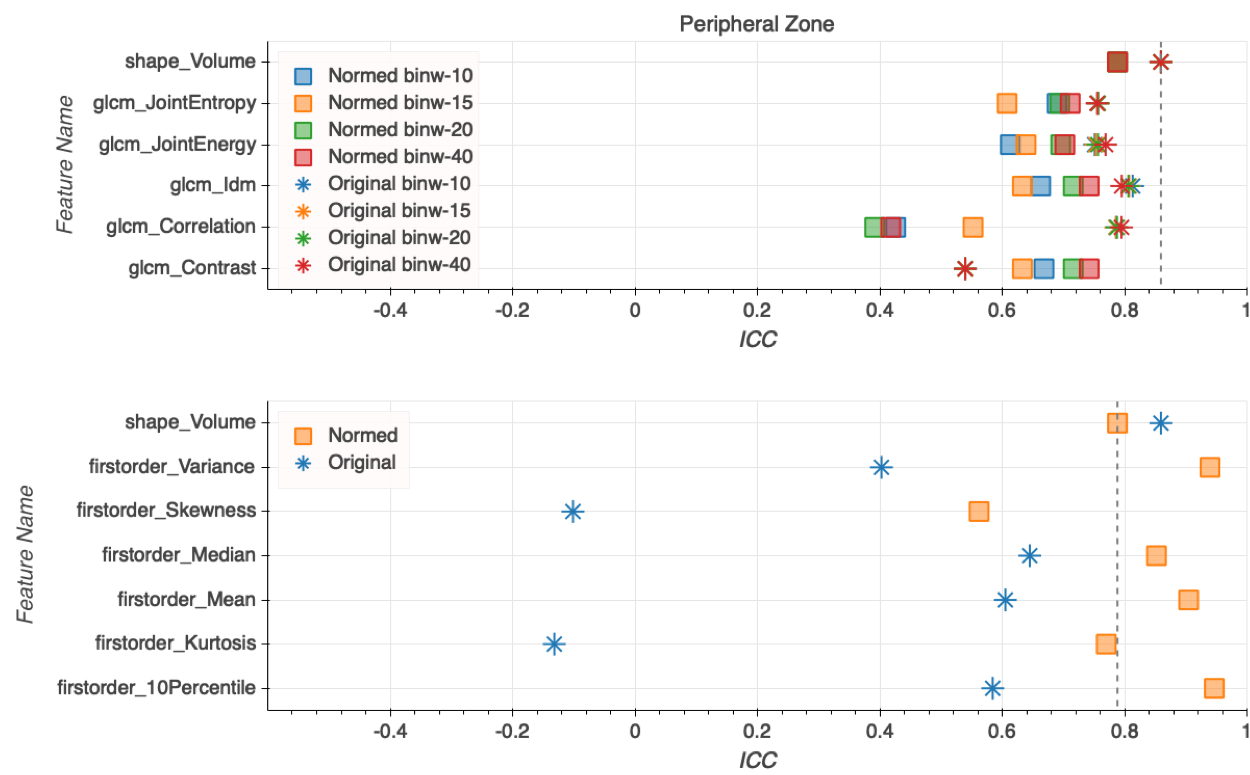
Repeatability assessment: The intraclass correlation coefficient (ICC) was used as a measure of repeatability. This metric evaluates the variability between repeated scans on a single subject with respect to the total variability in the patient population. Volume ICC was used as a reference for comparing ICC values of different radiomics features.
Results
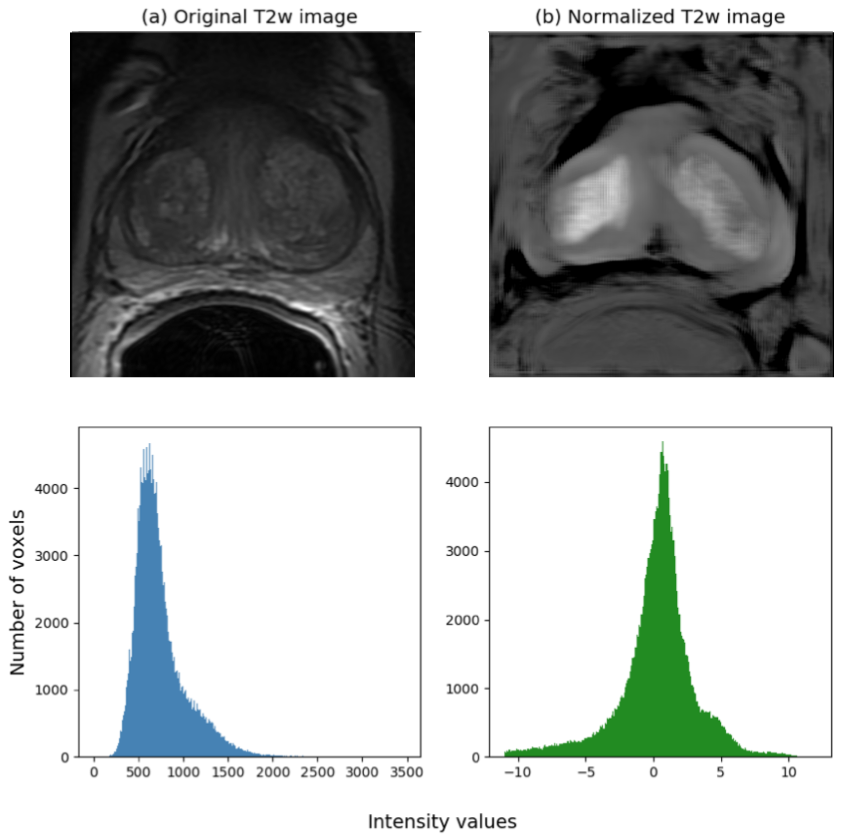
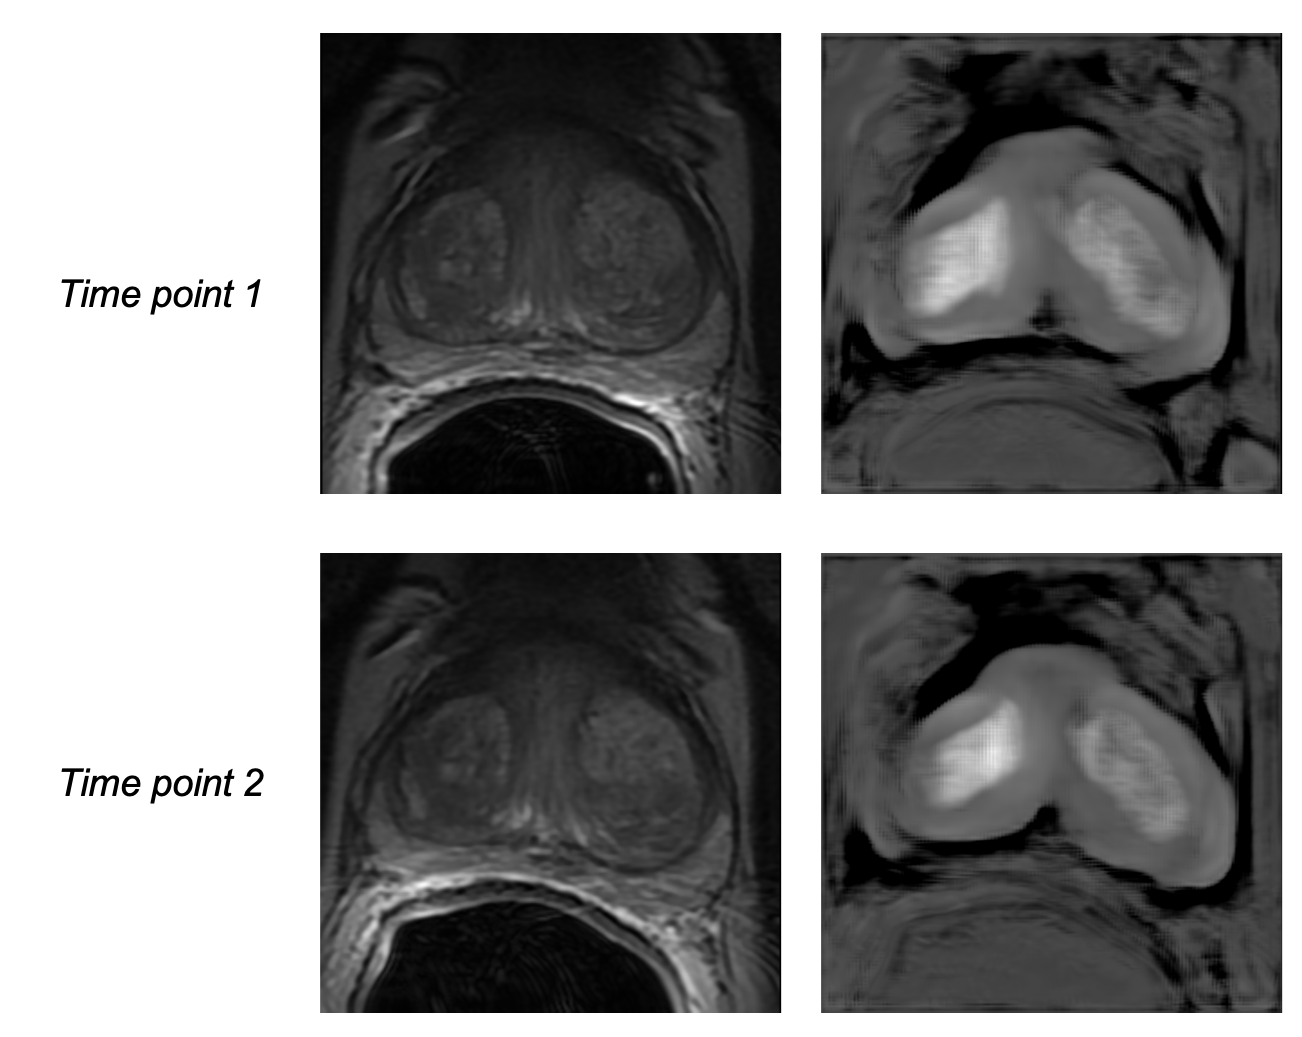
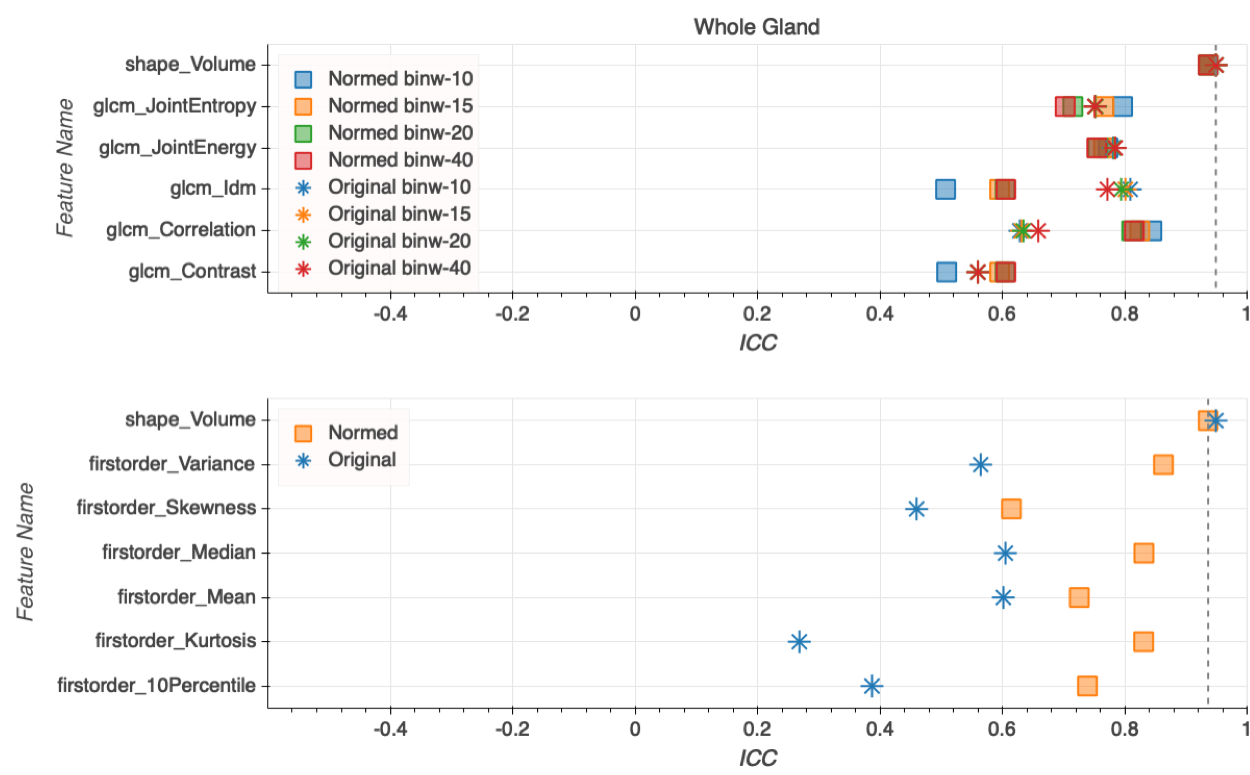
Intensity values within the T2w dataset shifted from [0, 10,558] to [-27, 17] after FCN-based normalization (Fig. 1). This resulted in a much narrower intensity range across the dataset, though the process was accompanied by a notable loss of fine detail present in the original images (Fig. 2). While a slight improvement in ICC values can be found for select texture features in the peripheral zone and whole gland ROIs (Fig. 4-5), there is no definitive increase in the repeatability of texture features in general. There is, however, a clear trend of improvement in first-order feature repeatability with normalization. ICC values for Median and Mean in the tumor ROI exceed that of the reference Volume ICC (Fig. 3). Values for Variance, Median, Mean, and 10Percentile were greater than the reference Volume ICC in the peripheral zone ROI (Fig. 4). While none of the features extracted from the whole gland ROI showed a higher measure of repeatability than the reference Volume ICC, all showed improvement with normalization (Fig. 5).Discussion and Conclusion
We demonstrate the potential of deep normalization for improving the repeatability of first-order statistics features extracted from T2w images. It should be noted, however, that while it is important for a feature to have a high degree of repeatability, this measure alone is not necessarily indicative of predictive power. Although no consistent improvement in repeatability was found for texture features, this is not unexpected as they are not closely related to deep features. Despite these limitations, future work in deep learning techniques that are specifically developed for normalization may be able to achieve a similarly high level of repeatability without compromising the integrity of the quantitative information contained within the images.Acknowledgements
Canadian Institutes of Health Research
Réseau de bio-imagerie du Québec
Natural Sciences and Engineering Research Council of Canada
References
1. Stoyanova, R., Takhar, M., Tschudi, Y., et al. (2016). Prostate cancer radiomics and the promise of radiogenomics. Translational Cancer Research, 5(4), 432–447.
2. Traverso, A., Wee, L., Dekker, A., & Gillies, R. (2018). Repeatability and Reproducibility of Radiomic Features: A Systematic Review. International Journal of Radiation Oncology Biology Physics, 102(4), 1143–1158.
3. Schwier, M., van Griethuysen, J., Vangel, M. G., et al. (2019). Repeatability of Multiparametric Prostate MRI Radiomics Features. Scientific Reports, 9(1), 1–16.
4. Drozdzal, M., Chartrand, G., Vorontsov, E., et al. (2018). Learning normalized inputs for iterative estimation in medical image segmentation. Medical Image Analysis, 44, 1–13.
5. Fedorov, A., Schwier, M., Clunie, D., et al. (2018). Data From QIN-PROSTATE-Repeatability. The Cancer Imaging Archive.
6. Fedorov, A., Vangel, M. G., Tempany, C. M., & Fennessy, F. M. (2017). Multiparametric Magnetic Resonance Imaging of the Prostate: Repeatability of Volume and Apparent Diffusion Coefficient Quantification. Investigative Radiology, 52(9), 538–546.
7. Fedorov, A., Schwier, M., Clunie, D., et al. (2018). Data Descriptor : An annotated test-retest collection of prostate multiparametric MRI. Nature Publishing Group, 5, 1–13.
8. Clark, K., Vendt, B., Smith, K., et al. (2013). The cancer imaging archive (TCIA): Maintaining and operating a public information repository. Journal of Digital Imaging, 26(6), 1045–1057.
9. Tustison, N. J., Avants, B. B., Cook, P. A., et al. (2010). N4ITK: Improved N3 Bias Correction. IEEE Trans Med Imaging, 29(6), 1310–1320.
10. Fedorov, A., Beichel, R., Kalpathy-Cramer, J., et al. (2012). 3D Slicer as an image computing platform for the Quantitative Imaging Network. Magnetic Resonance Imaging, 30(9), 1323–1341.
11. Litjens, G., Toth, R., van de Ven, W., et al. (2014). Evaluation of prostate segmentation algorithms for MRI: The PROMISE12 challenge. Medical Image Analysis, 18(2), 359–373.
12. Van Griethuysen, J. J. M., Fedorov, A., Parmar, C., et al. (2017). Computational radiomics system to decode the radiographic phenotype. Cancer Research, 77(21), e104–e107.
13. Fehr, D., Veeraraghavan, H., Wibmer, A., et al. (2015). Automatic classification of prostate cancer Gleason scores from multiparametric magnetic resonance images. Proceedings of the National Academy of Sciences of the United States of America, 112(46), E6265–E6273.
14. Peng, Y., Jiang, Y., Yang, C., et al. (2013). Quantitative Analysis of Multiparametric Prostate MR Images: Differentiation between Prostate Cancer and Normal Tissue and Correlation with Gleason Score—A Computer-aided Diagnosis Development Study. Radiology.
Figures