2387
The repeatability of deep learning-based segmentation of the prostate on T2-weighted MR images1Department of Circulation and Medical Imaging, NTNU, Norwegian University of Science and Technolog, Trondheim, Norway, 2Department of quantum electronics, Adam Mickiewicz University, Poznań, Poland, 3Department of Radiology and Nuclear Medicine, St. Olavs Hospital, Trondheim University Hospital, Trondheim, Norway
Synopsis
Inter- and intra-observer variability are current limitations of radiological reading of multiparametric MR images of the prostate. Deep learning (DL)-based segmentation has proven to provide good performance, but little is known about the repeatability of these methods. In this work, we investigated the intra-patient repeatability of shape features for DL segmentation methods of the prostate on T2-weighted MR images and compared it to manual segmentations. We found that the repeatability of the investigated methods is excellent for most of the investigated shape features.
Introduction
Inter and intra-observer variability are two of the main limitations of multiparametric MRI radiological reading in prostate cancer.1 For applications based on multiple scans in time, such as active surveillance and response monitoring, good repeatability is paramount. Computer-aided detection and diagnosis (CAD) systems can help by providing standardized and repeatable decisions.2 Fully automated segmentation is an essential step for prostate CAD systems.3 The inter-observer variability of deep learning (DL)-based segmentation methods and expert radiologists was shown to be approximately equal to that of between expert radiologists.4 However, little is known about the (intra-patient, inter-scan) repeatability of DL-based segmentation methods. Therefore, the aim of this work was to investigate the repeatability of shape features extracted from DL-based segmentations of the prostate on T2-weighted MR images.Methods
Datasets:In this study, we used two datasets with transverse T2-weighted MR images:
The PROMISE12 challenge dataset (N=50), which consists of multi-centre and multi-vendor images obtained with different acquisition protocols, field strengths and coils, including reference segmentations.5 This dataset was used to train the DL segmentation methods.
An in-house collected dataset (N=27) of pre-biopsy 3T MR images from 27 patients (median age = 63; range: 47 – 74 years) acquired at two different time points: first, at initial visit for detection of prostate cancer (Scan 1) and second during an MR-guided biopsy procedure (Scan 2). The median interval between scan1 and 2 was 7 days (range: 1 – 71 days). This dataset was obtained from St. Olavs Hospital, Trondheim University Hospital, Norway between March 2015 and April 2016 and its use approved by the Regional Committee for Medical and Health Research Ethics (REC Mid Norway; identifier 2017/576). This dataset was used to investigate the repeatability of shape features extracted from the segmented prostate, as explained below.
Segmentations:
Manual segmentation of the in-house collected dataset was performed by a non-expert reader (SK) using ITK-SNAP.6
DL-based segmentation was performed using two publicly available methods, Mirzaev7 and nnUnet.8 Both of the methods were trained on the PROMISE12 dataset to generate the 3-dimensional prostate volume segmentations for the in-house collected dataset. Model training and validation was performed using Python v3.6 on a single NVIDIA GTX1080Ti GPU. The Mirzaev model was trained for 20 epochs with batch size of 32, whereas the nnUnet model was trained until the learning rate dropped below 10−6 (≈500 epochs) with batch size of 250. In addition, manual adjustment was performed on Mirzaev segmentations, termed Adjusted-Mirzaev. A researcher with three years of experience with prostate imaging (MRS) adjusted, using ITK-SNAP,6 what were judged to be poorly segmented 2-dimensinal slices by visual inspection.
Statistical analysis:
The dice similarity coefficient (DSC; Equation(1)) was calculated as a metric segmentation performance
$$CoV = \frac{2\left | R \cap E \right |}{\left | R \right |+\left | E \right |} \quad (1)$$
$$$\qquad \qquad \qquad \qquad \qquad \qquad \qquad \qquad \qquad \qquad$$$Where R is the reference segmentation and E is the estimated segmentation.9
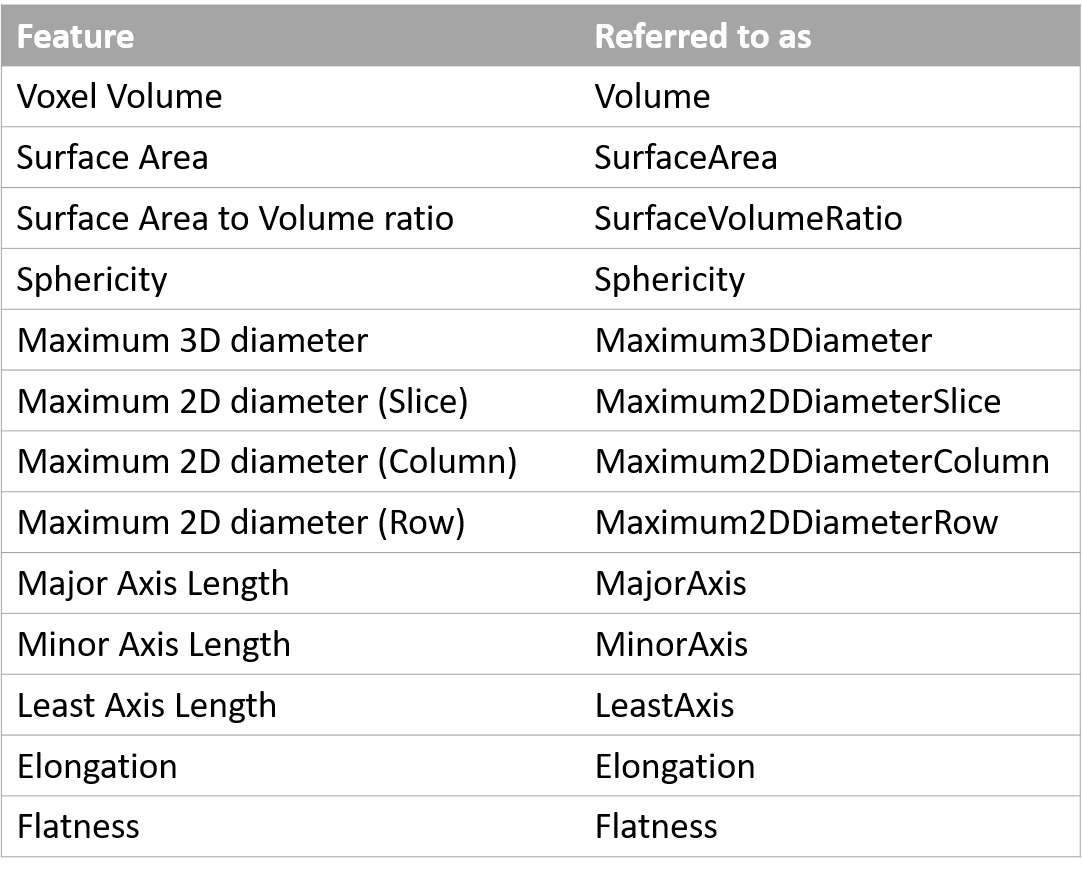
Thirteen (13) shape features (Table 1) were extracted from the 3-dimensional segmented prostate volume, using Pyradiomics.10 The coefficient of variation (CoV; Equation(2)) was used to measure the inter-scan repeatability of each feature and for each patient.
$$CoV = \frac{\sigma (Scan 1, Scan 2)}{\mu (Scan 1, Scan 2)} \quad (2)$$
$$$\qquad \qquad \qquad \qquad \qquad \qquad \qquad \qquad \qquad \qquad$$$Where $$$\sigma$$$ and $$$\mu$$$ are the standard deviation and mean values, respectively.
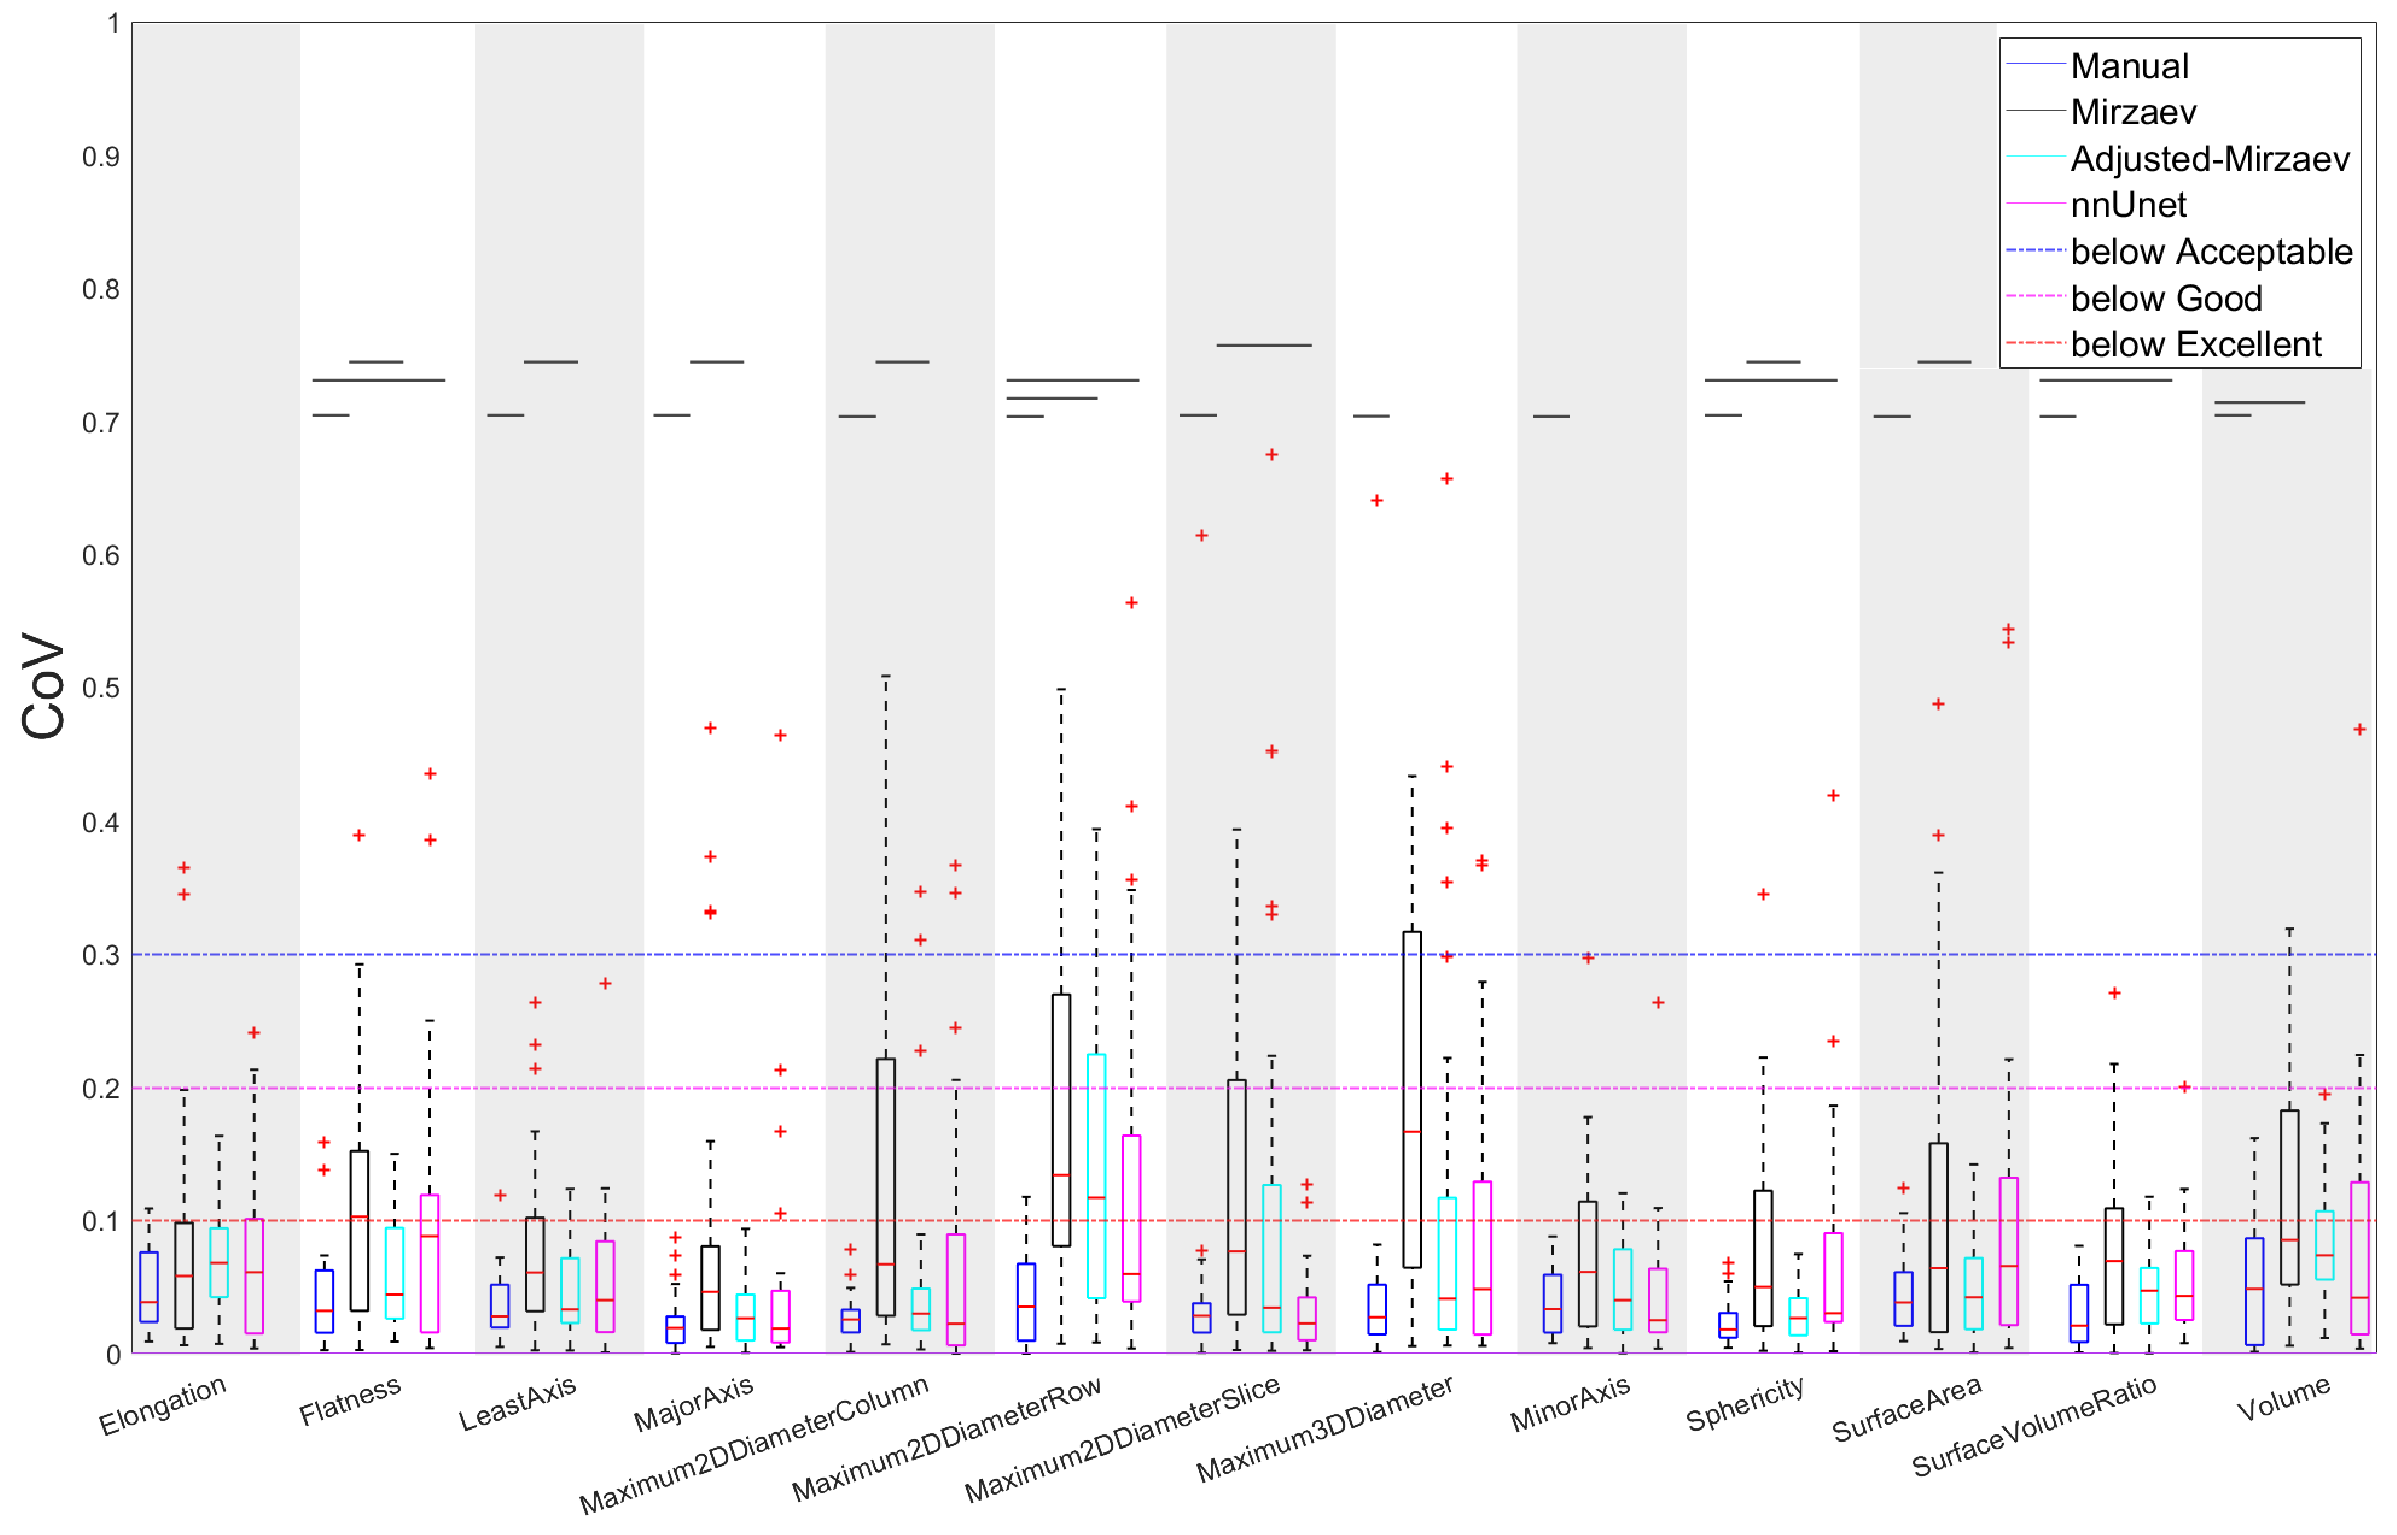
The CoV was considered excellent, good, acceptable and poor when CoV≤0.1, 0.1<CoV≤0.2, 0.2<CoV ≤0.3, and CoV>0.3, respectively.11
Wilcoxon signed rank test12 followed by Benjamini-Hochberg correction for multiple testing13 was used to assess the differences in DSC between scans and CoVs between methods. P-values<0.05 were considered statistically significant. MATLAB R2018b (Mathworks, Natick, MA, USA) was used for statistical analysis.
Results
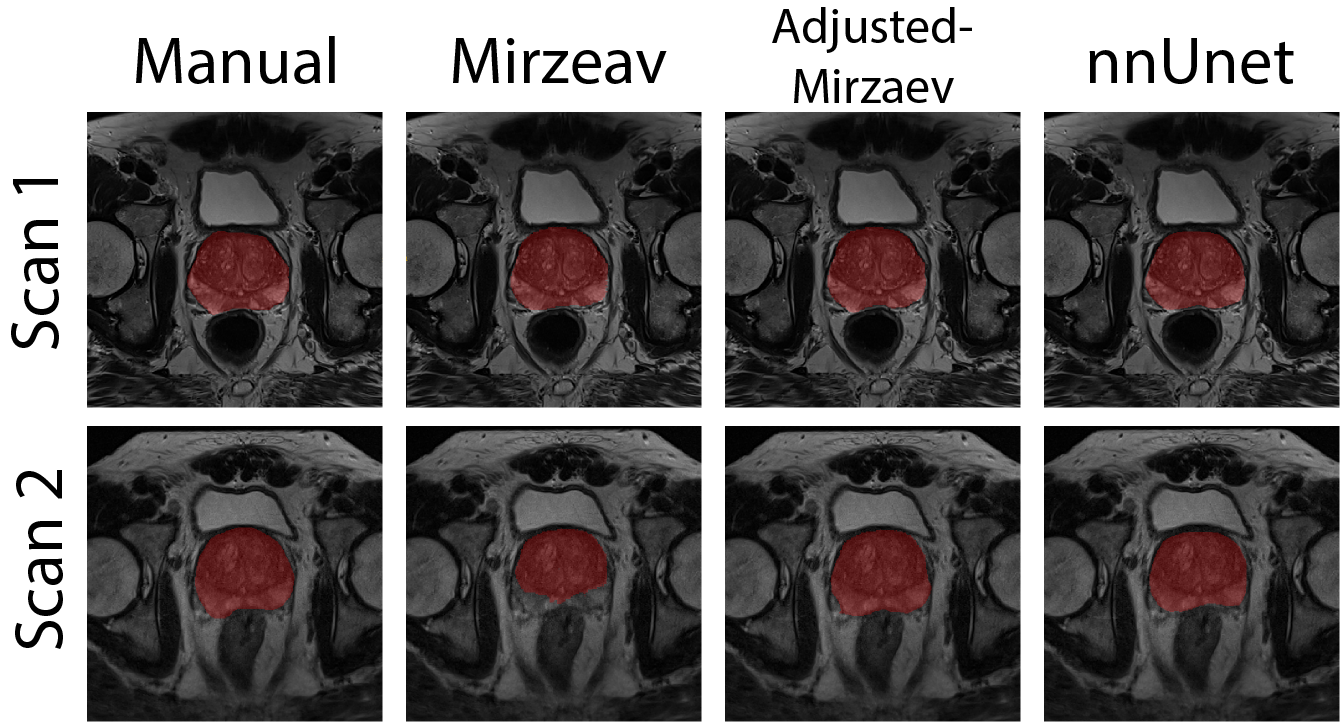
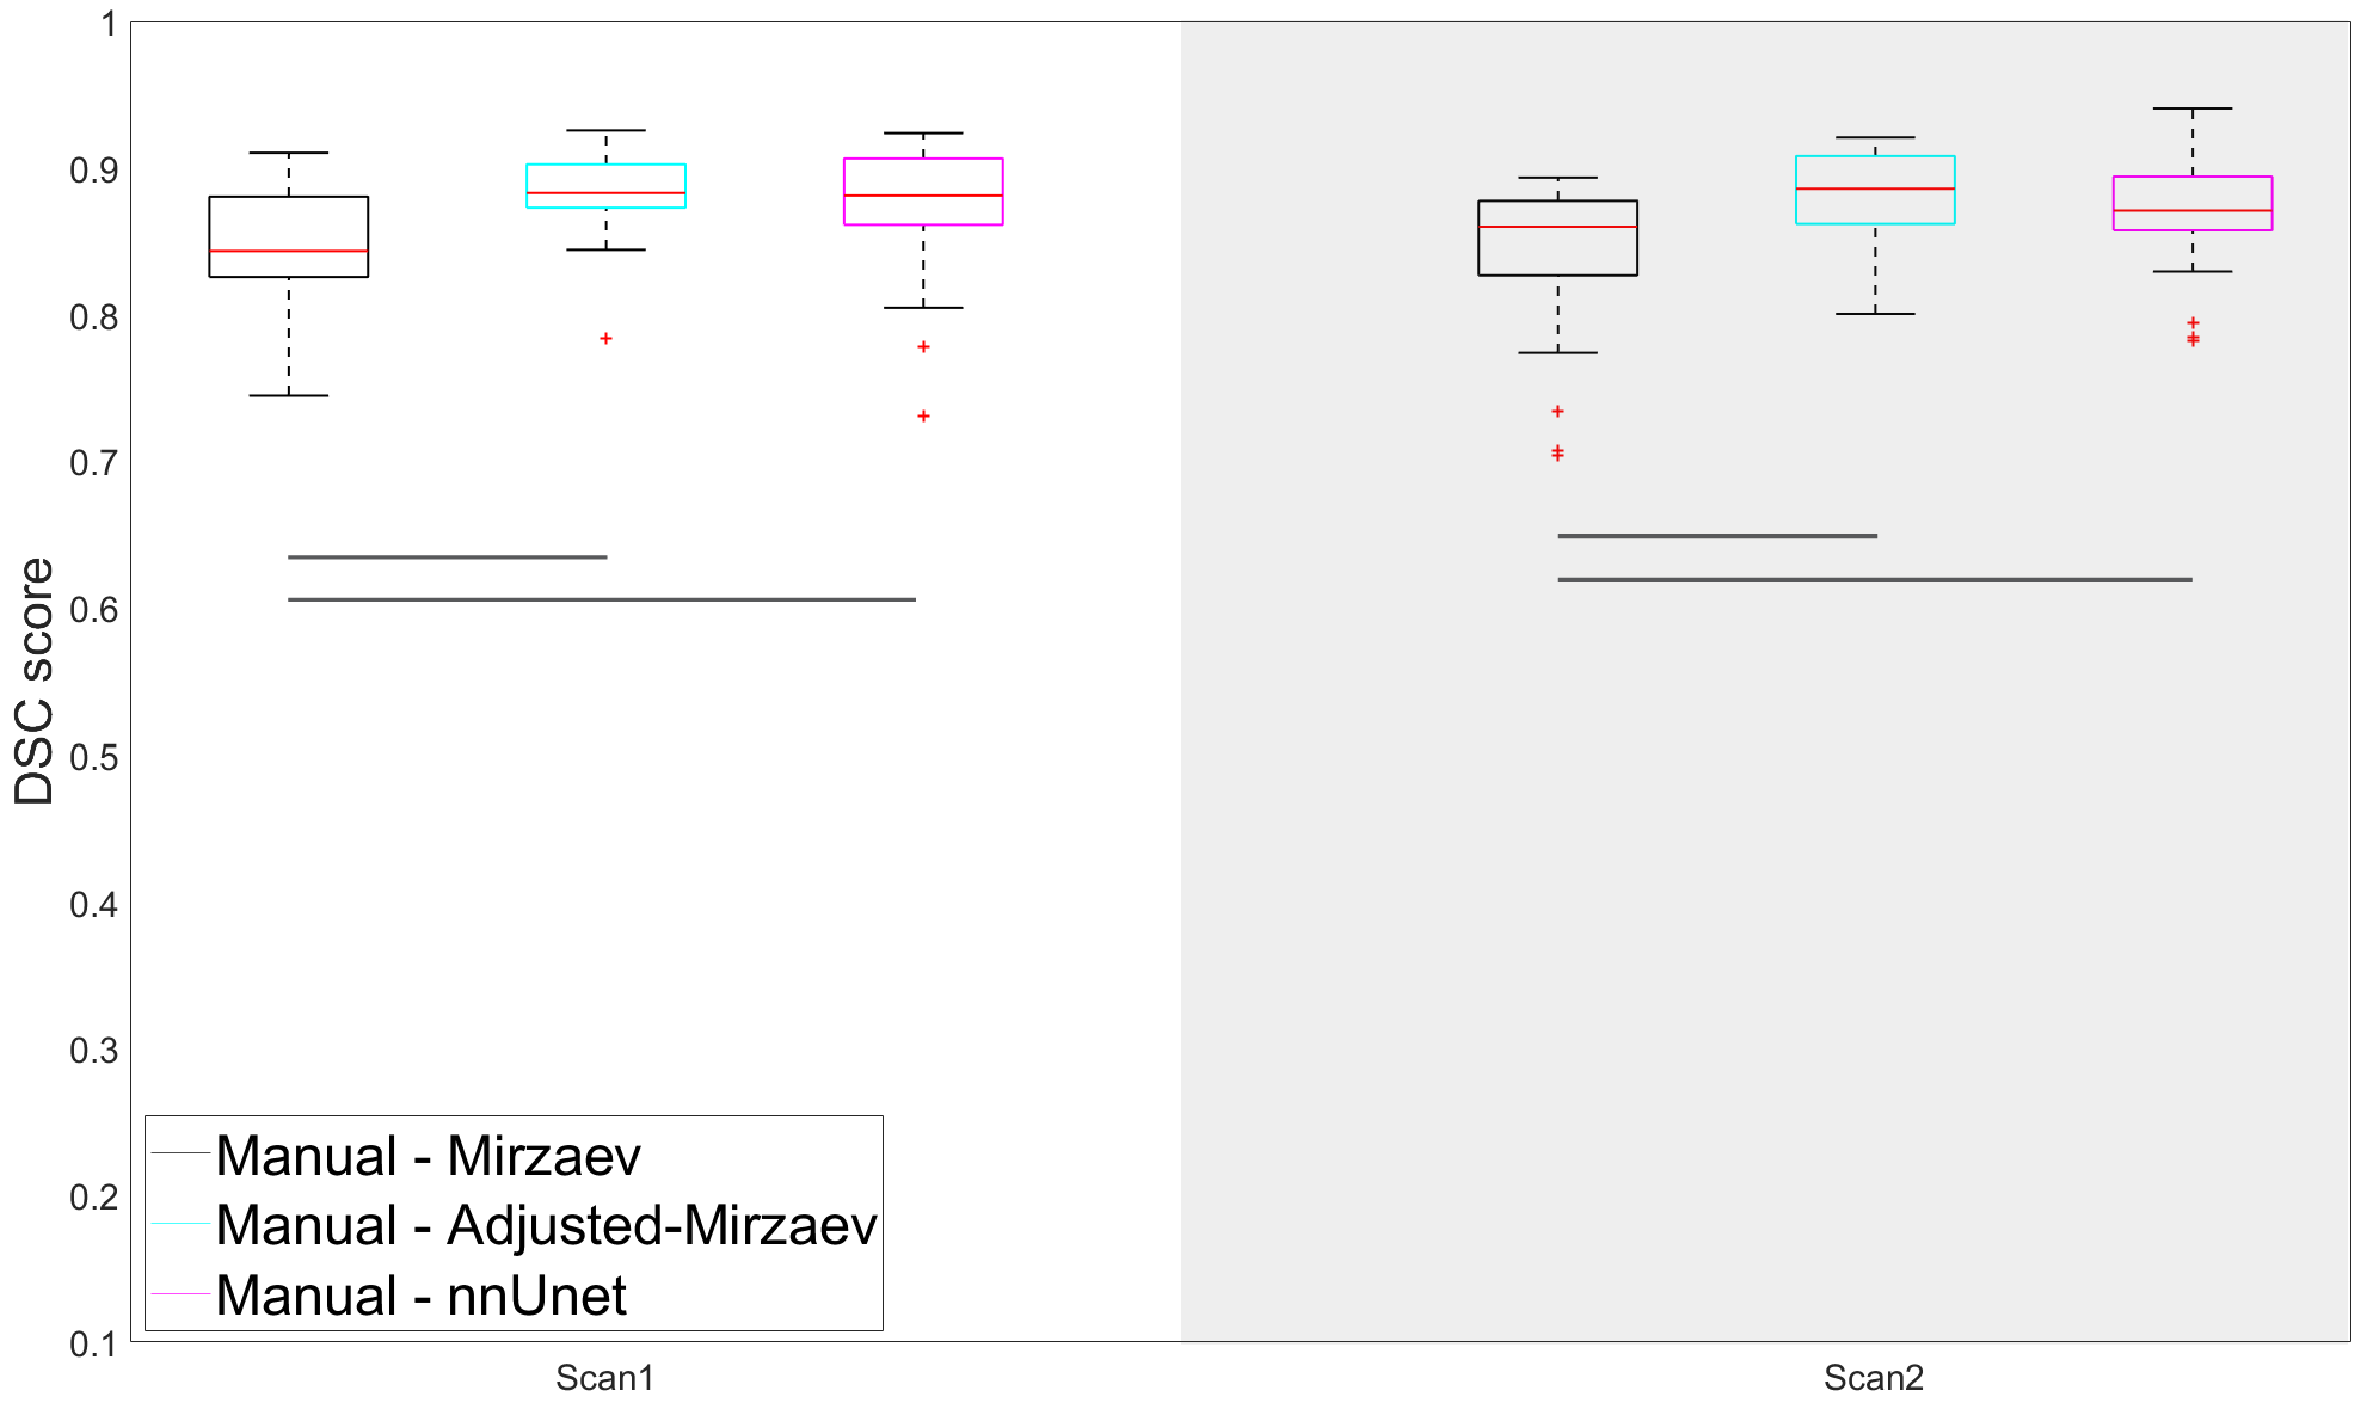
Figure 1 shows an example case segmented with the four investigated methods. Figure 2 represents the performance of the segmentation methods in comparison to manual segmentations. Mirzaev performed significantly lower than the Adjusted-Mirzaev and nnUnet in both of the scans.Figure 3 demonstrates excellent median repeatability for 13/13, 10/13, 12/13 and 13/13 features for Manual, Mirzaev, Adjusted-Mirzaev and nnUnet, respectively. The repeatability was significantly lower than that of manual segmentations for 12/13, 2/13, and 4/13 features for Mirzaev, Adjusted-Mirzaev and nnUnet, respectively.
Discussion
Our results show that nnUnet had the best overall segmentation accuracy and highest repeatability of the investigated fully automatic segmentation methods, comparable to that of manual segmentations. This work extends previous studies showing the excellent performance of nnUnet on a wide variety of medical image segmentation tasks.8 However, none of the DL-based methods was perfect, leading to unacceptable segmentations in some cases. To improve repeatability and quality of automatic segmentations, poorly segmented cases can be detected and adjusted manually. This was applied to the Adjusted-Mirzaev segmentations, resulting in CoVs more in agreement with the manually obtained segmentations. To automate the detection process of poor segmentations, a quality control system as the one we previously proposed,14 can be used.CONCLUSION
The repeatability of the investigated DL-based segmentation methods of the prostate is excellent for most of the investigated shape features.Acknowledgements
No acknowledgement found.References
1. Martin S, Rodrigues G, Patil N, et al. A multiphase validation of atlas-based automatic and semiautomatic segmentation strategies for prostate MRI. Int J Radiat Oncol Biol Phys 2013;85(1):95-100.
2. Hambrock T, Vos PC, Hulsbergen-van de Kaa CA, Barentsz JO, Huisman HJ. Prostate cancer: computer-aided diagnosis with multiparametric 3-T MR imaging--effect on observer performance. Radiology 2013;266(2):521-530.
3. Litjens G, Debats O, Barentsz J, Karssemeijer N, Huisman H. Computer-aided detection of prostate cancer in MRI. IEEE Trans Med Imaging 2014;33(5):1083-1092.
4. Shahedi M, Cool DW, Romagnoli C, et al. Spatially varying accuracy and reproducibility of prostate segmentation in magnetic resonance images using manual and semiautomated methods. Med Phys 2014;41(11):113503.
5. Litjens G, Toth R, van de Ven W, et al. Evaluation of prostate segmentation algorithms for MRI: the PROMISE12 challenge. Med Image Anal 2014;18(2):359-373.
6. Yushkevich PA, Piven J, Hazlett HC, et al. User-guided 3D active contour segmentation of anatomical structures: Significantly improved efficiency and reliability. Neuroimage 2006;31(3):1116-1128.
7. Mirzaev I. Fully convolutional neural network with residual connections for automatic segmentation of prostate structures from MR images. Volume 2018. MICCAI 2012 Grand Challenge: Prostate MR Image Segmentation (PROMISE 2012); 2017. https://promise12.grand-challenge.org/media/evaluation-supplementary/40/9477/d70ba7d1-bc95-439e-a81e-7f1a4ed5fda0/18_MBIOS.pdf (Visited at 26 Oct 2019).
8. Isensee F, Petersen J, Kohl SAA, Jäger PF, Maier-Hein KH. nnU-Net: Breaking the Spell on Successful Medical Image Segmentation. 2019; arXiv:1904.08128.
9. Klein S, van der Heide UA, Lips IM, van Vulpen M, Staring M, Pluim JPW. Automatic segmentation of the prostate in 3D MR images by atlas matching using localized mutual information. Medical Physics 2008;35(4):1407-1417.
10. van Griethuysen JJM, Fedorov A, Parmar C, et al. Computational Radiomics System to Decode the Radiographic Phenotype. Cancer Res 2017;77(21):E104-E107.
11. Kakite S, Dyvorne H, Besa C, et al. Hepatocellular Carcinoma: Short-Term Reproducibility of Apparent Diffusion Coefficient and Intravoxel Incoherent Motion Parameters at 3.0T. J Magn Reson Imaging 2015;41(1):149-156.
12. Gibbons JD, Chakraborti S. Nonparametric statistical inference. Boca Raton: Chapman & Hall/Taylor & Francis: 2011. 630 p. p.
13. Benjamini Y, Hochberg Y. Controlling the False Discovery Rate - a Practical and Powerful Approach to Multiple Testing. J R Stat Soc B 1995;57(1):289-300.
14. Sunoqrot MRS, Selnæs KM, Zvala-Romero O, et al . Proc. Intl. Soc. Mag. Reson. Med. 27 (2019) 1622.
Figures