2386
Advances in 3D High-Speed MR Spectroscopic Imaging for Monitoring Neoadjuvant Chemotherapy in Breast Cancer1Neurology, University of New Mexico, Albuquerque, NM, United States, 2Mind Research Network, Albuquerque, NM, United States, 3Division of Hematology / Oncology, University of New Mexico Comprehensive Cancer Center, Albuquerque, NM, United States
Synopsis
Three patients with biopsy-confirmed, infiltrating ductal carcinoma were studied at 3 Tesla to monitor changes in total Choline during neoadjuvant chemotherapy in comparison with dynamic contrast enhanced MRI. A novel bilateral high-speed 3D Proton-Echo-Planar-Spectroscopic-Imaging (PEPSI) protocol with integrated water reference acquisition mapped decreases in total Choline early during treatment in 2 HER2-negative patients with partial pathologic response, but not in the third HER2-positive patient. Surgical clip related B0-inhomogeneity impacted both PEPSI and DCE-MRI measurements. To address this limitation, we developed a novel expanded k-space encoding approach for PEPSI and demonstrated signal recovery in tissue regions affected by dephasing.
Measuring tCho in breast cancer using single voxel MR spectroscopy (MRS) was reported to improve lesion characterization, thus improving the limited specificity of dynamic contrast enhanced (DCE) MRI1. Studies using single voxel MRS2 and MR spectroscopic imaging (MRSI)3 suggest that the change in tCho concentration between baseline and as early as 24 hours after the first dose of neoadjuvant chemotherapy (NAC) can serve as an indicator for predicting pathological complete response (pCR) to neoadjuvant chemotherapy in locally advanced breast cancer. Long scan times introducing motion sensitivity, overwhelming lipid resonances, and spectral line broadening due to intrinsic and surgical clip related B0 inhomogeneity represent considerable technical challenges. In this study, we develop improved data acquisition tools and protocols to map tCho in the lesion and to assess baseline tCho levels in the contra-lateral breast. We tested a novel high-speed 3D Proton-Echo-Planar-Spectroscopic-Imaging (PEPSI) method that integrates the water reference scan into the water suppression module and performed serial measurements in 3 patients with biopsy confirmed breast cancer to monitor changes in total Choline during neoadjuvant chemotherapy in comparison with dynamic contrast enhanced MRI. In a second step, we developed a novel approach to compensate macroscopic B0-inhomogeneity related signal dephasing in the breast using linearly expanding k-space encoding during the echo-planar readout, taking advantage of the sparsity of the spectral signal in the time domain.
METHODS
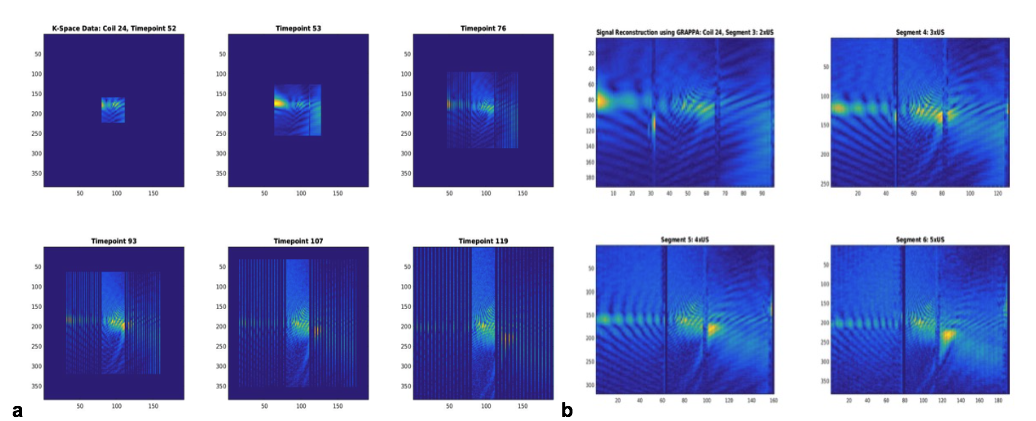
Three patients (age range: 54,43 and years) with biopsy-confirmed, infiltrating ductal carcinoma (IDC) were studied with DCE-MRI and 3D MRSI using a 3T MR scanner (Siemens Trio, Erlangen, Germany) equipped with a 16-channel breast array (Hologic Inc., Bedford, MA). Informed consent was obtained. Measurement were performed at 3 time points: (1) prior to NAC, (2) 20-52 hours after the beginning of the first cycle of NAC, and (3) between the first and second cycle of NAC. 3D PEPSI data with MEGA lipid suppression (TR/TE=2000ms/125ms, matrix size=32×8×8, voxel size=1cc) were acquired from a PRESS pre-localized volume encompassing the lesion and adjacent glandular tissue (10 min) and from a comparably sized volume in glandular tissue in the contra-lateral breast (10 min). Water reference data were acquired within the water suppression module as described previously. Spectral quantification was performed using LCModel-based spectral fitting in reference to tissue water as described previously7. Tumor volume in DCE-MRI was measured using semi-automated tissue segmentation on an Aegis workstation (Hologic Inc., Bedford, MA) based on pixel-wise time course analysis of contrast enhancement. A 3D PEPSI pulse sequence with segmented increases in k-space encoding (Fig.1) to a maximum 6x6 fold expansion in kx and ky was implemented using (a) increasing readout gradient durations at constant ADC readout bandwidth per pixel and (b) interleaved alternating blipped phase encoding gradients with linearly increasing moments to alternatingly encode central fully sampled ky-space and outer expanded and undersampled ky space (Fig.1a). Undersampled data were reconstructed using “OpenGRAPPA”11 (Fig.1b). Spectral reconstruction of nonuniformly sampled data was performed using the expanded Fourier Transform.
RESULTS
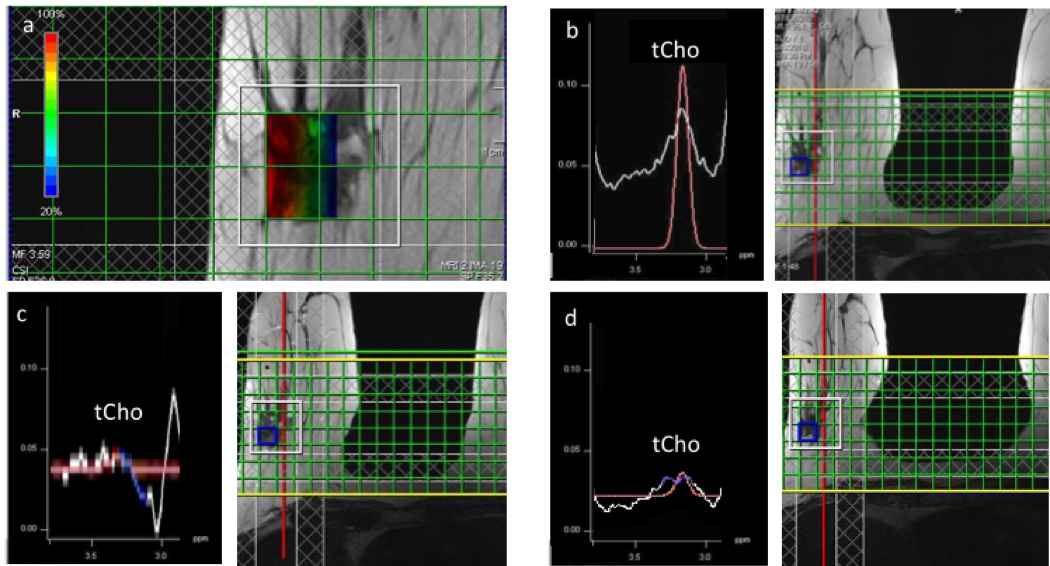
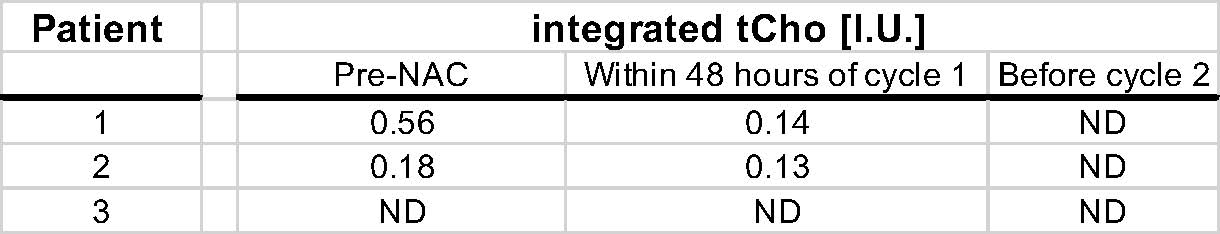
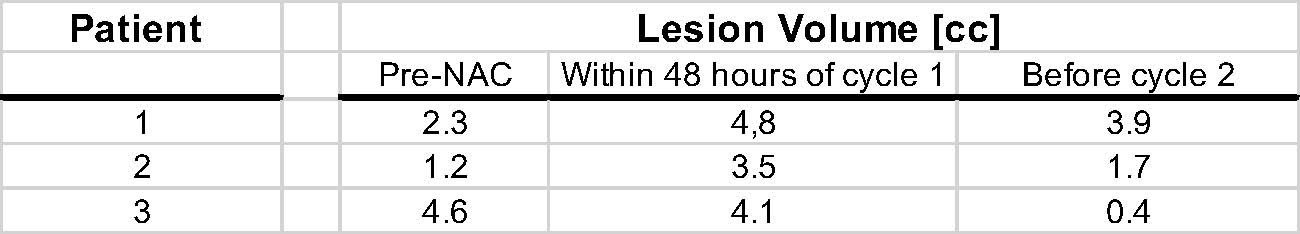
Total Cho maps showed localized enhancement in the center of focal lesions (Fig. 2). In the first two patients with HER2 negative tumor, which were partial responders to NAC, tCho in the lesion decreased 48 hours after initiation of C1 D1 NAC, while DCE-MRI showed an increase in size relative to pre-NAC followed by a decrease at time point 3 (Fig. 2, Table 1). The concentration of tCho in contralateral breast did not change significantly during NAC. Total Cho was not detected in patient 3 with HER2 positive tumor. DCE-MRI in this patient showed only a small decrease in lesion volume at time point 2, followed by a significant reduction at time point 3 (Table 2). PEPSI data with segmented increases in k-space encoding in patient 3 showed considerable signal recovery in the vicinity of the lesion compared with conventional PEPSI encoding (Figure 3).
DISCUSSION
This study in a limited number of patients is inline with our previous study showing that (a) serial quantitative 3D mapping of tCho in patients with HER2 negative lesions can detect early responses to neoadjuvant chemotherapy when DCE-MRI is still unspecific and (b) that [tCho] in patients with HER2 positive lesions is smaller and, in some cases, not detectable compared with HER2 negative lesions. Mapping of [tCho] in contra-lateral breast provides a reference for assessing changes in [tCho] in the lesion. Our findings are in contrast to a recent multi-trial that was unable to predict NAC response based on quantitative tCho measurements, in part due to technical difficulties (Bolan et al 2017) and to a more recent study that reported higher tCho in responders compared to non-responders, but changes in tCho being predictive of pCR only after 6 weeks of NAC (Drisis et al 2018). These and other studies indicate the clinical utility of tCho mapping should be considered differently for different breast cancer subgroups. Our preliminary data using linearly expanding k-space encoding in PEPSI demonstrate compensation of signal dephasing due to magnetic field inhomogeneity. Current efforts are directed at characterizing SNR efficiency and temporal undersampling constraints compared with conventional MRSI, and designing k-space trajectories that are tailored to the local magnetic field gradient vector distribution based on B0 mapping.
Acknowledgements
This study was supported by an EPCRS grant from the UNM Comprehensive Cancer Center. Our sincere thanks to our patients, staff and participating physicians.References
[1] S. Meisamy, et al Radiology, 236, 465, 2005.
[2] S. Meisamy et al. Radiology, 233, 424, 2004.
[3] K. K. Danishad, et al. NMR Biomed, 23, 233, 2010.
[4] H. M. Baek, et al. Ann Oncol, 21, 663, 2010.
[5] H. J. Shin, et al. AJR Am J Roentgenol, 198, W488, 2012.
[6] R. G. Sah, et al. Magn Reson Med, 68, 1039, 2012.
[7] C. Zhao, P., et al. J Magn Reson Imaging, 36, 1113, 2012.
Figures