2383
The impact of aorta contrast enhancement patterns on ultrafast time of arrival measurements when screening for breast cancer with MRI1Cancer Center Amsterdam, Amsterdam University Medical Center, VUmc, Amsterdam, Netherlands
Synopsis
A growing number of MRI screening protocols to detect breast cancer are using ultrafast imaging to improve specificity by distinguishing between malignant and benign for small lesions by their time of arrival (ToA) of contrast relative to the aorta. Sagittal MIP of color intensity projections (CIP) of the middle quarter of the chest were used to display the DISCO ultrafast enhancement patterns of the aorta for 556 scans. While 71% of the scans presented simple aorta enhancement patterns, the remaining 29% were more complex. To ensure accurate ultrafast ToA measurements, the aorta enhancement pattern of each scan should be reviewed.
INTRODUCTION:
While it has been known for 25 years [1], and confirmed many times since [2-12], there has been minimal clinical application of the time of arrival (ToA) of contrast to breast lesions for distinguishing between malignant and benign lesions. Nevertheless, with (1) the growth of MRI screening for breast cancer [13-16], (2) the limited usefulness of morphology when distinguishing between malignant and benign for the small lesions commonly detected with MRI screening for breast cancer [12, 15, 16], (3) the push to shorter MRI protocols to reduce cost of screening for breast cancer [17, 18] and (4) the advent of ultrafast MRI imaging [7-10, 19-25], ToA is being re-examined as a supplemental method to both improve specificity and reduce MRI costs when screening for breast cancer [5, 10]. Most studies have measured the ToA of each lesion relative to the ToA of the aorta [1-4, 6-9, 11] making the enhancement patterns of the aorta of special interest.METHODS:
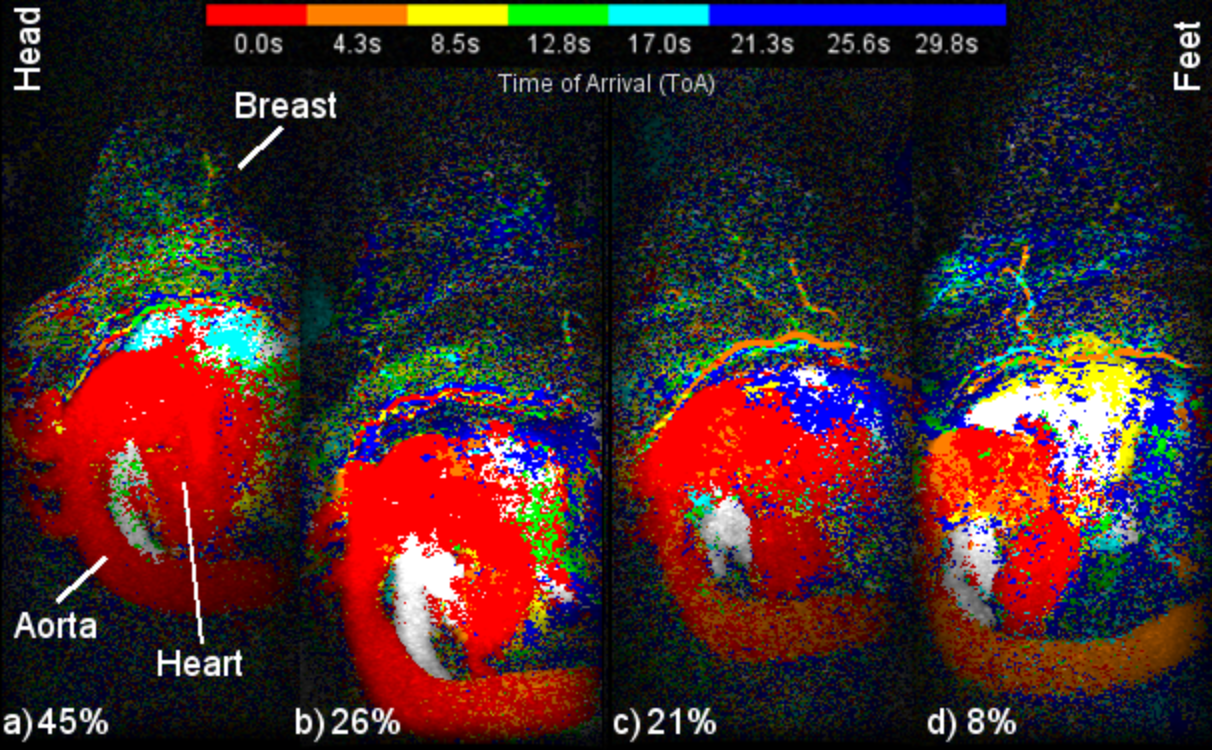
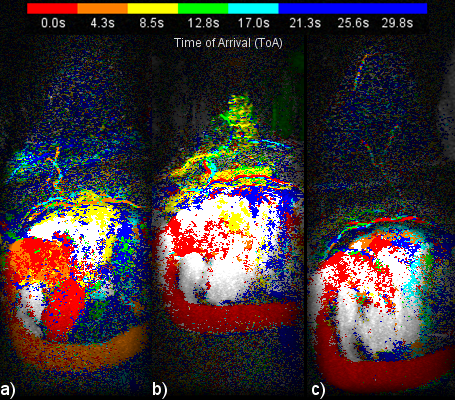
The current study was approved by the medical ethics board of our university hospital. A total of 556 ultrafast breast MRI scans were analyzed. Between January 1, 2016 and March 31, 2018, 651 ultrafast MRIs were acquired of breasts at our hospital. Excluded scans comprised of 41 because of image quality issues probably due to motion artifacts and/or fat-water separation, 33 because the aortic arch was out of the field of view (FOV), 11 because the descending aorta was out of the FOV and 10 because of file problems. As part of the 556 scans, 79 patients received two ultrafast scans about 1 year apart. As reported previously [8], all ultrafast scans were performed on a 3T whole body scanner (Discovery MR750, GE Medical Systems, Milwaukee, WI) with the DISCO sequence. The ultrafast sequence acquired an image volume every 4.26 seconds with voxel size of 0.66mm x 0.66mm x 2.2mm. The enhancement pattern of each aorta was visualized with a sagittal maximum intensity projection (MIP) of the central quarter of the voxels. The MIPs were displayed as color intensity projections (CIP) [8, 26] where the hue (red, orange, yellow, green, cyan, blue) encoded the ToA of the brightest voxel of each MIP pixel. The frame of the ToA for the sagittal image of the aorta was determined by the predominant ToA of the pixels in the aortic arch. The enhancement pattern of each aorta was classified into one of 4 categories: (1) single frame, (2) mostly single frame, (3) mixed frames and (4) uncertain frame. To try and determine if there was a specific cause for the enhancement patterns, correlation between the pattern category and several different parameters was calculated with the two-sided Spearman rank coefficient. Also, for the 79 patients with two ultrafast scans roughly 1 year apart, the two-sided McNemar test was used to test whether a simple enhancement pattern (categories 1 and 2) in a patient made the same enhancement pattern more likely one year later.RESULTS:
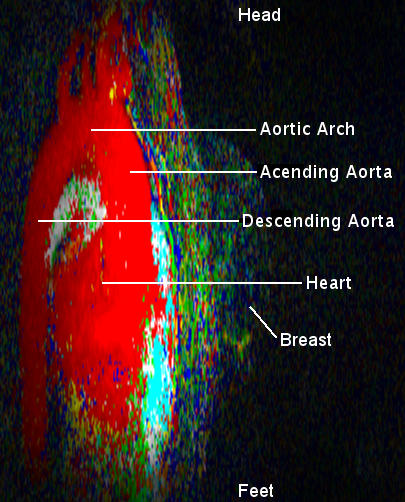
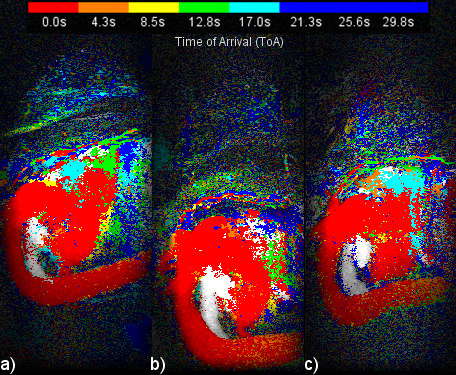
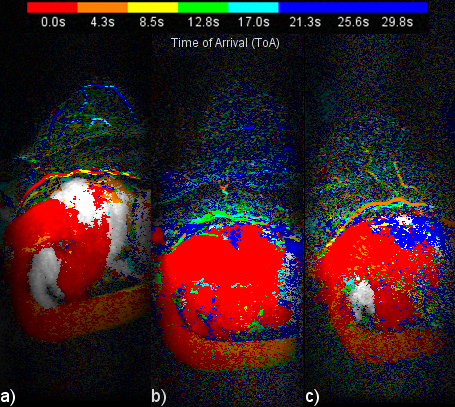
Figure 1 presents a single example of each of the 4 categories along with the percentage of the 556 scans which fell into each category. The percentages were (1) single frame 45%, (2) mostly single frame 26%, (3) mixed frames 21% and (4) uncertain frame 8%. The pixels in the sagittal CIP MIP images in Figure 1 are presented as square rather than the 0.66 x 2.2 mm at which they were acquired. Figure 2 shows image Figure 1(a) in its proper perspective. Figures 3, 4 and 5 show multiple examples of each of categories 2, 3 and 4. The p-values for the Spearman rank tests of the correlation with the 4 categories were p=0.36 for time from injection, p=0.30 for date of scan and p=0.01 for the time of day of the scan. The McNemar test yielded p=0.61.DISCUSSION:
Categories 3 and 4 can cause the aorta ToA to be uncertain by a frame. Closer examination of Figure 4 shows - as most ultrafast studies have measured the ToA relative to the descending aorta as opposed to the current study which used the aortic arch - the ToA for category 3 of the two types of studies would differ by a single frame. Category 4 includes scans were the aortic arch has nearly the same number of pixels from two adjacent frames making the frame determination somewhat arbitrary. A possible solution may be to assign half time frames, instead of integer frames, to the aorta ToA of categories 3 and 4 scans. No clear cause of the variation in the enhancement patterns was determined. While the correlation with the time of day was statistically significant the correlation was quite weak for 556 scans. Additional study with different implementations of ultrafast sequences are needed to see if the enhancement patterns are dependent on the sequence.CONCLUSION:
When screening for breast cancer with protocols that include an ultrafast MRI sequence, the enhancement pattern of the aorta should be taken into account if calculating the ToA of contrast at a lesion. To clearly image each enhancement pattern, each ultrafast acquisition should include in the FOV both the aortic arch and the upper section of the descending aorta.Acknowledgements
The analysis for this study was funded exclusively by the Amsterdam University Medical Center, VUmc while the data acquisition received additional funding from Cancer Center Amsterdam.References
1. Boetes C, Barentsz JO, Mus RD, et al. MR characterization of suspicious breast lesions with a gadolinium-enhanced TurboFLASH subtraction technique. Radiology 1994;193:777–781.
2. Sardanelli F, Rescinito G, Giordano GD, Calabrese M, Parodi RC. MR dynamic enhancement of breast lesions: high temporal resolution during the first-minute versus eight-minute study. J Comput Assist Tomogr 2000;24:724–731. 3. Platel B, Mus R, Welte T, Karssemeijer N, Mann R. Automated characterization of breast lesions imaged with an Ultrafast DCE-MR protocol. IEEE Trans Med Imaging 2014;33:225–232.
4. Mus RD, Borelli C, Bult P, et al. Time to enhancement derived from ultrafast breast MRI as a novel parameter to discriminate benign from malignant breast lesions. Eur J Radiol 2017;89:90–96.
5. Oldrini G, Fedida B, Poujol J, et al. Abbreviated breast magnetic resonance protocol: Value of high-resolution temporal dynamic sequence to improve lesion characterization. Eur J Radiol 2017;95:177–185.
6. Onishi N, Kataoka M, Kanao S, et al. Ultrafast dynamic contrast-enhanced mri of the breast using compressed sensing: breast cancer diagnosis based on separate visualization of breast arteries and veins. J Magn Reson Imaging 2018;47:97–104.
7. van Zelst JCM, Vreemann S, Witt HJ, Gubern-Merida A, Dorrius MD, Duvivier K, Lardenoije-Broker S, Lobbes MBI, Loo C, Veldhuis W, Veltman J, Drieling D, Karssemeijer N, Mann RM. Multireader Study on the Diagnostic Accuracy of Ultrafast Breast Magnetic Resonance Imaging for Breast Cancer Screening. Invest Radiol. 2018;53:579-586.
8. Cover KS, Duvivier KM, de Graaf P, Wittenberg R, Smit R, Kuijer JPA, Hofman MBM, Slotman BJ, Verdaasdonk RM. Summarizing the 4D image stack of ultrafast dynamic contrast enhancement MRI of breast cancer in 3D using color intensity projections. J Magn Reson Imaging. 2019;49:1391-1399.
9. Goto M, Sakai K, Yokota H, Kiba M, Yoshida M, Imai H, Weiland E, Yokota I, Yamada K. Diagnostic performance of initial enhancement analysis using ultra-fast dynamic contrast-enhanced MRI for breast lesions. Eur Radiol. 2019;29:1164-1174.
10. Milon A, Vande Perre S, Poujol J, Trop I, Kermarrec E, Bekhouche A, Thomassin-Naggara I. Abbreviated breast MRI combining FAST protocol and high temporal resolution (HTR) dynamic contrast enhanced (DCE) sequence. Eur J Radiol. 2019;117:199-208.
11. Honda M, Kataoka M, Onishi N, Iima M, Ohashi A, Kanao S, Nickel MD, Toi M, Togashi K. New parameters of ultrafast dynamic contrast-enhanced breast MRI using compressed sensing. J Magn Reson Imaging. 2019. [Epub ahead of print]
12. Onishi N, Sadinski M, Gibbs P, Gallagher KM, Hughes MC, Ko ES, Dashevsky BZ, Shanbhag DD, Fung MM, Hunt TM, Martinez DF, Shukla-Dave A, Morris EA, Sutton EJ. Differentiation between subcentimeter carcinomas and benign lesions using kinetic parameters derived from ultrafast dynamic contrast-enhanced breast MRI. Eur Radiol. 2019. [Epub ahead of print]
13. Emaus MJ, Bakker MF, Peeters PH, et al. MR imaging as an additional screening modality for the detection of breast cancer in women aged 50-75 years with extremely dense breasts: The DENSE Trial Study.Design Radiol 2015;277:527–537.
14. Kuhl CK. Abbreviated breast MRI for screening women with dense breast: the EA1141 trial. Br J Radiol. 2018;91(1090):20170441.
15. Saadatmand S, Geuzinge HA, Rutgers EJT, Mann RM, de Roy van Zuidewijn DBW, Zonderland HM, Tollenaar RAEM, Lobbes MBI, Ausems MGEM, van 't Riet M, Hooning MJ, Mares-Engelberts I, Luiten EJT, Heijnsdijk EAM, Verhoef C, Karssemeijer N, Oosterwijk JC, Obdeijn IM, de Koning HJ, Tilanus-Linthorst MMA; FaMRIsc study group. MRI versus mammography for breast cancer screening in women with familial risk (FaMRIsc): a multicentre, randomised, controlled trial. Lancet Oncol. 2019;20:1136-1147.
16. Bakker MR, Lange S, Pijnappel RM, Mann RM, Loo C, Bisschops B, Lobbes M, De Jong MDF, Duvivier KM, Veltman J, Veldhuis WB, van Gils C, DENSE trial study group. Additional MRI screening in women with extremely dense breasts: primary outcome of the first round of the randomized DENSE trial. In: Proceeding of the European Congress of Radiology, Vienna, 2019.
17. Fischer U, Korthauer A, Baum F, Luftner-Nagel S, Heyden D, MartenEngelke K. Short first-pass MRI of the breast. Acta Radiol 2012;53: 267–269.
18. Kuhl CK, Schrading S, Strobel K, Schild HH, Hilgers RD, Bieling HB. Abbreviated breast magnetic resonance imaging (MRI): first postcontrast subtracted images and maximum-intensity projection-a novel approach to breast cancer screening with MRI.J Clin Oncol. 2014;32:2304-10.
19. Le Y, Kroeker R, Kipfer HD, Lin C. Development and evaluation of TWIST Dixon for dynamic contrast-enhanced (DCE) MRI with improved acquisition efficiency and fat suppression. J Magn Reson Imaging 2012;36: 483–491.
20. Saranathan M, Rettmann DW, Hargreaves BA, Clarke SE, Vasanawala SS. DIfferential Subsampling with Cartesian Ordering (DISCO): a high spatio-temporal resolution Dixon imaging sequence for multiphasic contrast enhanced abdominal imaging. J Magn Reson Imaging 2012;35: 1484–1492.
21. Mann RM, Mus RD, van Zelst J, Geppert C, Karssemeijer N, Platel B. A novel approach to contrast enhanced breast magnetic resonance imaging for screening high-resolution Ultrafast dynamic imaging. Invest Radiol 2014;49:579–585.
22. Pineda FD, Medved M, Wang S, et al. Ultrafast bilateral DCE-MRI of the breast with conventional Fourier sampling: preliminary evaluation of semi-quantitative analysis. Acad Radiol 2016;23:1137–1144.
23. AbeH2016. Abe H, Mori N, Tsuchiya K, et al. Kinetic analysis of benign and malignant breast lesions with ultrafast dynamic contrast-enhanced MRI: Comparison with standard kinetic assessment. AJR Am J Roentgenol 2016; 207:1159–1166.
24. Mori N, Abe H, Mugikura S, Takasawa C, Sato S, Miyashita M, Mori Y, Pineda FD, Karczmar GS, Tamura H, Takahashi S, Takase K. Ultrafast Dynamic Contrast-Enhanced Breast MRI: Kinetic Curve Assessment Using Empirical Mathematical Model Validated with Histological Microvessel Density. Acad Radiol. 2019 Jul;26:e141-e149.
25. Wu C, Pineda F, Hormuth DA 2nd, Karczmar GS, Yankeelov TE. Quantitative analysis of vascular properties derived from ultrafast DCE-MRI to discriminate malignant and benign breast tumors. Magn Reson Med. 2019 Mar;81(3):2147-2160.
26. Cover KS, Lagerwaard FJ, van den Berg R, Buis DR, Slotman BJ. Color intensity projection of digitally subtracted angiography for the visualization of brain arteriovenous malformations. Neurosurgery 2007;60: 511–515.
Figures