2382
Impact of MRI protocol compliance on the prediction of pCR in the I-SPY 2 neoadjuvant breast cancer trial
Natsuko Onishi1, Li Wen1, Jessica Gibbs1, Ella F. Jones1, Lisa J. Wilmes1, Alex Nguyen1, Vignesh Arasu1, Bonnie N. Joe1, Laura J. Esserman2, The I-SPY 2 Investigator Network3, David C. Newitt1, and Nola M. Hylton1
1Department of Radiology & Biomedical Imaging, University of California, San Francisco, San Francisco, CA, United States, 2Department of Surgery, University of California, San Francisco, San Francisco, CA, United States, 3Quantum Leap Healthcare Collaborative, San Francisco, CA, United States
1Department of Radiology & Biomedical Imaging, University of California, San Francisco, San Francisco, CA, United States, 2Department of Surgery, University of California, San Francisco, San Francisco, CA, United States, 3Quantum Leap Healthcare Collaborative, San Francisco, CA, United States
Synopsis
In the I-SPY2 breast cancer trial, functional tumor volume (FTV, a quantitative measure of tumor burden derived from dynamic contrast-enhanced MRI) serves as a marker used for patient randomization and estimation of predictive probabilities for pathologic complete response (pCR). This retrospective study investigated the impact of MRI protocol compliance on prediction of pCR using FTV at four time points during neoadjuvant chemotherapy. FTV with compliant image quality factors tended to show higher AUC than that with non-compliant factors. This tendency was most prominent in percent change of FTV from baseline at early-treatment (3 weeks after treatment initiation) and inter-regimen.
Introduction
Functional tumor volume (FTV) is a quantitative measure of tumor burden derived from dynamic contrast-enhanced (DCE) breast MRI1, 2. It is used to adjust patient randomization and estimate predictive probabilities for pathologic complete response (pCR) in the I-SPY 2 breast cancer trial. This multicenter clinical trial includes a total of 25 participating sites and more than 1500 patients randomized to treatment over nine years. Patients have four MRIs during the course of neoadjuvant chemotherapy (NAC). While there is a standardized MRI protocol distributed to sites (Figure 1) and while sites are instructed to use the same scan parameters for all of one patient’s exams, protocol compliance across multiple MR vendors, site locations, and across patient visits is challenging. This retrospective study aimed to investigate the impact of MRI protocol compliance on the prediction of pCR using FTV.Methods
A cohort of locally advanced breast cancer patients enrolled in the I-SPY 2 trial (n=990) was included. Patients underwent DCE-MRI exams at four treatment time points during NAC (Figure 2): pre-treatment (T0), early-treatment (T1, 3 weeks after treatment initiation), inter-regimen (T2), and pre-surgery (T3, after the completion of treatment). Using Hologic Aegis software, FTV was calculated by summing all voxels with early percent enhancement (PE, ~150 s post contrast injection) above 70% and signal enhancement ratio (SER) above zero within a manually delineated 3-dimenional region of interest (Figure 3). We defined FTV at T0, T1, T2 and T3 as FTV0, FTV1, FTV2 and FTV3. Percent change of FTV from baseline (T0, pre-treatment) at T1, T2 and T3 was defined as %∆FTV0_1, %∆FTV0_2 and %∆FTV0_3.In this study, each DCE MRI parameter was defined as compliant if it fulfilled the following protocol specified criteria (Figure 1): acquisition duration 80–100 s; early phase timing 120–150 s post contrast injection; FOV 260–360 mm; in-plane resolution ≤1.4 mm; slice thickness ≤2.5 mm. Since there are sometimes differences in parameters across a single patient’s visits, allowable ranges for variability were defined. A parameter was defined as compliant if it fulfills the above criteria and the absolute value of the change from T0 was within the following range; acquisition duration ≤3 s change; early phase timing ≤5 s change; FOV ≤50 mm change; in-plane resolution ≤10% change; slice thickness ≤10% change. Absence of, or minimal, imaging issues including patient motion, contrast injection issues, and visually detected issues (e.g. fat-suppression, artefacts etc.) were also defined as compliant. Based on each image quality factor (DCE parameter and imaging issue) of MRI at each treatment time point, FTV0, %∆FTV0_1, %∆FTV0_2 and %∆FTV0_3 were stratified as compliant or non-compliant.
The area under the ROC curve (AUC) was used to evaluate the predictive performance of pCR. Regarding each image quality factor, AUCs were calculated for each compliant or non-compliant FTV0, %∆FTV0_1, %∆FTV0_2 and %∆FTV0_3.
Results
FTV with compliant image quality factor tended to show higher AUC value than that with non-compliant image quality factor (Figure 4). This tendency was prominent especially in %∆FTV0_1 and %∆FTV0_2 (percent change of FTV from baseline at early-treatment [T1] and inter-regimen [T2]). The %∆FTV0_1 and %∆FTV0_2 that were compliant with every image quality factor (“All factors combined”) showed higher AUC values than those that were non-compliant (AUC 0.71 vs. 0.65, 0.72 vs. 0.68, respectively; Figure 5).Discussion
In the neoadjuvant setting, the success of personalized treatment of breast cancer requires a reliable prediction of treatment response as early as possible during NAC, because it has a potential impact on treatment strategy (e.g. change of drugs, treatment methods etc.). Data at T1 and T2 (%∆FTV0_1 and %∆FTV0_2) showed that MRI protocol compliance has an impact on the prediction of pCR and possibly on treatment strategy. These analyses are continuing and will be used to refine quantitative imaging requirements in the ongoing I-SPY 2 trial.Conclusion
In this study, we demonstrated the importance of MRI protocol compliance and its impact on the prediction of treatment response in a neoadjuvant breast cancer treatment trial.Acknowledgements
This work was supported by NIH U01 CA225427 and NIH R01 CA132870.References
- Hylton NM, Blume JD, Bernreuter WK, et al: Locally advanced breast cancer: MR imaging for prediction of response to neoadjuvant chemotherapy--results from ACRIN 6657/I-SPY TRIAL. Radiology 263:663–672, 2012
- Hylton NM, Gatsonis CA, Rosen MA, et al: Neoadjuvant Chemotherapy for Breast Cancer: Functional Tumor Volume by MR Imaging Predicts Recurrence-free Survival-Results from the ACRIN 6657/CALGB 150007 I-SPY 1 TRIAL. Radiology 279:44–55, 2016
Figures

Figure 1: Dynamic
contrast-enhanced MRI protocol in I-SPY 2
trial (excerpts)
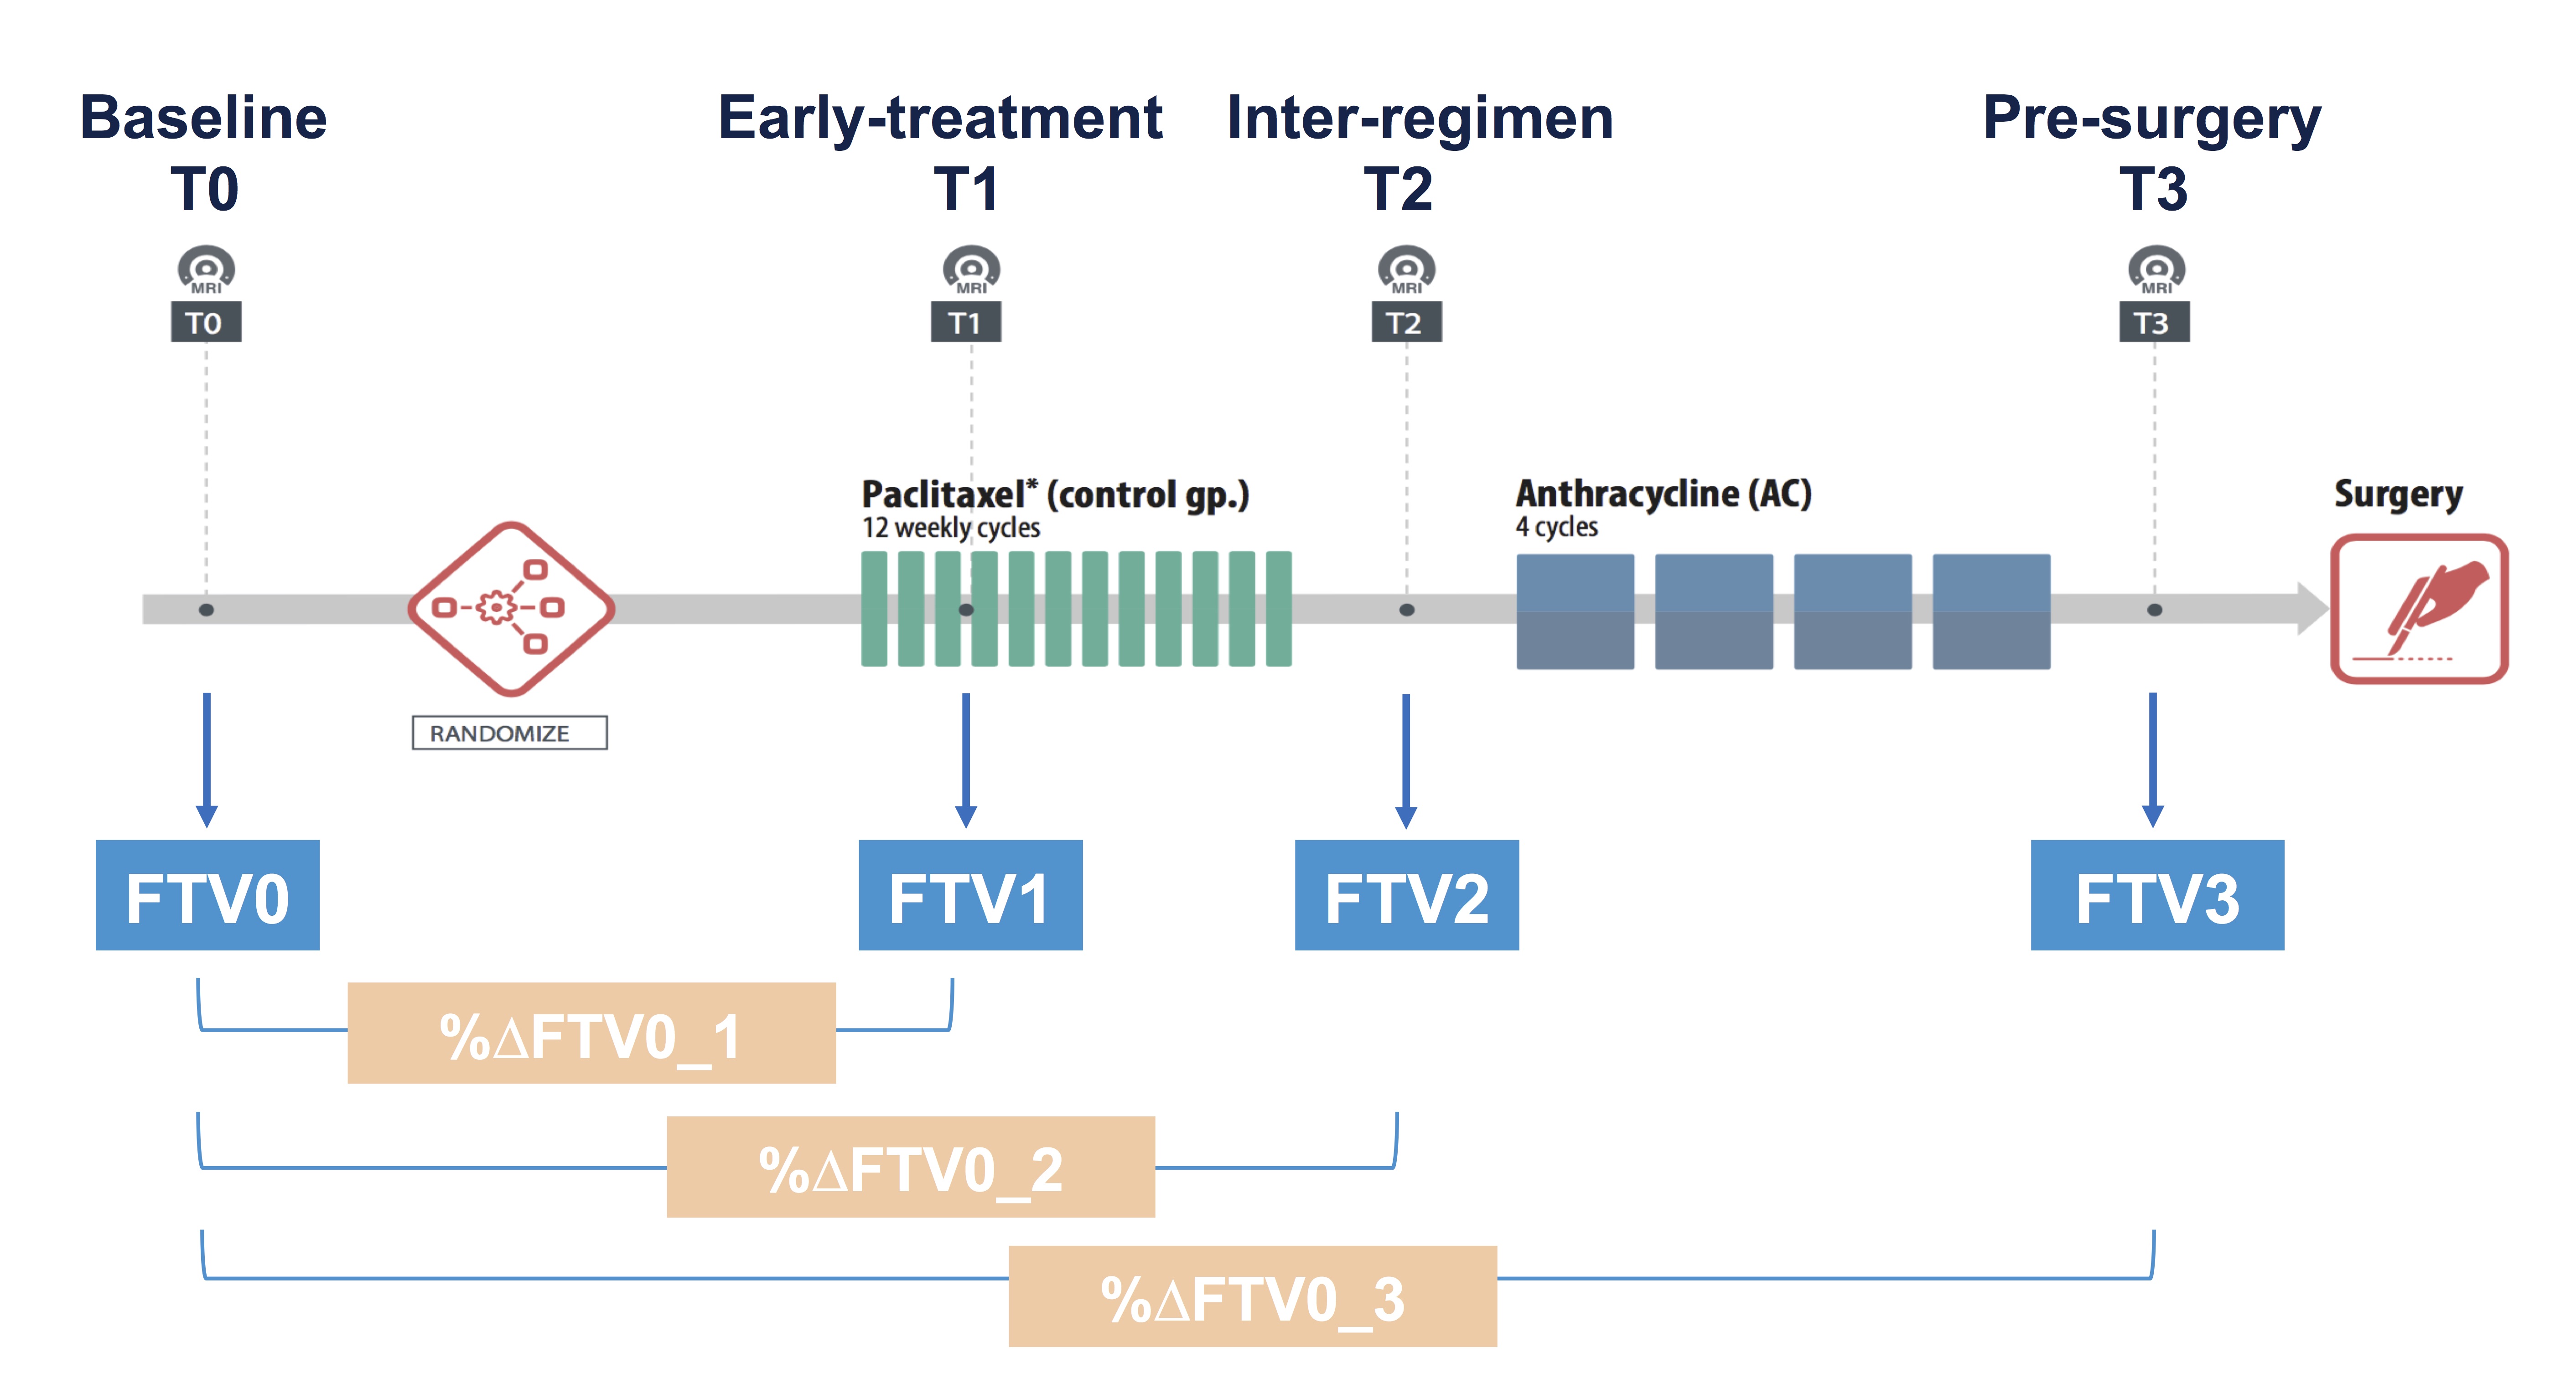
Figure 2: I-SPY 2 clinical trial study
schema
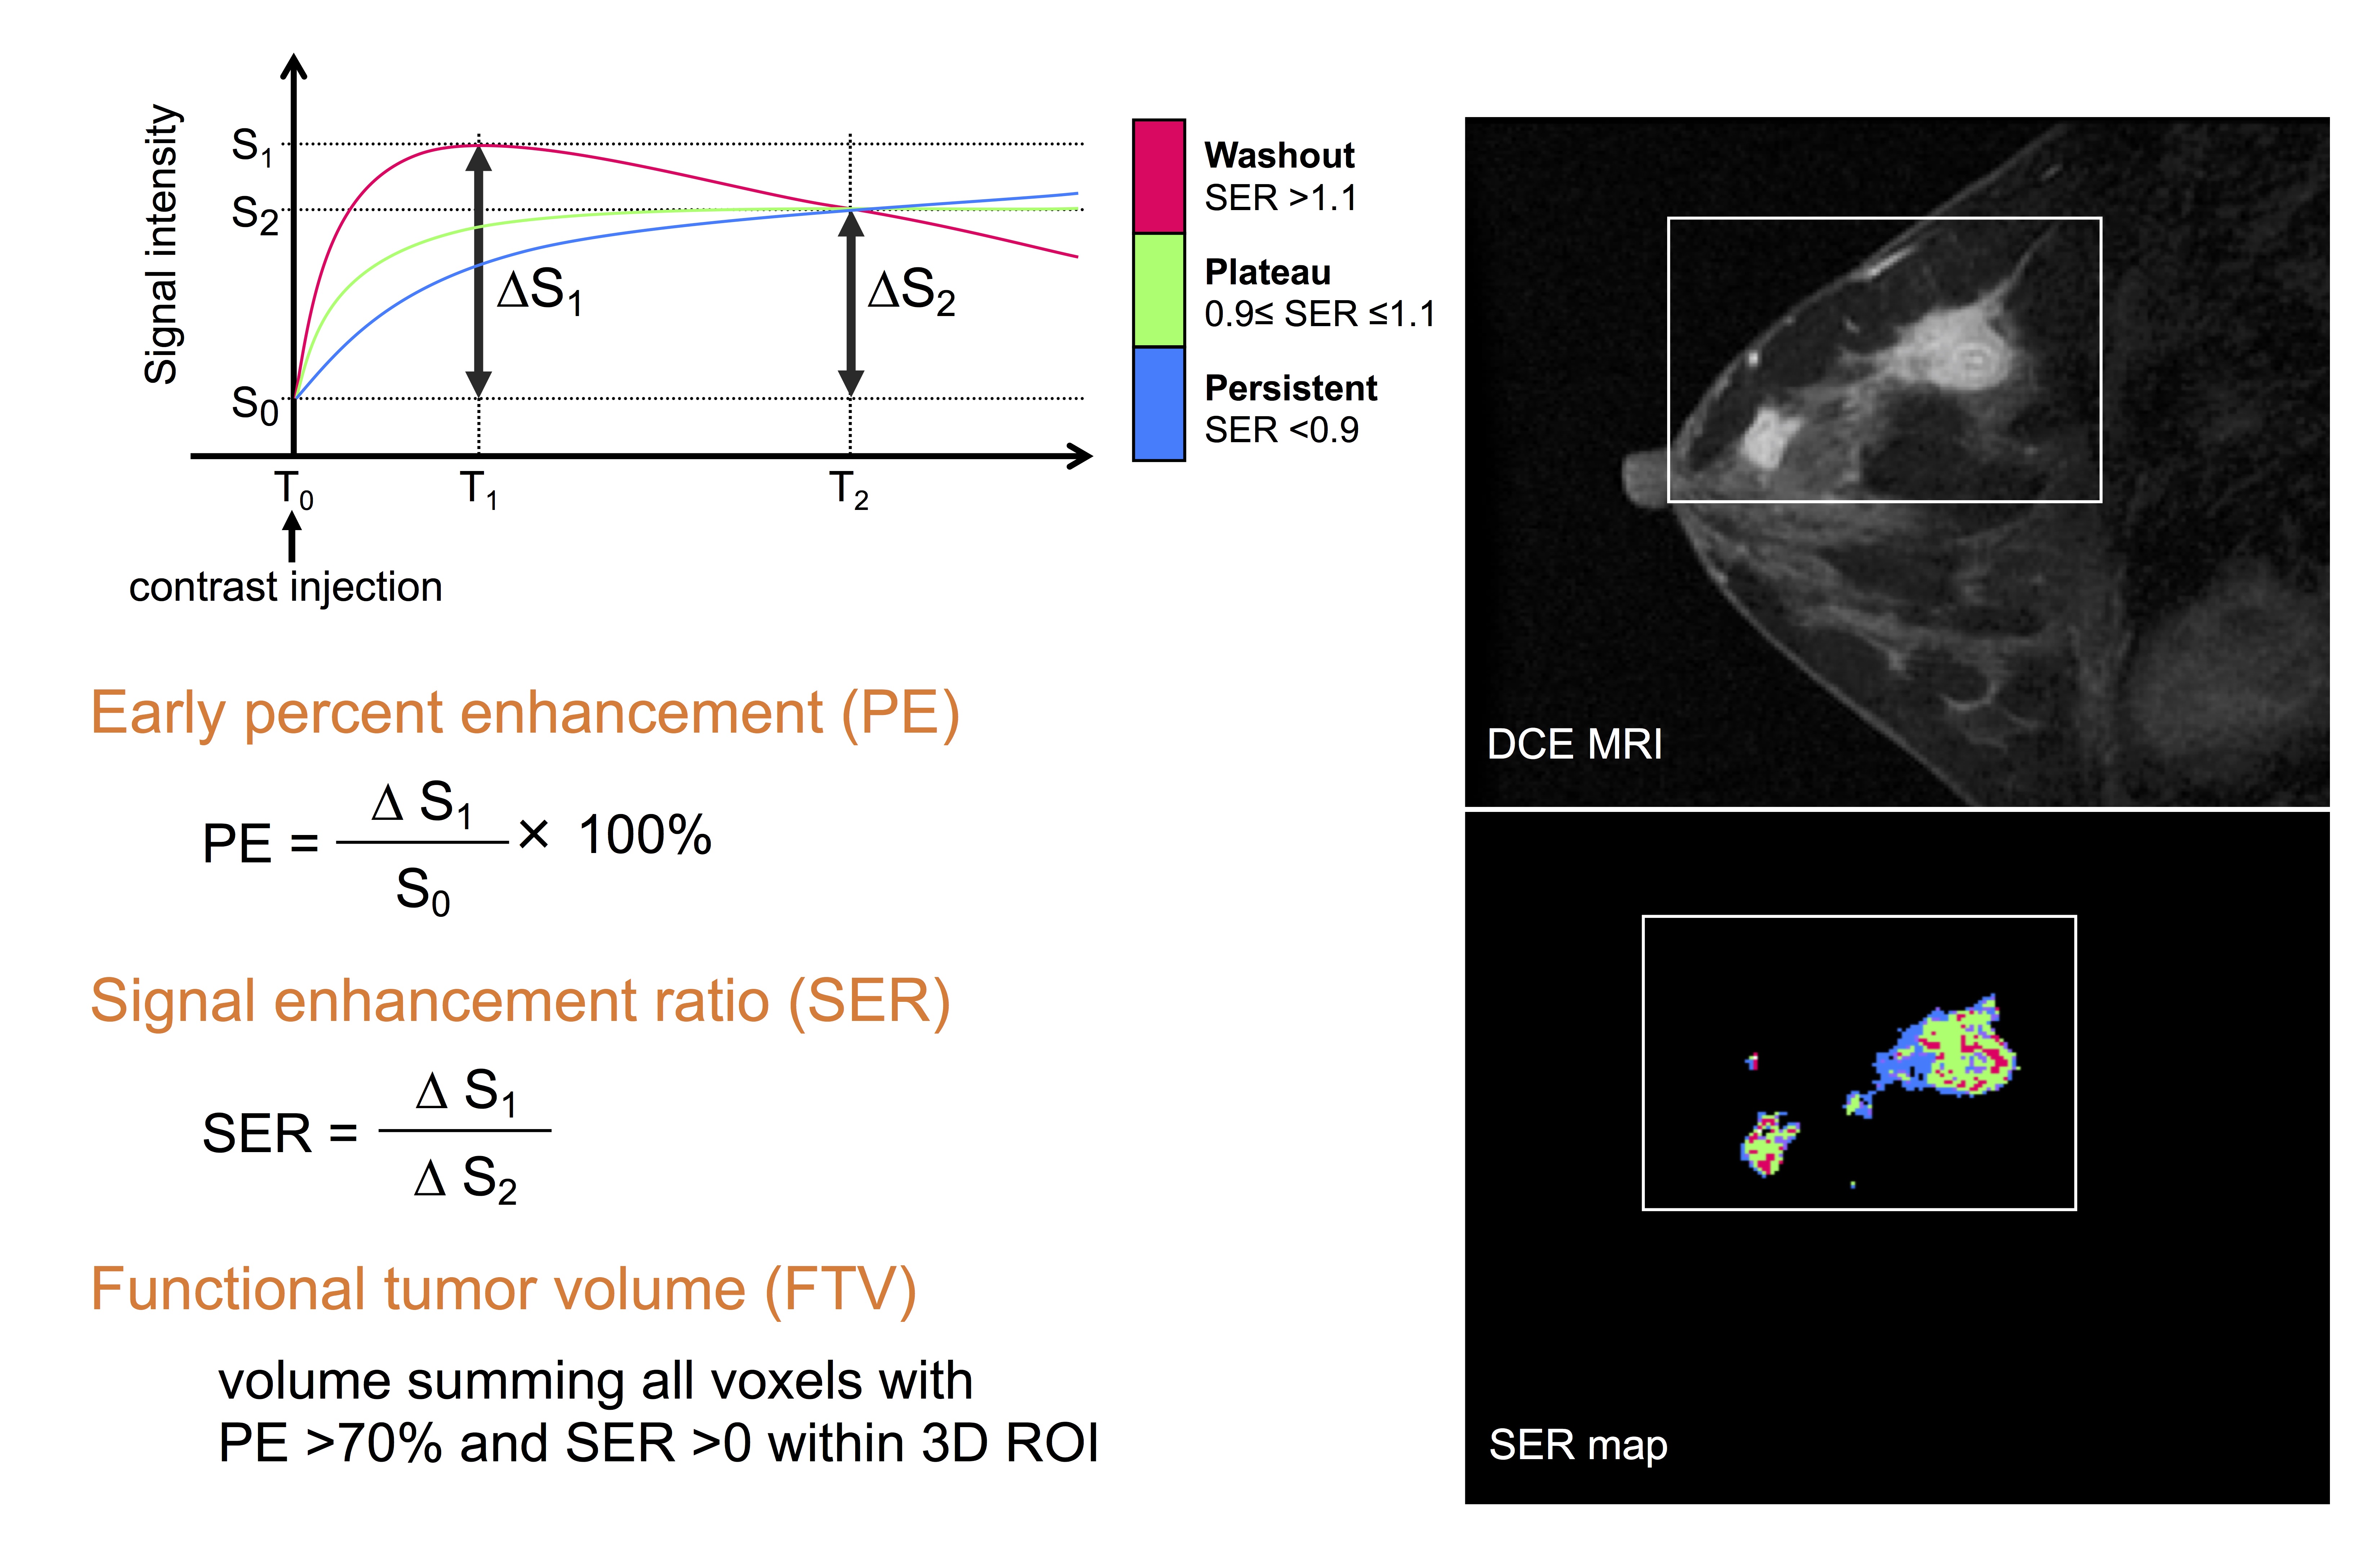
Figure 3: Quantitative calculation of percent
enhancement (PE), signal enhancement ratio (SER) and functional tumor volume
(FTV)
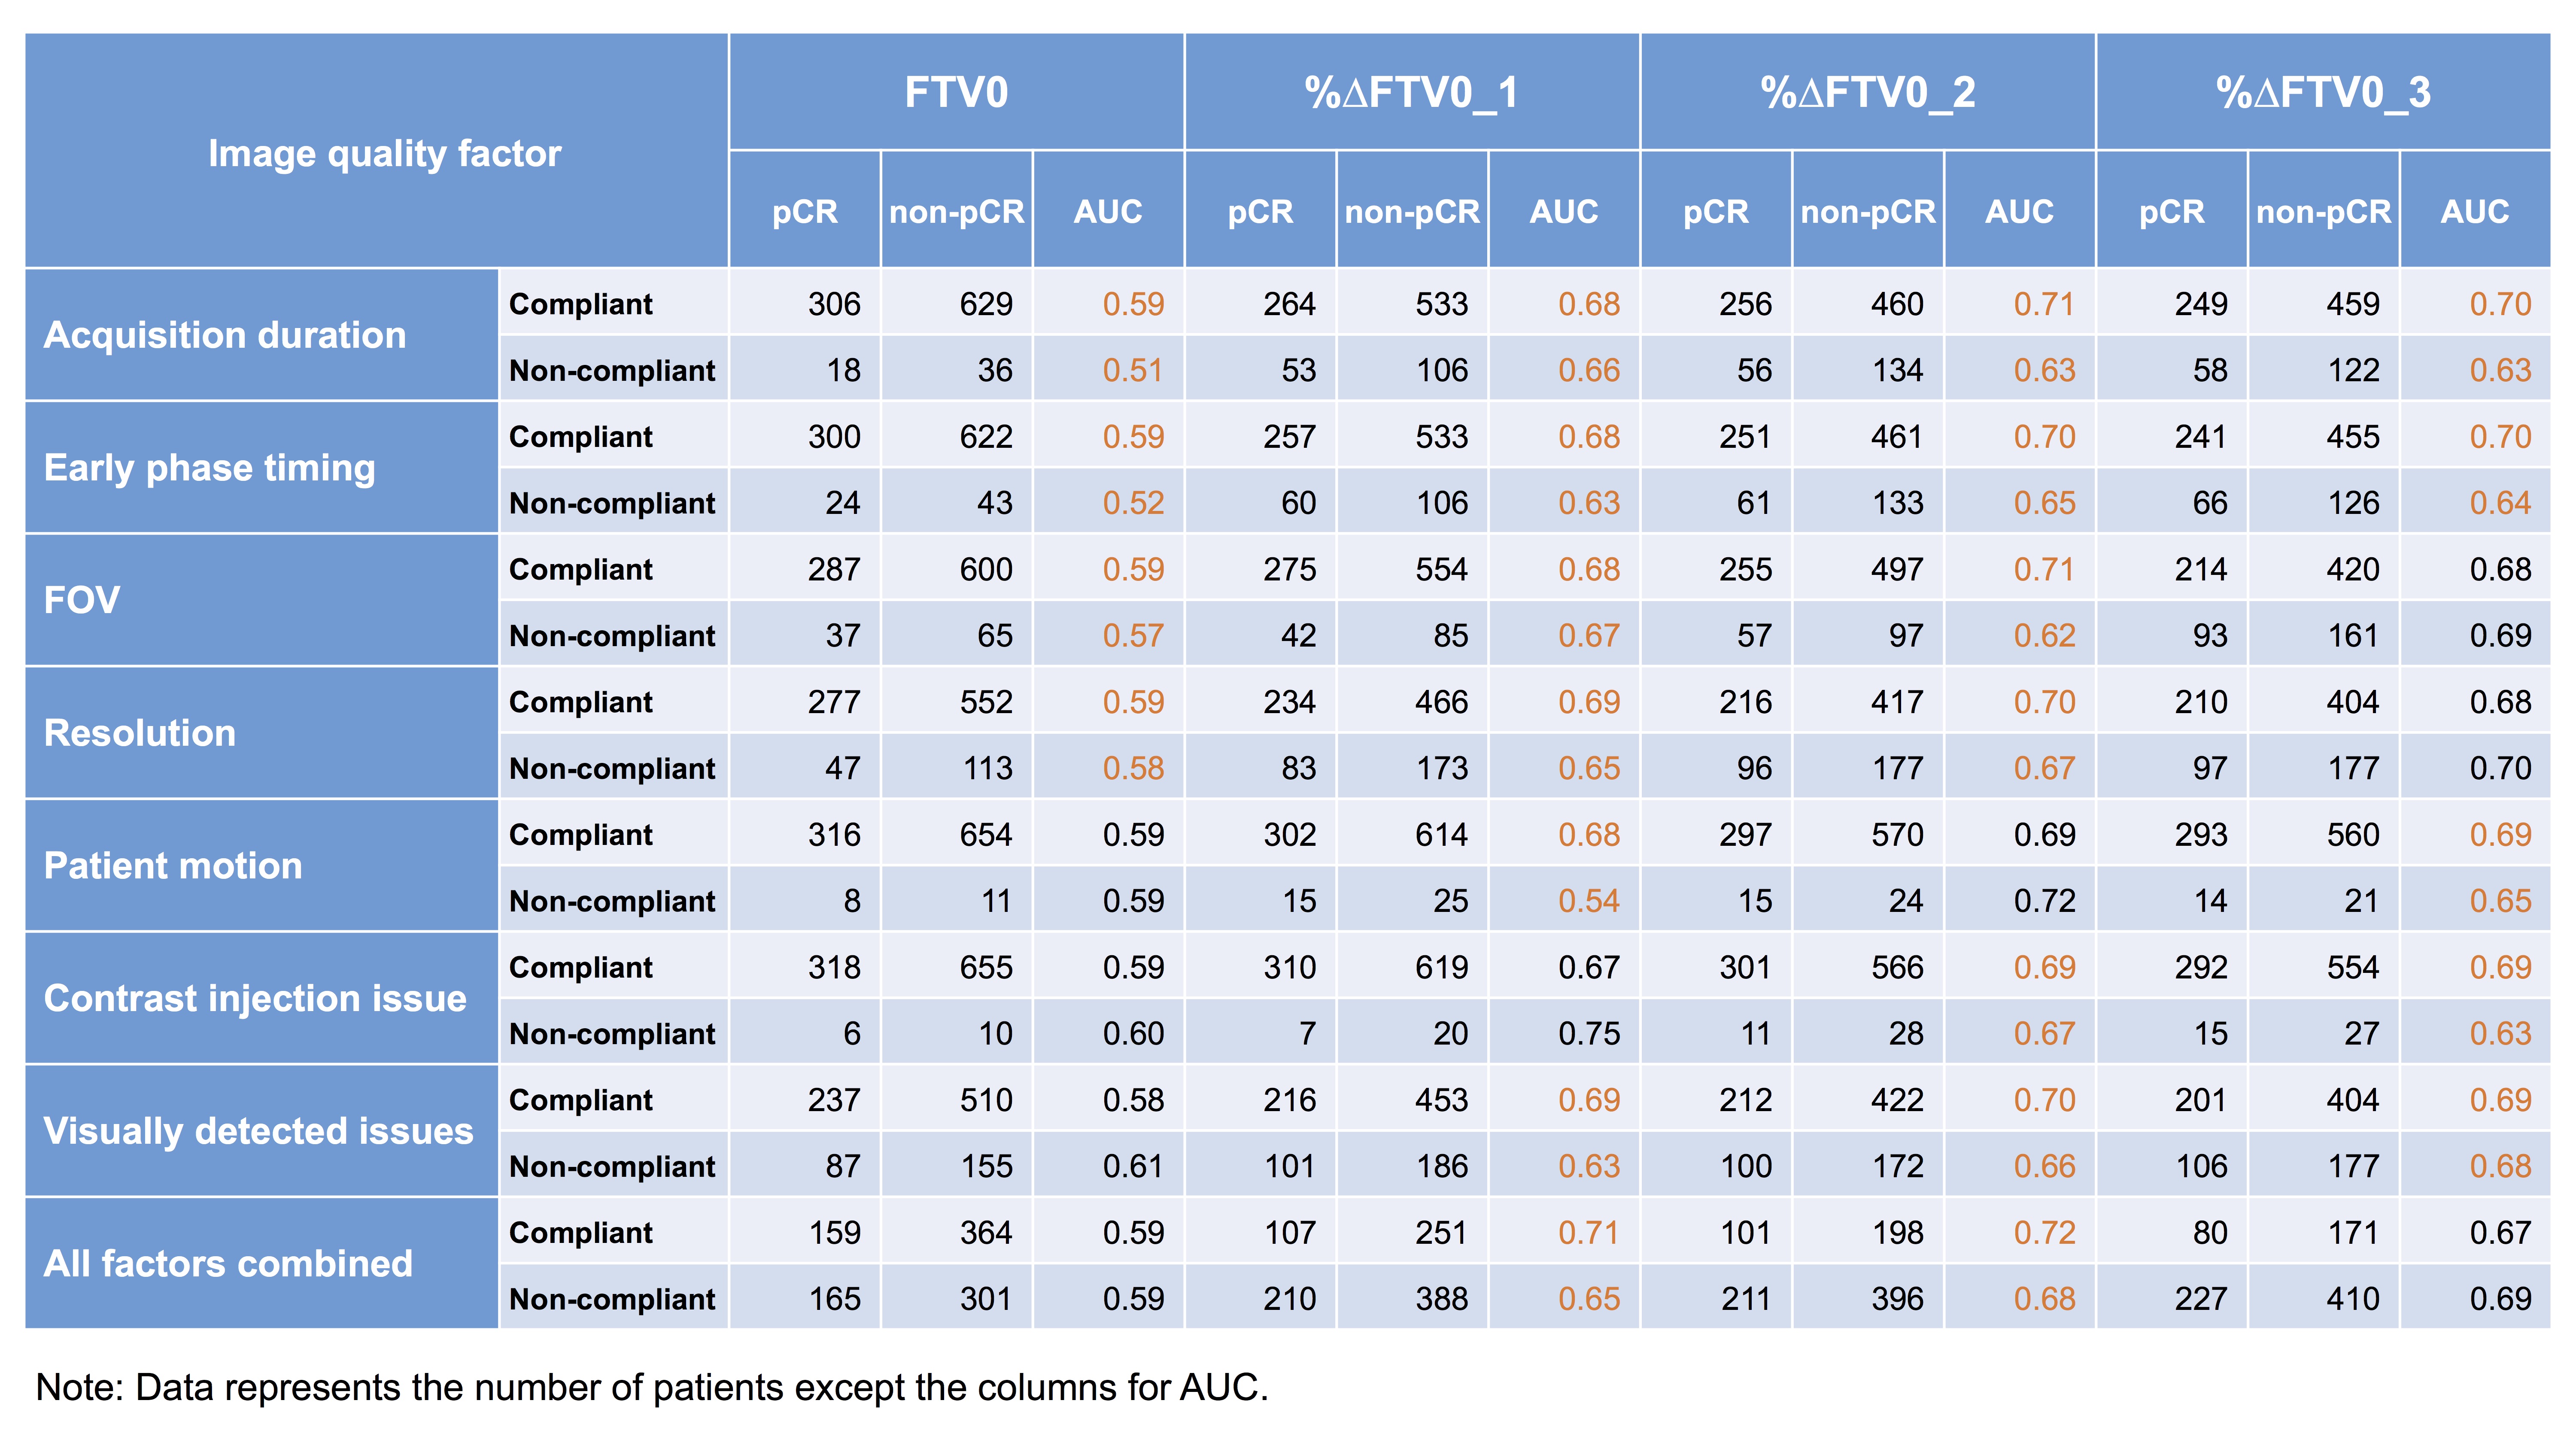
Figure 4: The area under the ROC curve
(AUC) of compliant or non-compliant FTV0, %∆FTV0_1, %∆FTV0_2 and %∆FTV0_3 in each image quality
factors

Figure 5: ROC curves of compliant and
non-compliant
FTV0, %∆FTV0_1, %∆FTV0_2 and %∆FTV0_3 in
“All factors combined”