2378
Quantitative Bilateral Sodium and Proton Breast Imaging at 3T1Department of Radiology, University of Cambridge, Cambridge, United Kingdom, 2Cancer Research UK, Cambridge, United Kingdom, 3Department of Radiology, Haukeland University Hospital, Bergen, Norway, 4Department of Biology, University of York, York, United Kingdom, 5York Biomedical Research Institute, University of York, York, United Kingdom, 6Department of Chemistry, University of York, York, United Kingdom, 7GE Healthcare, Munich, Germany
Synopsis
Sodium (23Na)-MRI was performed using a dual-tuned bilateral 23Na/1H breast coil on four healthy volunteers. Images acquired using 23Na-MRI show a relationship between sodium concentration and diffusion properties of breast tissue. Sodium signal variations due to mild flip angle non-uniformity were observed between left and right breasts. After correction using B1 mapping, tissue sodium concentration (TSC) maps were more closely matched between breasts.
Introduction
Sodium (23Na)-MRI is an emerging technique that is posited as enabling the differentiation of malignant and benign breast lesions and normal fibroglandular tissue based on increases in total tissue sodium concentration (TSC)1. 23Na-MRI, alongside other multiparametric proton (1H)-MRI techniques such as diffusion-weighted imaging (DWI) and dynamic contrast-enhanced imaging (DCE-MRI), can provide complementary information about the physiological and biochemical state of tumours. Furthermore, as changes in sodium concentration are likely to occur before changes in cellularity or vascularity as measured by DWI and DCE-MRI, 23Na-MRI may provide more immediate information about changes in tumour physiology to assess the effects of therapy2.Methods
Four healthy volunteers (mean age 35.5 years, range 25 – 52 years) were scanned with informed consent and the approval of the local ethics board on a 3T system (MR750, GE Healthcare, Waukesha, WI) using a dual-tuned bilateral 23Na/1H breast coil (Rapid Biomedical, Rimpar, Germany) in the prone position. The coil consisted of 4 transmit/receive sodium channels and 16 receive-only proton channels.23Na-MRI protocol: 23Na-MRI was performed using a 3D cones ultra-short echo time trajectory3 with TR/TE = 100/0.46ms, flip angle = 90 degrees, voxel size = 3x3x6mm3 for a 36 x 36 cm2 field-of-view (FOV), number of averages = 4, interleaves = 1402, total scan time = 9 minutes and 21 seconds. Inversion recovery images were also acquired with inversion time 30ms, TR 250ms, 2 averages. Low resolution sodium images were acquired at flip angles of 40 and 80 degrees for B1 mapping. For calibration purposes, a fiducial with sodium concentration 78.5mM was placed in the FOV.
1H-MRI protocol: A 3D T1-weighted fast spoiled gradient echo sequence (TR/TE = 4.42/1.97ms, voxel size = 1.1 x 1.6 x 2.8mm3, FOV = 36 x 36 cm2, scan time = 1 minute 27 seconds) was performed to generate water and fat images. DWI was performed using a single-shot echo-planar imaging sequence with TR/TE = 4000/94.2ms, voxel size = 2.8 x 2.8 x 4mm3, FOV = 36 x 36 cm2, acceleration factor = 2, averages = 4, b-values = 0, 100, 500, 1000, 1500, 2000, 2500 s/mm2, total scan time = 10 minutes 12 seconds.
Image Processing: 23Na-MRI images were obtained via a re-gridding routine before Fourier transformation. B1 maps were generated using the double angle method4 as the ratio of the actual to nominal flip angle. Regions of interest were drawn on B1 maps covering two thirds of left and right breasts to measure flip angle variation between breasts. TSC maps were generated based on the calibration fiducial concentration, assuming that the TR was sufficiently long to avoid T1 saturation. Given the distance of the fiducial from the breast, TSC maps were corrected with B1 maps using the spoiled echo gradient signal equation. ADC maps were generated using in-house software developed in MATLAB (version 2018b).
Results
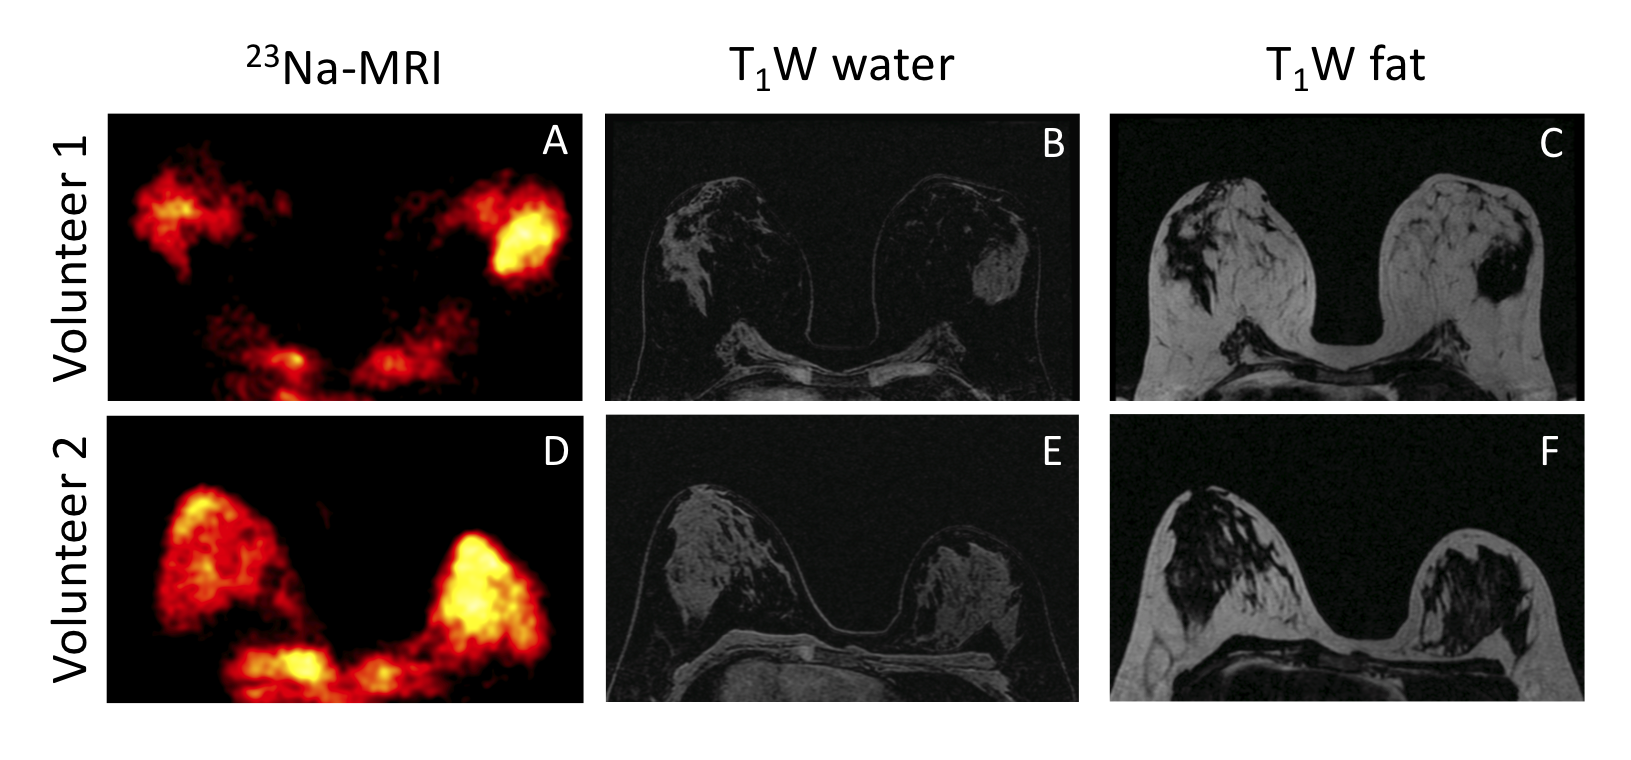
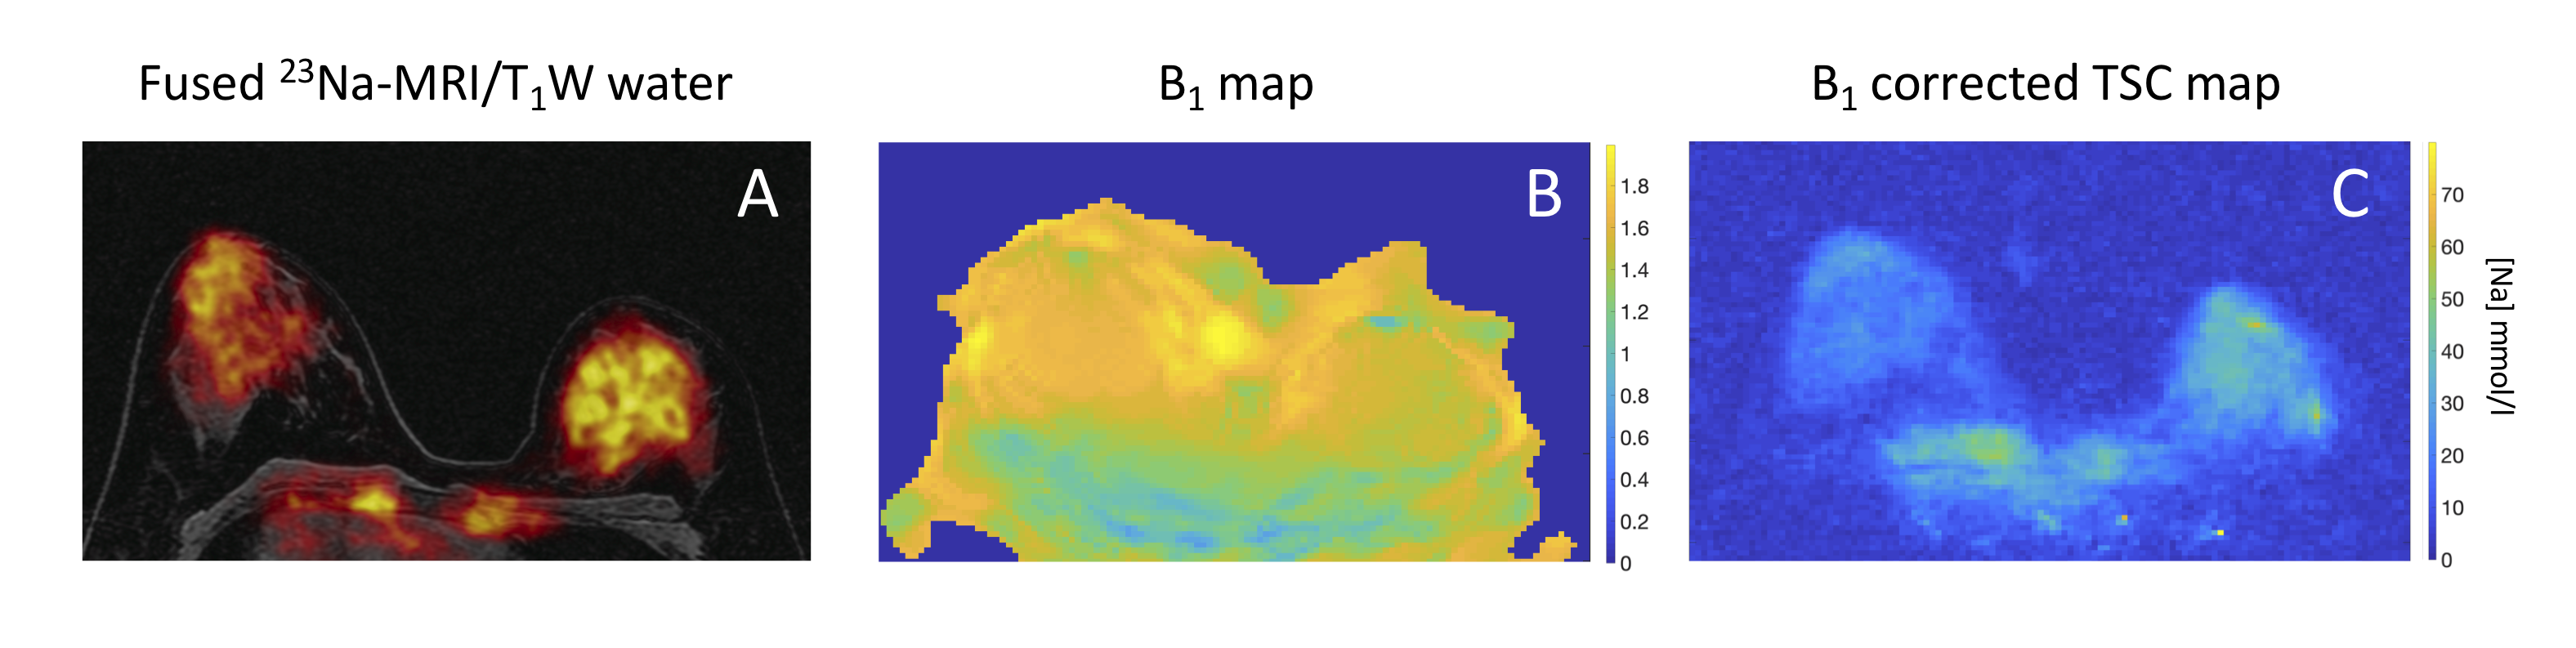
Figure 1 shows 23Na-MRI and T1-weighted water and fat images from two volunteers. Qualitatively, there was more sodium signal in fibroglandular tissue compared to fatty tissue. For both volunteers, sodium signal was higher in the right breast than the left, which is likely a systematic error due to a 10-20% higher B1 field in the left versus right coil.An example of a B1 map and a B1 corrected TSC map are shown in Figure 2. There was significant variation in the B1 map in the left/right directions and anterior/posterior directions. There was a higher flip angle observed in the left breast. The mean flip angle variation between left and right breasts measured across all patients was 24 ± 11 degrees. After flip angle correction, the TSC matched more closely between breast sides (Figure 2C), although this correction does not account for receive sensitivities. High TSC was observed in the heart, which is explainable due to large sodium concentrations in the blood pool.
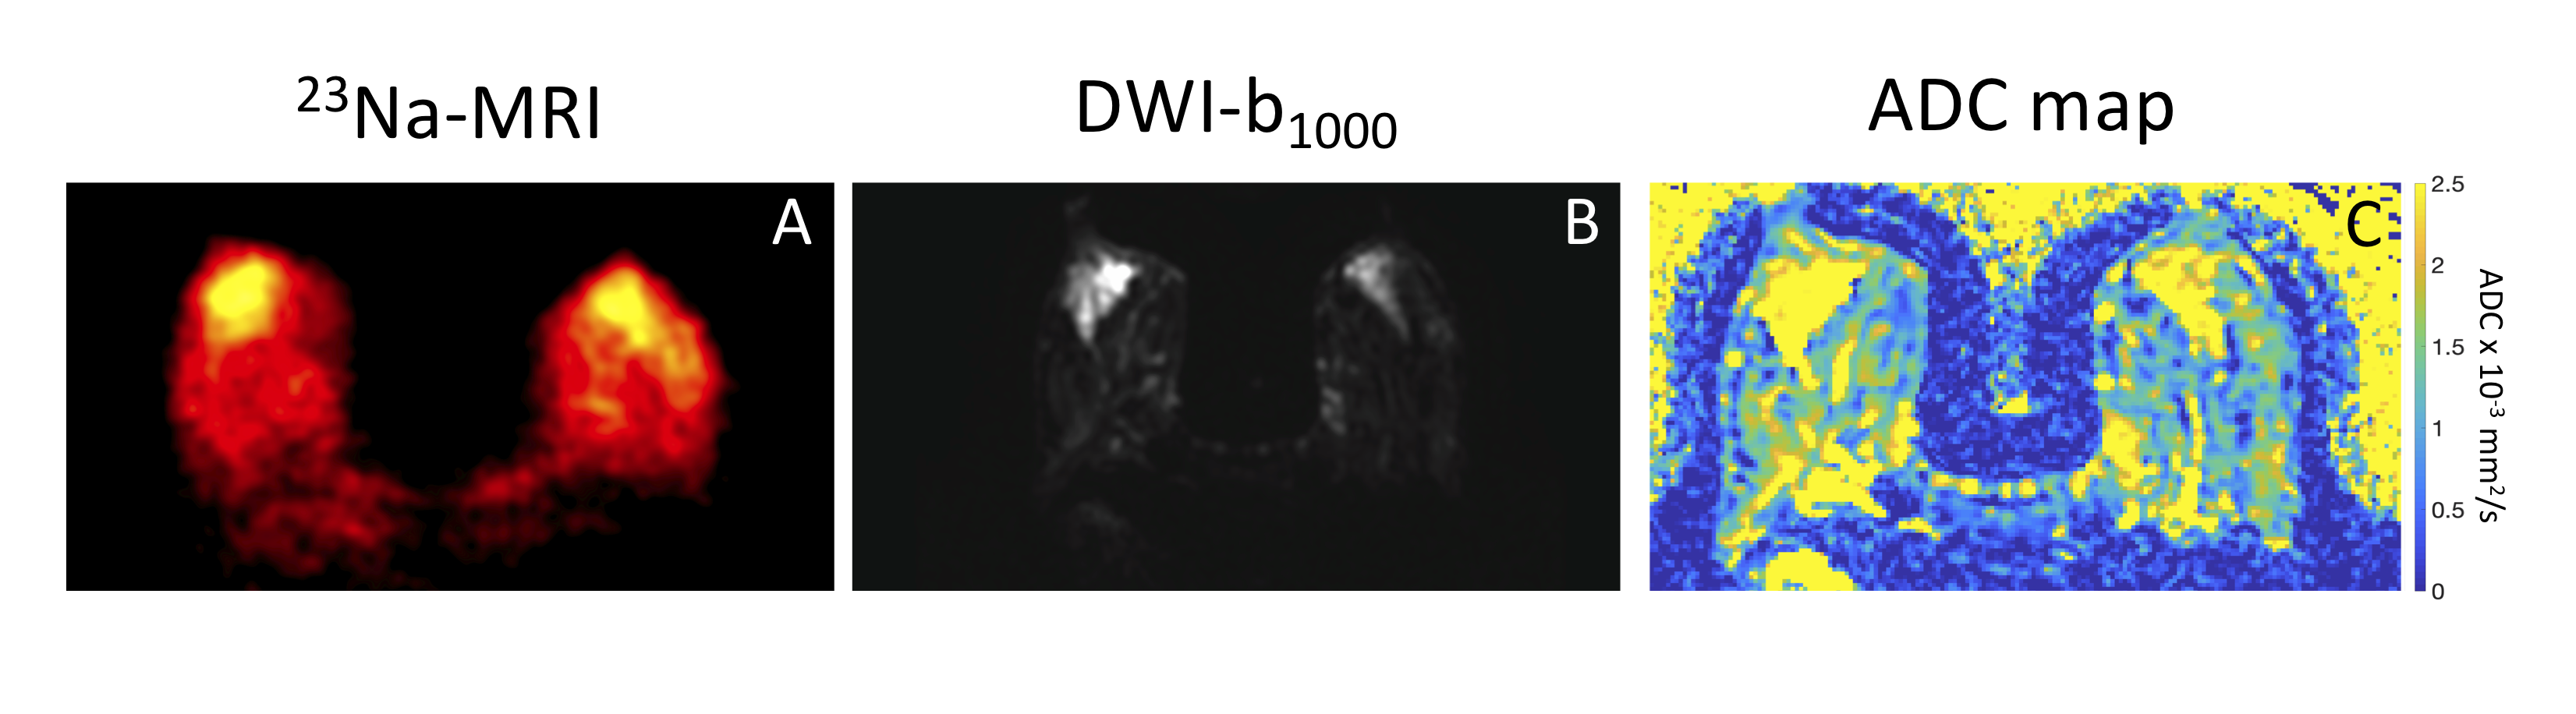
Figure 3 shows a comparison of 23Na-MRI and DWI. Similar anatomical structures were observed in both types of image. Areas with high sodium signal correspond to areas with high ADC.
Discussion
High quality sodium and proton images were acquired using a dual-tuned bilateral coil with a unique number of sodium and proton channels. The mean variation in flip angle between left and right breasts was comparable to previously published values for 1H-MRI breast imaging5. The sodium concentrations measured in fibroglandular tissue were slightly higher than values published previously1. However, given that our study only included healthy volunteers, it is not clear whether these values are a suitable reference standard.Similar anatomical structures were observed in 23Na-MRI and DWI, suggesting a relationship between tissue sodium concentration and diffusion properties. Future work will include DCE-MRI to perform quantitative pharmacokinetic modelling, aiming to investigate the relationship of tumour vascularity to sodium concentration in breast tissue.
Conclusion
Images acquired using 23Na-MRI show a relationship between sodium concentration, anatomical structure and diffusion properties. B1 correction is required for accurate quantification of TSC.Acknowledgements
This work was supported by GlaxoSmithKline, Cancer Research UK and the National Institute of Health Research Cambridge Biomedical Research Centre.References
1. Ouwerkerk, R. et al. Elevated tissue sodium concentration in malignant breast lesions detected with non-invasive 23Na MRI. Breast Cancer Res. Treat. 106, 151–160 (2007).
2. Madelin, G., Lee, J.-S., Regatte, R. R. & Jerschow, A. Sodium MRI: methods and applications. Prog. Nucl. Magn. Reson. Spectrosc. 79, 14–47 (2014).
3. Gurney, P. T., Hargreaves, B. A. & Nishimura, D. G. Design and analysis of a practical 3D cones trajectory. Magn. Reson. Med. 55, 575–582 (2006).
4. Cunningham, C. H., Pauly, J. M. & Nayak, K. S. Saturated double-angle method for rapid B1+ mapping. Magn. Reson. Med. 55, 1326–33 (2006).
5. Azlan, C. A. et al. B1 transmission-field inhomogeneity and enhancement ratio errors in dynamic contrast-enhanced MRI (DCE-MRI) of the breast at 3T. J. Magn. Reson. Imaging 31, 234–9 (2010).
Figures