2376
Multi-nuclear MRI to disentangle intracellular sodium concentration and extracellular volume fraction in breast1Radiology, Center for Advanced Imaging Innovation and Research (CAI2R) and Center for Biomedical Imaging, New York University School of Medicine, NEW YORK, NY, United States, 2The Sackler Institute of Graduate Biomedical Science, New York University School of Medicine, NEW YORK, NY, United States
Synopsis
The intracellular sodium concentration (CIC) and extracellular volume fraction (ECV) are promising biomarkers in breast lesions. However, separating the contribution of the intracellular (IC) and extracellular (EC) compartments only relying on differences in 23Na relaxation properties is challenging due to close similarity between the two compartments and the inability to measure IC and EC relaxation times in vivo. In this study we demonstrate the feasibility to quantify CIC and ECV in three healthy subjects by using complementary information from 23Na and 1H MRI measurements. The mean CIC and ECV between three healthy subjects were 27.7±4.1 mM and 0.29±0.07, respectively.
Introduction
While standard proton (1H) MRI allows morphological characterization of breast lesions, sodium (23Na) MRI gives direct insight on tumor metabolism, which is characterized by increased total sodium concentration (TSC) compared to healthy fibroglandular tissue (1). Although TSC is straightforward to measure, it is influenced by two key parameters that are important to distinguish: the intracellular sodium concentration (CIC), which is governed by the sodium-potassium pump, as well as the extracellular volume (ECV) fraction, which can change with cellular death or edema. Therefore, CIC and ECV could better characterize cell viability, inflammation or fluid content compared to TSC. Unfortunately, due to the low SNR of 23Na MRI along with similar and uncertain relaxation properties of intra- and extra cellular sodium, these quantities still remain largely unexplored. In this study we disentangle intracellular and extracellular sodium by taking advantage of complementary information from standard 1H imaging. We present a multi-compartment breast tissue model, 23Na and 1H MRI measurements to quantify tissue parameters, and results demonstrating feasibility in 3 healthy subjects.Methods
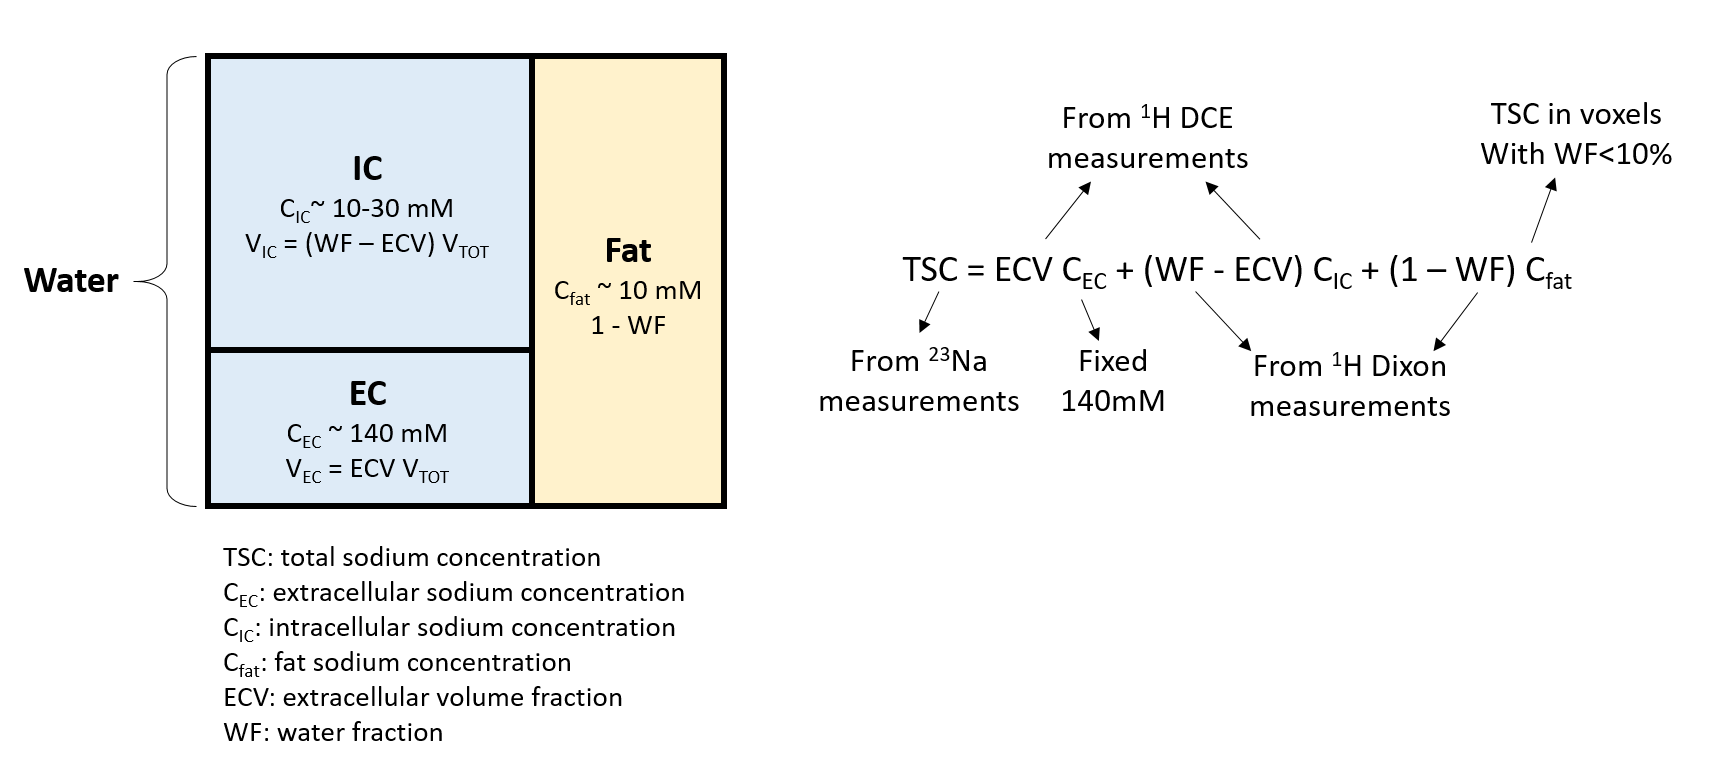
Based on a three-compartment breast tissue model (Figure 1), TSC can be estimated as the sum of the intracellular (IC), extracellular (EC) and fat components:$$TSC = ECV\cdot C_{EC}+(WF-ECV)\cdot C_{IC}+(1-WF)\cdot C_{fat} \qquad \qquad \qquad [1]$$ where WF, CEC = 140mM, and Cfat are respectively the water fraction, the extracellular sodium concentration (considered constant in our model), and the fat sodium concentration. The intracellular volume fraction (ICV) is given by ICV = WF–ECV. We describe below the methods for measuring TSC with 23Na MRI, and WF and ECV with 1H MRI, which allows for straightforward calculation of CIC. All measurements were performed on a Siemens 7T MAGNETOM scanner (Siemens Healthineers, Erlangen, Germany) using an in-house built dual-tuned bilateral breast coil (2).
Water fraction. WF was measured by processing 1H-MRI 3D GRE data (TE = 2.04, 2.24, 2.44 and 2.64 ms) with a hierarchical IDEAL method (3) available in the ISMRM water-fat separation toolbox (4). In order to perform the quantification in the fibroglandular tissue, this tissue was segmented by selecting voxels with WF>50%.
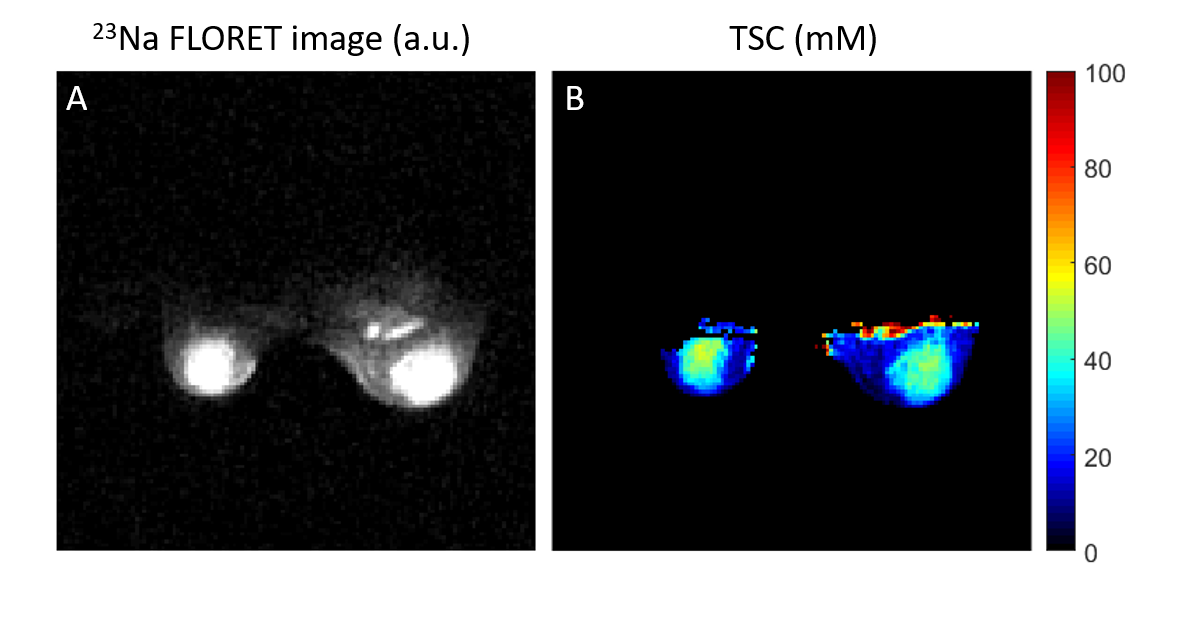
Total sodium concentration. TSC was measured from 23Na FLORET (5) images (TE/TR=0.2/60 ms, FA=80°, 3 hubs at 45°, 400 interleaves, nominal resolution = 2.75 mm3, acquisition time = 9:36 min). The relationship between signal intensity and sodium concentration was determined using a calibration phantom with 10 gels with known sodium concentrations and relaxation times. The effect of relaxation was accounted for by using the correction factor: $$$λ = ^{1-e^{-TR/T_1}}/_{1-cos(FA)e^{-TR/T_1}} \cdot (0.6 e^{-TE/T_{2,s}} +0.4 e^{-TE/T_{2,l}})$$$, where 23Na relaxation times T1, T2,s and T2,l of fibroglandular tissue were set according to our measurements and those in the literature (T1 = 32 ms, T2,s = 0.5 ms, T2,l = 15 ms) (6). Cfat was calculated from TSC in voxels with WF<10%.
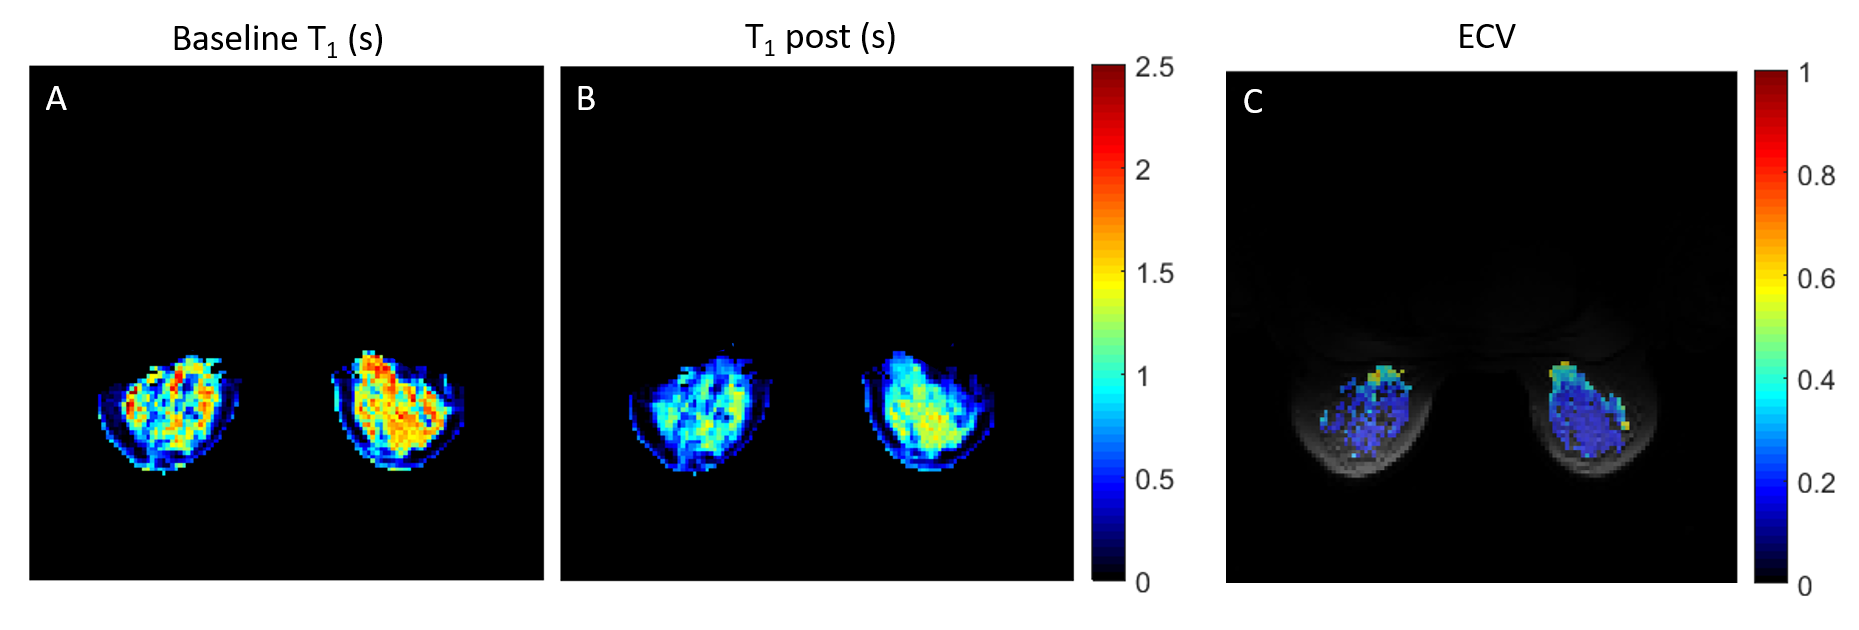
Extracellular volume fraction. The ECV in the fibroglandular tissue was measured using 1H T1 maps acquired at baseline and 10 minutes after contrast agent injection (0.1ml/kg of Gadobutrol, Gadavist, Bayer HealthCare, Whippany, NJ) (7). MP2RAGE (8) was used to measure T1 (TE/TR = 1.27/4000 ms , TI1/TI2 = 0.7/2.5 ms, FA1/FA2 = 4°/5°, acquisition time: 5 min). The ECV was calculated from the change in 1/T1 in the breast normalized by the change in 1/T1 in a reference tissue:
$$ECV = ECV_{ref} \cdot \frac{1/T_{1,post} - 1/T_{1,pre}}{1/T_{1,post,ref} - 1/T_{1,pre,ref}} \qquad \qquad \qquad [2]$$ In lieu of an arterial input function, due to local coil coverage, we used the pectoral muscle as the reference tissue with known ECV = 0.18 (9).
Intracellular sodium concentration. Once the WF, TSC and ECV are measured, the CIC can be simply calculated from equation [1].
Results
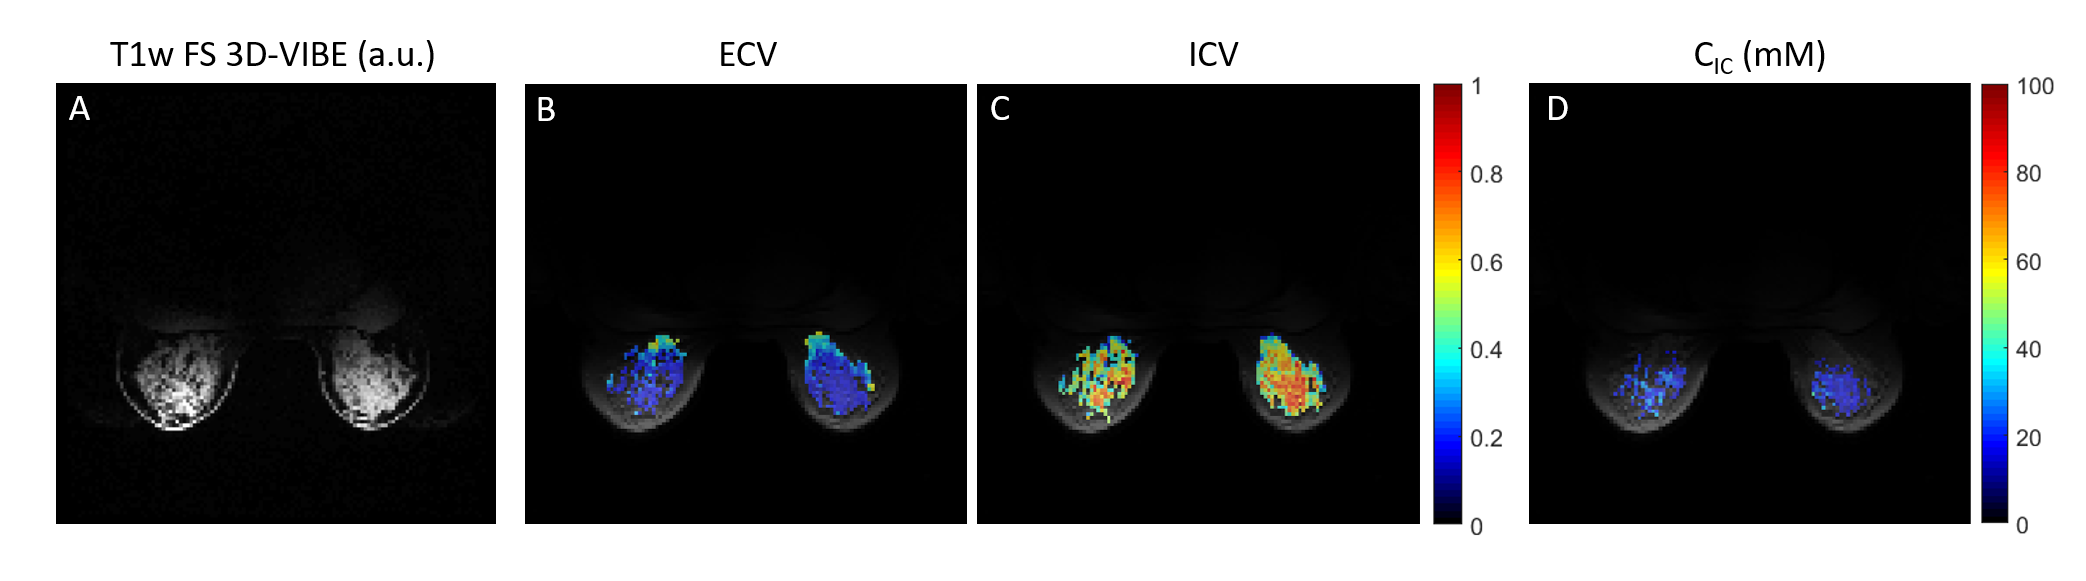
The mean TSC in the fibroglandular tissue in a 34-year-old healthy subject was 29.1±13.7 mM (Figure 2), which is in accordance with previous findings (1,10). The ECV map calculated from 1H T1 measurements in voxels with WF>50% is shown in Figure 3. The mean ECV in the fibroglandular tissue was 0.22±0.18. For the same subject, Figure 4 shows ECV, ICV and CIC maps superimposed on proton GRE image. The ICV and CIC in the glandular tissue were respectively 0.55±0.18 and 22.7±8.9 mM. The mean CIC and ECV between three healthy subjects were 27.7±4.1 mM and 0.29±0.07, respectively.Discussion
CIC and ECV are promising biomarkers in breast lesions. Our results demonstrate the feasibility of separating TSC into intra- and extra-cellular components using complementary information from 23Na and 1H MRI measurements. Contrast-enhanced T1 mapping has been often employed to measure the ECV of myocardium (7). In cardiac MRI, blood signal is easily accessible and allows pre and post injection T1 measurements to serve as a reliable baseline for T1 changes in the myocardium. Due to the narrow coil coverage, we used skeletal muscle as reference with fixed ECV. Other assumptions of the method are fixed 23Na relaxation properties of the breast, which come into play when calculating the TSC. As tumors could exhibit different 23Na T1 and T2’s compared to healthy tissue, this assumption may introduce errors in TSC and CIC. However, despite these limitations it could still be possible to assess changes in CIC and ECV during treatment, which would give insights on tumor response to therapy.Acknowledgements
This work was supported by National Institutes of Health grant R21CA213169 and was performed under the rubric of the Center for Advanced Imaging Innovation and Research (CAI2R, www.cai2r.net) at the New York University School of Medicine, which is an NIBIB Biomedical Technology Resource Center (NIH P41 EB017183).References
(1) Ouwerkerk R, Jacobs MA, Macura KJ, Wolff AC, Stearns V, Mezban SD, Khouri NF, Bluemke DA, Bottomley PA. Elevated tissue sodium concentration in malignant breast lesions detected with non-invasive 23Na MRI. Breast cancer research and treatment 2007;106(2):151-160.
(2) Ianniello C, Madelin G, Moy L, Brown R. A dual-tuned multichannel bilateral RF coil for (1) H/(23) Na breast MRI at 7 T. Magnetic resonance in medicine 2019;82(4):1566-1575.
(3) Jiang Y, Tsao J. Fast and robust separation of multiple chemical species from arbitrary echo times with complete immunity to phase wrapping. Proceedings of the 20th Annual Meeting of ISMRM. Melbourne, Australia2012.
(4) Hu HH, Bornert P, Hernando D, Kellman P, Ma J, Reeder S, Sirlin C. ISMRM workshop on fat-water separation: insights, applications and progress in MRI. Magnetic resonance in medicine 2012;68(2):378-388.
(5) Pipe JG, Zwart NR, Aboussouan EA, Robison RK, Devaraj A, Johnson KO. A new design and rationale for 3D orthogonally oversampled k-space trajectories. Magnetic resonance in medicine 2011;66(5):1303-1311.
(6) Zbyn S, Juras V, Benkhedah N, Zaric O, Mlynarik V, Szomolanyi P, Bogner W, Nagel AM, Trattnig S. Bilateral in vivo mapping of sodium relaxation times in breasts at 7T. Proceedings of the Twenty-Third Meeting of the International Society for Magnetic Resonance in Medicine 2015(4630).
(7) Haaf P, Garg P, Messroghli DR, Broadbent DA, Greenwood JP, Plein S. Cardiac T1 Mapping and Extracellular Volume (ECV) in clinical practice: a comprehensive review. J Cardiovasc Magn Reson 2016;18(1):89.
(8) Marques JP, Kober T, Krueger G, van der Zwaag W, Van de Moortele PF, Gruetter R. MP2RAGE, a self bias-field corrected sequence for improved segmentation and T1-mapping at high field. NeuroImage 2010;49(2):1271-1281.
(9) Barison A, Gargani L, De Marchi D, Aquaro GD, Guiducci S, Picano E, Cerinic MM, Pingitore A. Early myocardial and skeletal muscle interstitial remodelling in systemic sclerosis: insights from extracellular volume quantification using cardiovascular magnetic resonance. Eur Heart J Cardiovasc Imaging 2015;16(1):74-80.
(10) Zaric O, Pinker K, Zbyn S, Strasser B, Robinson S, Minarikova L, Gruber S, Farr A, Singer C, Helbich TH, Trattnig S, Bogner W. Quantitative Sodium MR Imaging at 7 T: Initial Results and Comparison with Diffusion-weighted Imaging in Patients with Breast Tumors. Radiology 2016;280(1):39-48.
Figures