2373
Comparison of breast BPE segmentation methods for early prediction of response to treatment
Alex Nguyen1, Fredrik Strand2, Vignesh Arasu1, Wen Li1, Natsuko Onishi1, Jessica Gibbs1, Bonnie N Joe1, Laura J Esserman3, The I-SPY2 Investigator Network4, David C Newitt1, and Nola M Hylton1
1Department of Radiology and Biomedical Imaging, University of California, San Francisco, San Francisco, CA, United States, 2Department of Oncology and Pathology, Karolinska Institutet, Stockholm, Sweden, 3Department of Surgery, University of California, San Francisco, San Francisco, CA, United States, 4Quantum Leap Healthcare Collaborative, San Francisco, CA, United States
1Department of Radiology and Biomedical Imaging, University of California, San Francisco, San Francisco, CA, United States, 2Department of Oncology and Pathology, Karolinska Institutet, Stockholm, Sweden, 3Department of Surgery, University of California, San Francisco, San Francisco, CA, United States, 4Quantum Leap Healthcare Collaborative, San Francisco, CA, United States
Synopsis
Breast parenchymal enhancement (BPE) has shown association with breast cancer risk and response to neoadjuvant treatment. However, BPE quantification is challenging and there is no agreed upon standard. This study compares the results of three fully automated segmentation methods for early prediction of pathologic complete response (pCR) following neoadjuvant treatment. We evaluated three different sub-volumes of interest segmented from DCE-MRI: full stack, half stack, and center 5 slices. The differences between methods were assessed and a univariate logistic regression model was implemented to determine predictive performance of each segmentation method.
Introduction
Background parenchymal enhancement (BPE) assessed in breast fibroglandular tissue (FGT) has shown association with breast cancer risk and has been used as an imaging biomarker for predicting neoadjuvant chemotherapy (NAC) response1. Acceptance of BPE as a biomarker is constrained by limited single-site studies with small cohort sizes, and varying methods for visual and quantitative BPE assessment1. This retrospective study was performed in the imaging dataset from the I-SPY 2 TRIAL, a multi-center clinical trial for patients with locally advanced breast cancer undergoing NAC2. Prior studies3-5 demonstrated that BPE, measured in 5 central slices of the unaffected (contralateral) breast, provided additive benefit to tumor volume for the prediction of pathological complete response (pCR: no residual invasive disease in the breast or lymph nodes at time of surgery). In this study, we evaluated three segmentation approaches for measuring contralateral BPE (cBPE) and compared them for prediction of pCR. The overall aim was to determine an accurate and robust segmentation method to quantitatively measure cBPE and optimize its predictive power for assessing treatment response.Methods
This dataset included 746 patients with pCR outcome from drug arms of the I-SPY2 TRIAL completed by October 2016. Subjects gave written informed consent prior to enrollment. Dynamic contrast-enhanced (DCE) MRI was acquired four times for each patient (Figure 1): pre-treatment (T0), early-treatment (T1), inter-regimen (T2), and pre-surgery (T3). We automatically segmented the contralateral breast anterior to the sternal notch and then applied an in-house algorithm using fuzzy c-means clustering6 for tissue segmentation on three different sized sub-volumes: all axial slices (full), 50% of all slices centered at the middle slice (half), and the central 5 slices (center 5). After creating the FGT masks, we calculated mean cBPE for each sub-volume as Σ [(S1-S0)/S0]/N, where S0 is the pre-contrast signal intensity, S1 is the early post-contrast signal intensity at about 2.5 minutes after contrast injection, and N is the number of FGT voxels. The comparability of the three segmentation methods was assessed in the full cohort and within hormone receptor (HR) and human epidermal growth factor receptor 2 (HER2) subtypes. The percent change in mean cBPE from T0 to T1 (ΔBPE0_1) was used in a univariate analysis for pCR prediction. The area under the ROC curve (AUC) of a logistic regression model was used to assess the predictive performance of ΔBPE0_1. P-values for AUCs being different from 0.5 were estimated using the Mann–Whitney U test. Results with p-values less than 0.05 were considered statistically significant.Results
Out of 746 patients, 406 with rejected DCE-MRI exams or failed segmentations (including undersampling, coil artifacts, poor fat suppression, etc.) were excluded. For the final cohort, 340 women (median age 49, ranging from 24 to 77) were included. The Pearson’s linear correlation coefficient, r, was calculated between segmentation methods (Figure 2). The r values for full vs. half, half vs. center 5, and full vs. center 5 were 0.946, 0.863, and 0.815, respectively. Figure 3 shows the pCR rate and the reported AUCs for percent change in mean cBPE from pre-treatment to early-treatment (ΔBPE0_1) for each segmentation method within the full cohort and within subtypes. AUCs in the full cohort ranged from 0.50 to 0.52 and AUCs varied within subtype from 0.43 to 0.45 in HR+/HER2+, 0.54 to 0.58 in HR+/HER2-, 0.79 to 0.86 in HR-/HER2+, and 0.51 to 0.53 in HR-/HER2-.Discussion
Use of automated segmentation can provide reproducible quantitative results and is necessary for validation and ensuring repeatability. AUC values were similar for each segmentation method with only small differences for the full cohort and within subtypes. Variations within subtype were relatively small in comparison to the AUC differences between subtypes. Our results corroborate the work from Dong et. al7, supporting current findings that women with HR- tumors were more likely to achieve pCR than HR+ tumors as well as presenting data indicating decreased BPE in women with HER2+ breast cancer may predict effective response to NAC treatment. We employed a visual assessment of segmentation for image quality acceptance, wherein a large number of cases (54% of the dataset) were excluded from analysis. When the exclusion criteria were relaxed, allowing artifacts or undersampling of tissue, the findings remained consistent within and between subtypes. Among the segmentation methods, one limitation was that the center referenced for half-stack and center 5 slice methods may not always have been well centered within the breast, and thus might not give a representative sample of the tissue. The full stack may pick up noise as well as false masking in the outermost regions of the DCE-MRI. It is also the most computationally expensive method and does not appear to provide more benefit than the half stack. Based on these observations, we recommend using the half-stack volume of interest moving forward. Future plans include comparing our results to a manually segmented reference standard, implementing automatic nipple slice detection, and adding cBPE into a multivariate model to hopefully improve predictive performance for treatment response.Acknowledgements
This work was supported by NIH U01 CA225427 and NIH R01 CA132870.References
- Liao GJ, Henze Bancroft L, Strigel RM, et al. Background parenchymal enhancement on breast MRI: A comprehensive review. J Magn Reson Imaging, 2019. doi:10.1002/jmri.26762
- Barker A, Sigman C, Kelloff G, et al. I‐SPY 2: An Adaptive Breast Cancer Trial Design in the Setting of Neoadjuvant Chemotherapy. Clinical Pharmacology & Therapeutics, 86: 97-100, 2009
- Hylton NM, Gatsonis CA, Rosen MA, et al. Neoadjuvant Chemotherapy for Breast Cancer: Functional Tumor Volume by MR Imaging Predicts Recurrence-free Survival-Results from the ACRIN 6657/CALGB 150007 I-SPY 1 TRIAL. Radiology 279:44–55, 2016
- Hylton NM, Blume JD, Bernreuter WK, et al. Locally advanced breast cancer: MR imaging for prediction of response to neoadjuvant chemotherapy--results from ACRIN 6657/I-SPY TRIAL. Radiology 263:663–72, 20125.
- Li W, Wilmes LJ, Onishi N, et al. The additive value of quantitative contralateral background parenchymal enhancement for prediction of treatment response in the I-SPY 2 TRIAL. Submitted to ISMRM 2020.
- Klifa C, Carballido-Gamio J, Wilmes L, et al. Quantification of breast tissue index from MR data using fuzzy clustering. Conf Proc IEEE Eng Med Biol Soc. 2004; 3:1667-70.
- Dong JM, Wang HX, Zhong XF, et al. Changes in background parenchymal enhancement in HER2-positive breast cancer before and after neoadjuvant chemotherapy: Association with pathologic complete response. Medicine (Baltimore). 2018 Oct;97(43):e12965.
Figures
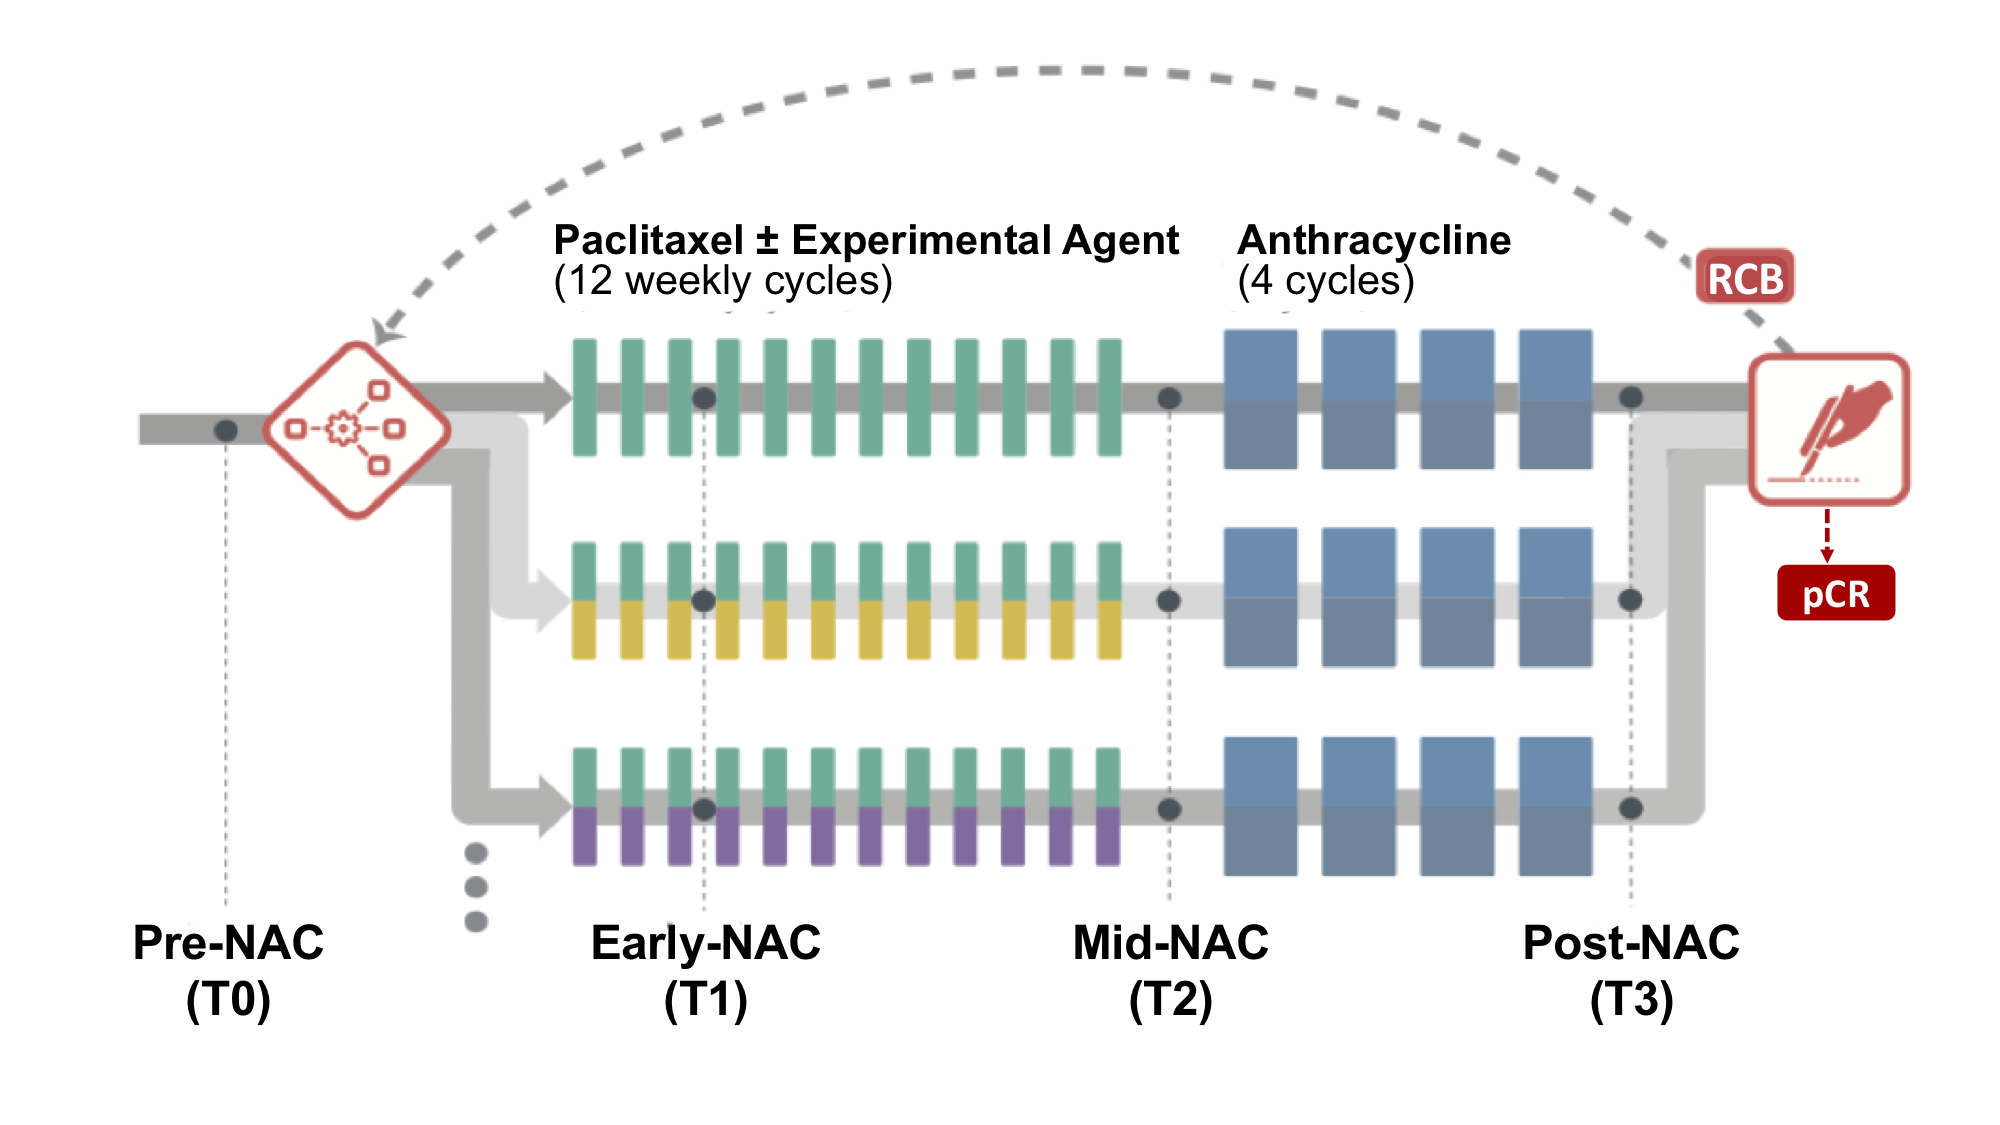
Figure 1: DCE-MRI was acquired four times for each patient: pre-treatment (T0), early-treatment (T1, 3 weeks after the start of treatment), inter-regimen (T2, after completion of the first NAC regimen and before the second regimen), and pre-surgery (T3, after completion of both regimens).
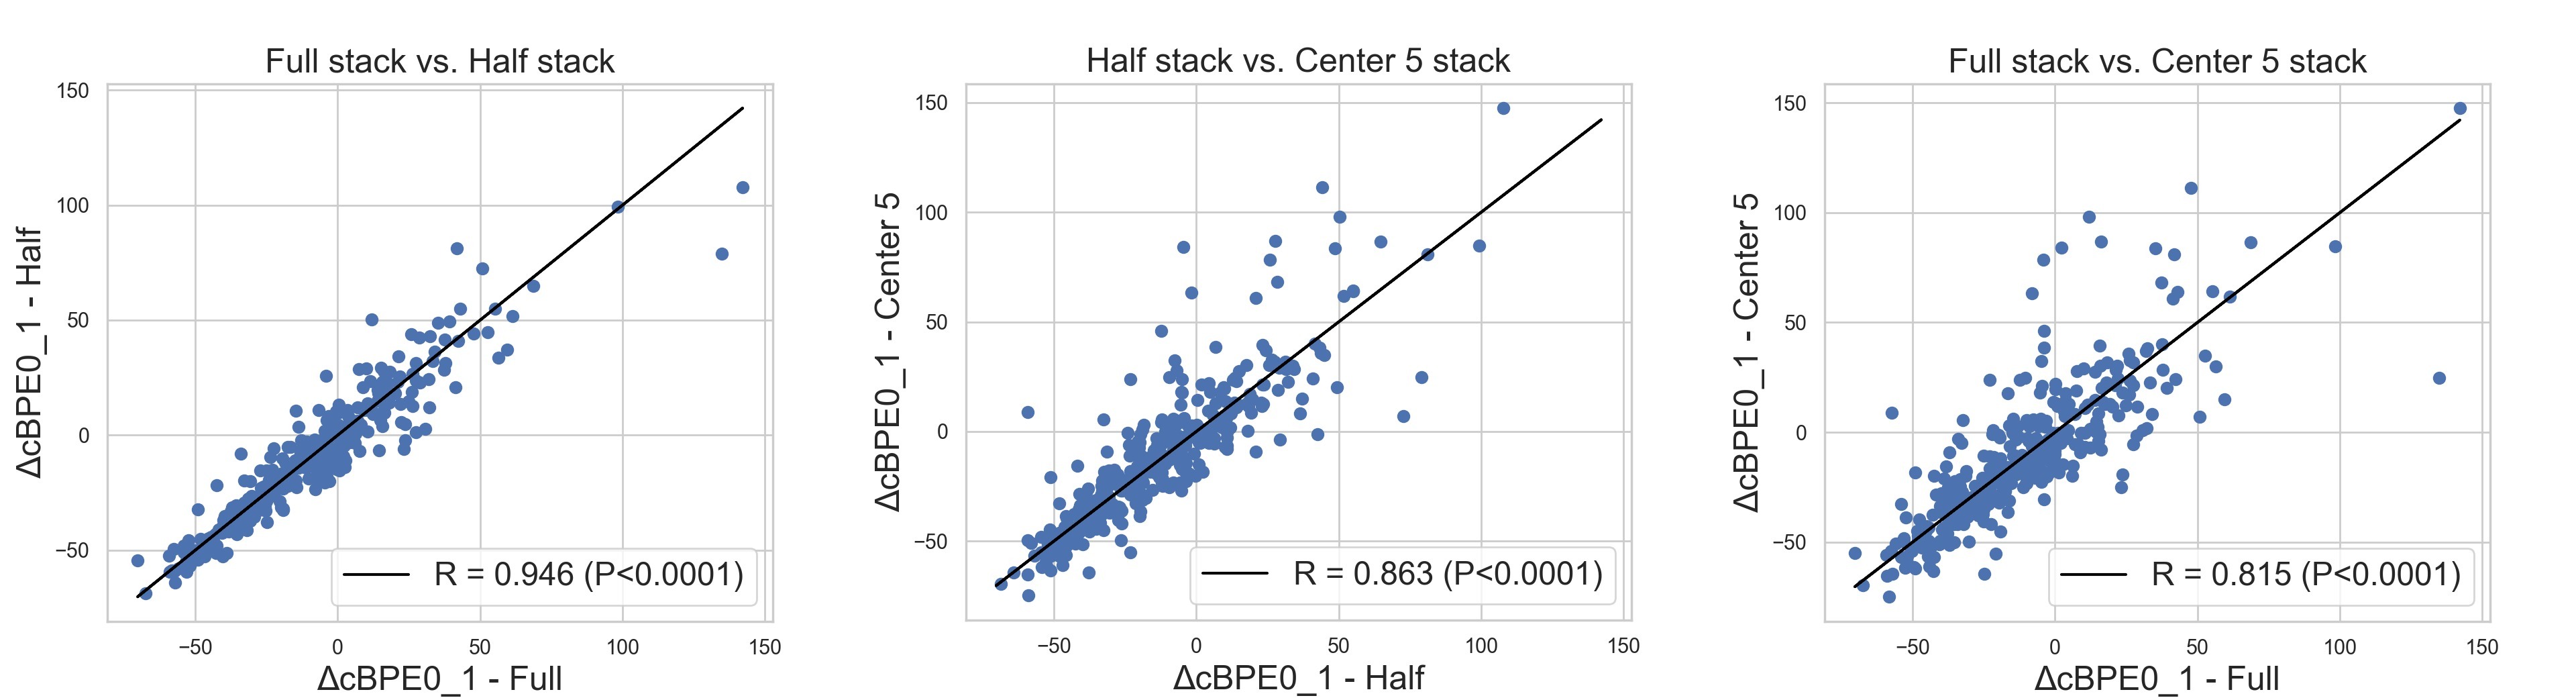
Figure 2: Pearson’s linear correlation between the three segmentation methods.
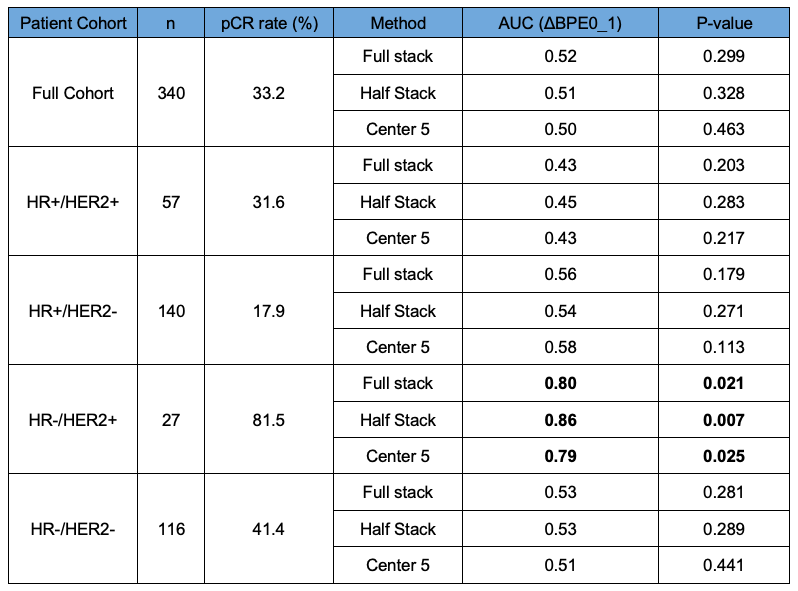
Figure 3: AUCs from logistic regression using percent change in mean cBPE as a predictor for pCR.