2371
Assessment of interstitial membrane permeability using a generalized model of 129Xe septal uptake in the lung1Institute of Diagnostic and Interventional Radiology, Hannover Medical School, Hannover, Germany, 2Biomedical Research in Endstage and Obstructive Lung Disease Hannover (BREATH), German Center for Lung Research (DZL), Hannover, Germany, 3Department of Respiratory Medicine, Hannover Medical School, Hannover, Germany, 4Clinical Airway Research, Fraunhofer Institute for Toxicology and Experimental Medicine, Hannover, Germany
Synopsis
The hyperpolarized 129Xe chemical shift saturation recovery (CSSR) method combined with mathematical models of gas uptake provides unique insights into lung microstructure and function. Here, we propose a generalization of the Patz model for assessing interstitial membrane permeability. We test the model’s potential for in-vivo determination of membrane permeability by fitting to CSSR data from healthy volunteers and pulmonary hypertension (PH) patients. The obtained permeabilities lie between those estimated for O2 and CO2 in healthy volunteers and tend to be lower in PH. The proposed model enables the non-invasive assessment of interstitial barrier permeability and shows potential as diagnostic tool.
Introduction
The hyperpolarized 129Xe chemical shift saturation recovery (CSSR) method in combination with mathematical models of gas exchange provides unique insights into lung microstructure and function at the alveolar level. Established models of 129Xe septal uptake assume a constant diffusivity within the alveolar septum for simplicity although it seems likely the diffusivity is different within individual septal compartments, potentially obscuring the analysis. Here, we propose a generalization of the Patz model treating the interstitial barrier mathematically as an infinitely thin membrane, in which the diffusivity is allowed to differ from that in the blood. This model thereby allows for the assessment of membrane permeability given by the ratio of diffusivity and membrane thickness. We test its potential for in-vivo determination of membrane permeability by fitting the model to CSSR data from healthy volunteers and patients of pulmonary hypertension (PH).Theory
We solve the one-dimensional diffusion equation for 129Xe magnetization in pulmonary blood,$$\frac{\partial}{\partial t}m(x,t)=D_b\frac{\partial^2}{\partial x^2}m(x,t)$$
subject to the boundary conditions
$$D_b\frac{\partial}{\partial x}m(x,t)\rvert_{x=0}=\kappa(m(0,t)-\lambda m_0)$$
$$D_b\frac{\partial}{\partial x}m(x,t)\rvert_{x=L}=-\kappa(m(L,t)-\lambda m_0)$$
$$m(x,0)=0,$$
where $$$D_b=1.35\cdot 10^{-9}\mathrm{m}^2/\mathrm{s}$$$ denotes the 129Xe diffusivity in blood,1 $$$\kappa$$$ the membrane permeability, $$$L=8\mu\mathrm{m}$$$ the capillary diameter,2 $$$\lambda=0.13$$$ the xenon Ostwald coefficient in blood3 and $$$m_0$$$ the alveolar 129Xe gas magnetization.
This problem is mathematically equivalent to heat conduction in a rod subject to convection boundary conditions and has been studied in detail previously.4 The solution is found by making the substitution $$$m'(x,t)=m(x,t)-\lambda m_0$$$ and using the product ansatz $$$m'(x,t)=X(x)T(t)$$$:
$$m(x,t)=\lambda m_0+\sum_{n=1}^\infty c_n\left[\cos\left(\frac{\mu_nx}{L}\right)+\frac{B}{\mu_n}\sin\left(\frac{\mu_nx}{L}\right)\right]\exp\left(-\frac{D_b\mu_n^2}{L^2}t\right)$$
with
$$c_n=-\lambda m_0\frac{\int_0^L\mathrm{d}x\left[\cos\left(\frac{\mu_n x}{L}\right)+\frac{B}{\mu_n}\sin\left(\frac{\mu_n x}{L}\right)\right]}{\int_0^L\mathrm{d}x\left[\cos\left(\frac{\mu_n x}{L}\right)+\frac{B}{\mu_n}\sin\left(\frac{\mu_n x}{L}\right)\right]^2}=-2B\lambda m_0\frac{(-1)^{n+1}+1}{B^2+\mu_n^2+2B}$$
and the $$$\mu_n$$$ solve the transcendental equation
$$\cot(\mu_n)=\frac{1}{2}\left(\frac{\mu_n}{B}-\frac{B}{\mu_n}\right)$$
with the diffusional Biot number $$$B=\frac{\kappa L}{D_b}$$$.
Integrating the magnetization in the septum and treating blood flow as in 5, we obtain the relative 129Xe signal from the red blood cell (RBC) phase
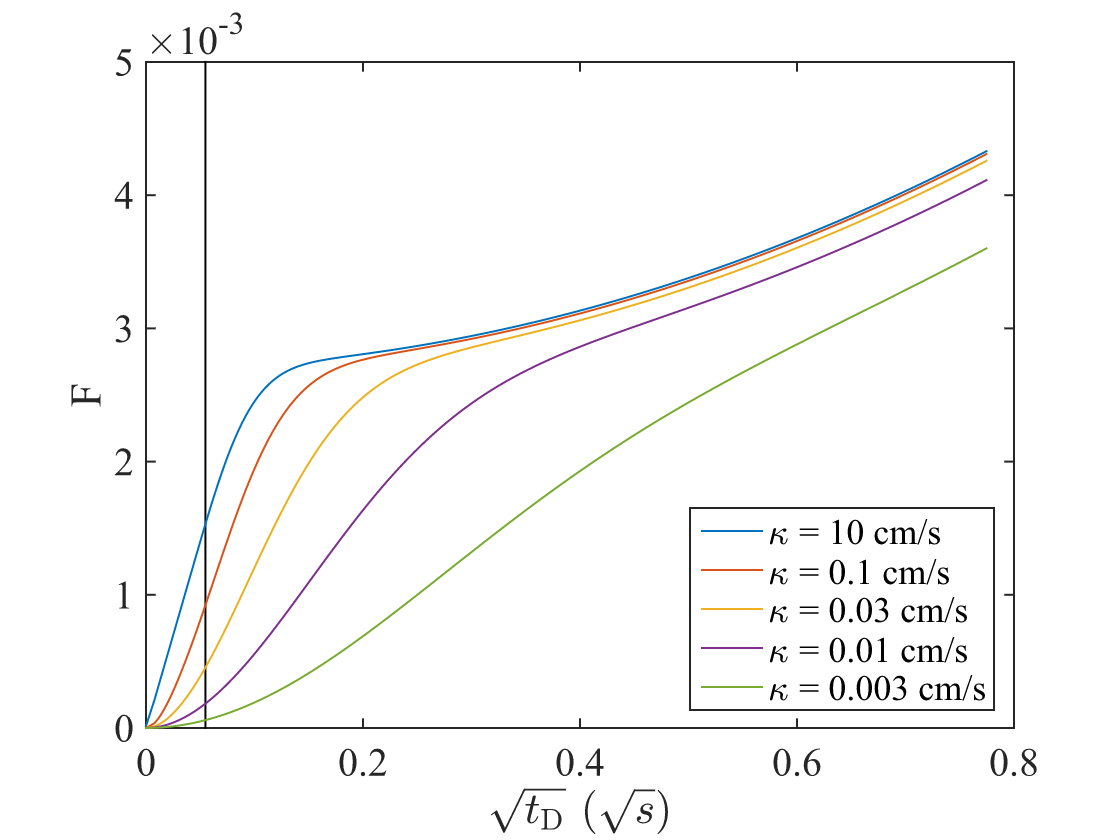
$$F(t)=\frac{\lambda L}{2}\eta\frac{S_a}{V_g}\frac{\tau-t}{\tau}\left[1-\sum_{n=1}^{\infty}\frac{(-1)^{n+1}+1}{B^2+\mu_n^2+2B}\frac{4B^2}{\mu_n^2}\exp\left(-\frac{D_b\mu_n^2}{L^2}t\right)\right]+\lambda L\eta\frac{S_a}{V_g}\frac{1}{\tau}\left[t+\sum_{n=1}^{\infty}\frac{(-1)^{n+1}+1}{B^2+\mu_n^2+2B}\frac{4B^2L^2}{D_b\mu_n^4}\left(\exp\left(-\frac{D_b\mu_n^2}{L^2}t\right)-1\right)\right].$$
with $$$\eta$$$ the RBC fraction of 129Xe in the dissolved phase, $$$\tau$$$ the capillary transit time and $$$S_a/V_g$$$ the surface-to-volume ratio. The well-known Patz model is contained in this model as special case since this function reduces to the Patz model function in the limit $$$\kappa\rightarrow\infty$$$, i.e. $$$B\rightarrow\infty$$$. An important difference is that for finite $$$\kappa$$$ and short times the proposed model does not reduce to the well-known Butler formula6, figure 1.
Methods
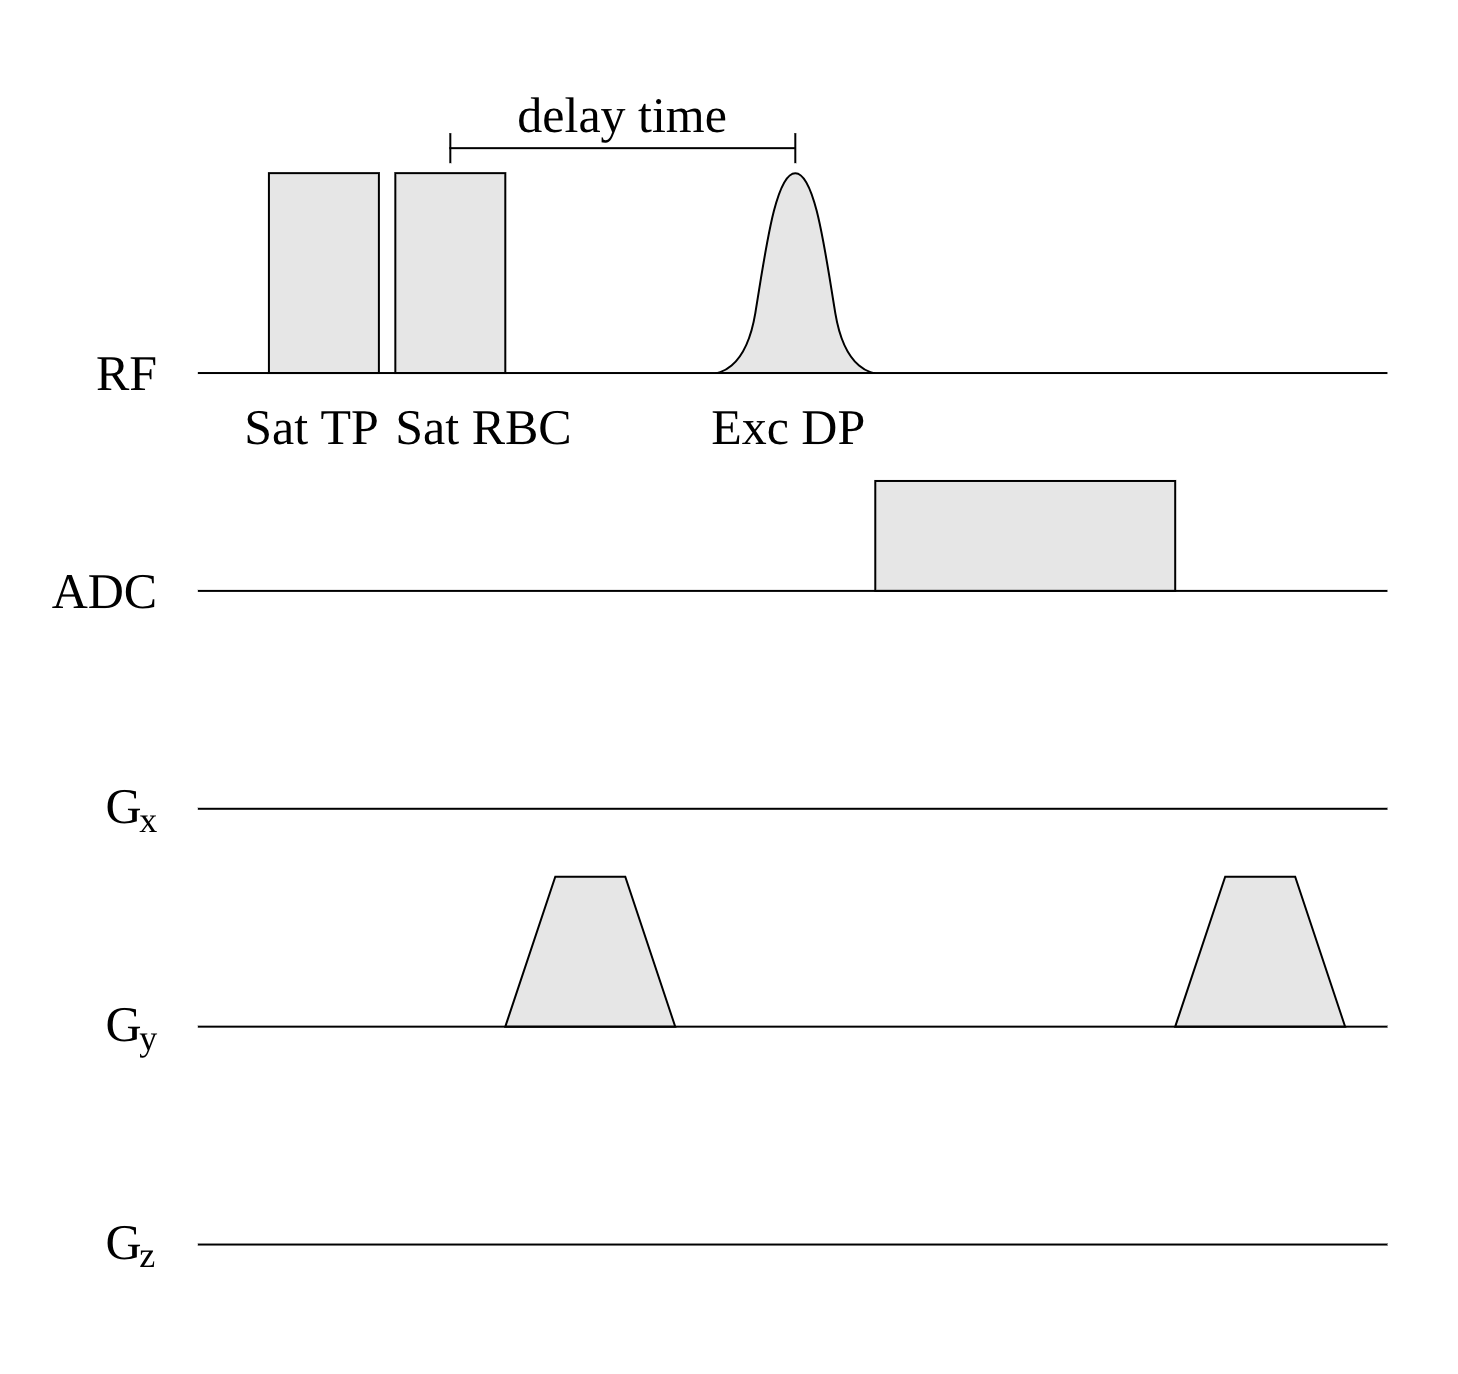
This study was approved by the institutional review board and all subjects gave written informed consent. 3 healthy volunteers and 5 PH patients were included. 129Xe MR spectroscopy data was obtained at 1.5 T (Avanto, Siemens Healthcare, Erlangen, Germany) using a custom-made 129Xe coil (Rapid Biomedical, Rimpar, Germany). Subjects inhaled 0.6 L of isotopically enriched 129Xe (Nukem Isotopes, Alzenau, Germany), hyperpolarized using a Polarean 9810 polarizer (Durham, NC, USA). See figure 2 for the CSSR sequence diagram.Since the function $$$F(t)$$$ depends on the solutions $$$\mu_n$$$ of a transcendental equation, it cannot be written in closed form. Fitting was thus performed using the unconstrained nonlinear optimization algorithm fminsearch of Matlab (R2014b, MathWorks, Ismaning, Germany). Only the RBC uptake data was used for fitting $$$F(t)$$$ to ensure that the signal originates solely from blood. The surface-to-volume ratio was used as external parameter obtained by fitting the well-known Butler formula to the sum of RBC and tissue/plasma (TP) data and assuming $$$D_t=3.3\cdot 10^{-10}\mathrm{m}^2/\mathrm{s}$$$7 and $$$\lambda=0.13$$$.
In addition, RBC amplitude oscillations from dynamic spectroscopy were determined similarly as previously described.8
Results
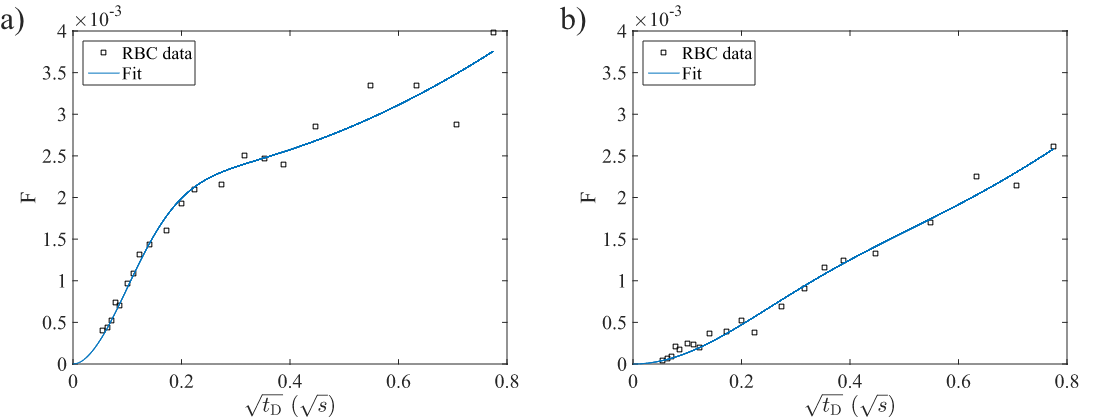
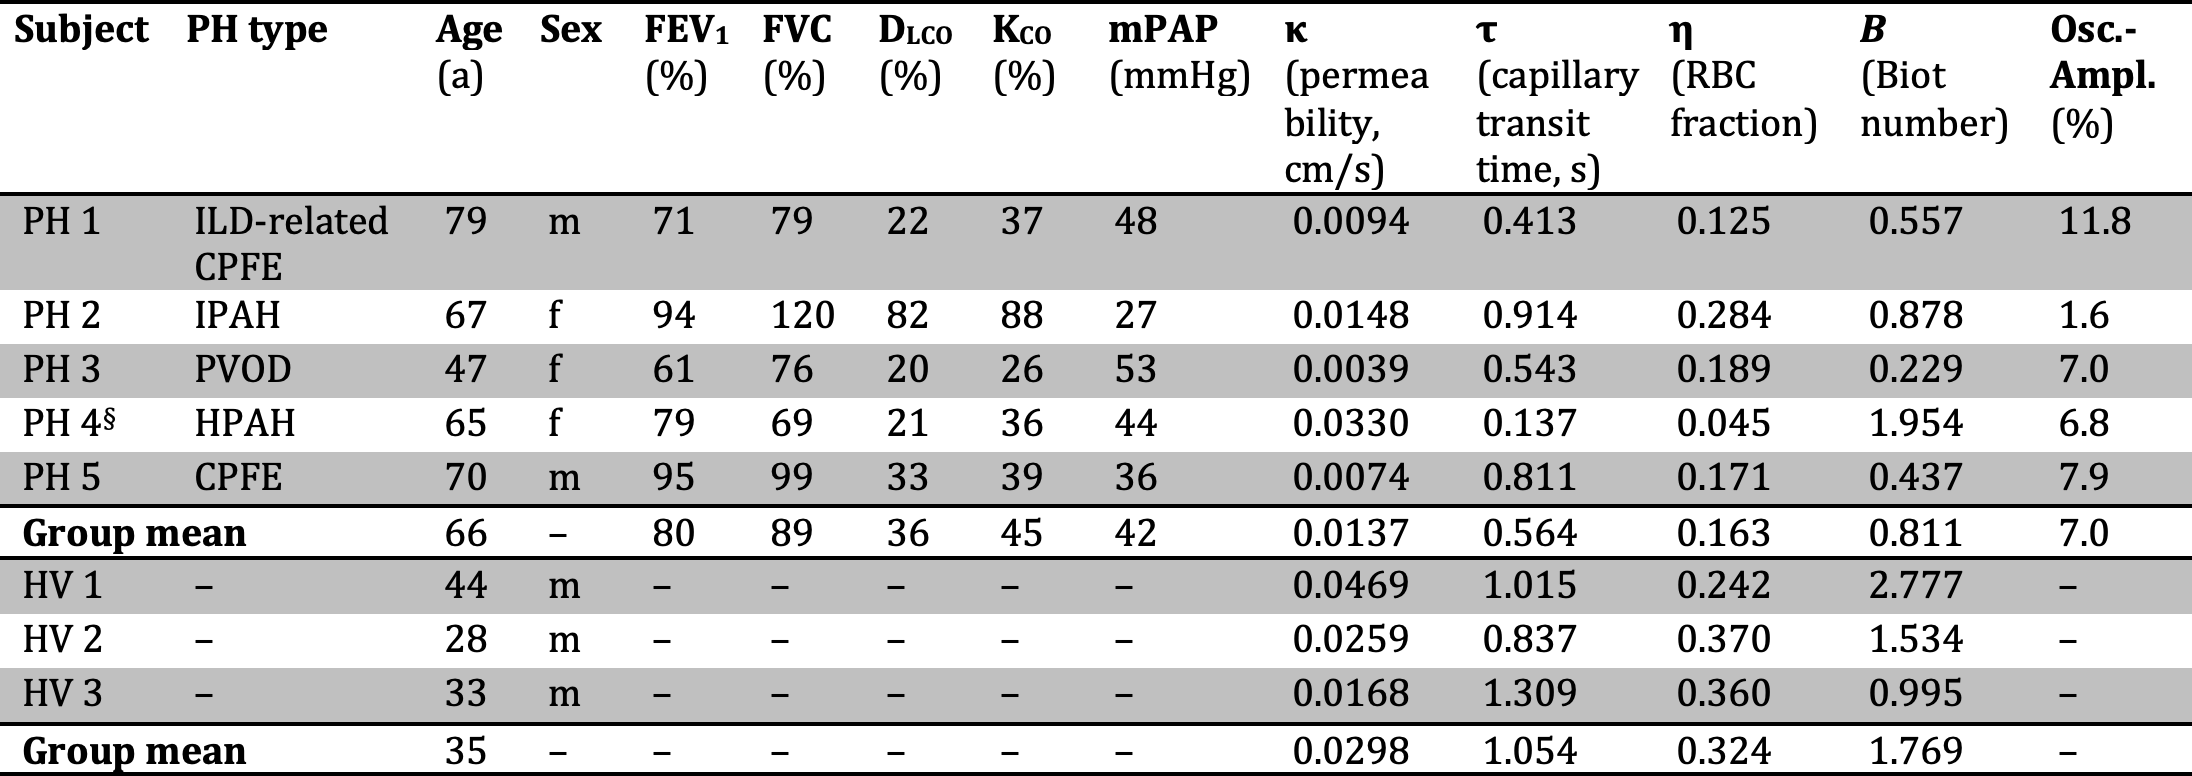
Figure 3 shows exemplary RBC uptake data and the fitted model function in a healthy subject and a PH patient. Subject demographics and fitting results from all subjects are summarized in table 1.Membrane permeability, capillary transit time and RBC fraction tended to be lower in PH patients compared to healthy volunteers. The amplitude of RBC signal oscillations tended to be lower in patients of idiopathic and hereditary pulmonary arterial hypertension compared to those with secondary PH.
Discussion
We have proposed a method for assessing interstitial membrane permeability noninvasively in the human lung. The permeability values in healthy volunteers lie between those estimated for O2 and CO2.9 The Biot numbers are close to 1 in most cases, indicating that gas uptake dynamics is indeed affected by finite membrane permeability.4Although the proposed model in principle allows for separate determination of $$$\kappa$$$ and $$$L$$$, we found that in the presence of realistic noise levels one can only determine one of both parameters with the other one fixed. The assumed $$$L$$$ is roughly the size of both a normal capillary and an individual RBC. While in real lung tissue capillaries may collapse,2 we would argue that such capillaries do not contribute substantially to the RBC signal.
While the permeability of the interstitial membrane to 129Xe is not of direct physiologic relevance, it seems possible to draw inferences on the permeability to other gases like O2 and CO2 by the known gas solubilities and Graham’s law of diffusion. This could enable the assessment of oxygen membrane diffusing capacity and effects like acinar diffusional screening.9
It was previously described that RBC oscillation amplitudes differ between subtypes of PH due to increased impedance of arterioles in pulmonary arterial hypertension.8
Conclusion
The proposed model enables the non-invasive assessment of interstitial membrane permeability to xenon in the human lung and shows potential as a diagnostic tool to distinguish PH subtypes.Acknowledgements
This work was funded by the German Center for Lung Research (DZL).References
1. Sta Maria N, Eckmann DM: Model Predictions of Gas Embolism Growth and Reabsorption during Xenon Anesthesia. Anesthesiology 2003;99:638–64.
2. West JB. Respiratory Physiology: The Essentials. Lippincott Williams & Wilkins 2008. ISBN 978-0-781-77206-8.
3. Ladefoged J, Andersen AM: Solubility of Xenon-133 at 37°C in Water, Saline, Olive Oil, Liquid Paraffin, Solutions of Albumin, and Blood. Phys Med Biol 1967;12:353–358.
4. Hahn DW, Özisik MN. Heat Conduction. John Wiley & Sons 2012. ISBN 978-1-118-33011-1.
5. Patz S, Muradyan I, Hrovat MI et al. Diffusion of hyperpolarized 129Xe in the lung: a simplified model of 129Xe septal uptake and experimental results. New J Phys 2011;13:015009.
6. Butler JP, Mair RW, Hoffmann D et al. Measuring surface-area-to-volume ratios in soft porous materials using laser-polarized xenon interphase exchange nuclear magnetic resonance. J Phys-Condens Mat 2002;14:L297–L304.
7. Ruppert K, Mata JF, Brookeman JF, Hagspiel KD, Mugler JP III. Exploring Lung Function With Hyperpolarized 129Xe Nuclear Magnetic Resonance. Magn Reson Med 2004;51:676–687.
8.
Wang
Z, Bier EA, Swaminathan A et al. Diverse Cardiopulmonary Diseases are
Associated with Distinct Xenon MRI Signatures. Eur Respir J 2019; in press.
9. Weibel ER, Sapoval B, Filoche M. Design of peripheral airways for efficient gas exchange. Resp Physiol Neurobi 2005;148:3–21.
Figures