2368
Does Pulmonary Gas Transport Affect Spatially-Resolved Alveolar Septal Wall Thickness Measurements with Hyperpolarized Xenon-129 MRI?
Kai Ruppert1, Faraz Amzajerdian1, Yi Xin1, Hooman Hamedani1, Luis Loza1, Tahmina S. Achekzai1, Ryan J. Baron1, Ian F. Duncan1, Harrilla Profka1, Yiwen Qian1, Mehrdad Pourfathi1, Federico Sertic1, Stephen Kadlecek1, and Rahim R. Rizi1
1Radiology, University of Pennsylvania, Philadelhia, PA, United States
1Radiology, University of Pennsylvania, Philadelhia, PA, United States
Synopsis
Septal wall thickness (SWT) measurements with hyperpolarized xenon-129 (HXe) MRI are typically conducted as spectroscopic acquisitions that lack spatial information. Recently, efforts have been made to obtain spatial maps of SWT. Here, we investigated differences in apparent lung physiology between peripheral and central lung regions and found an implausible change in observed capillary transit time and SWT from the periphery to the center of the lungs. This effect is likely caused by the transport of xenon-saturated blood towards the heart, and is not based on physiological differences, thus requiring a fundamental revision of analytical gas uptake models.
Purpose
Apparent alveolar septal wall thickness (SWT) measurements obtained with hyperpolarized xenon-129 (HXe) MRI are sensitive to inflammatory or fibrotic pathologies in the lung parenchyma1-7. Such measurements are typically conducted in the form of global spectroscopy acquisitions that lack spatial information. In recent years, efforts have been made to obtain regional maps of SWT8,9. However, the analytical models used to extract this metric from the acquired xenon gas uptake measures are all based on the assumption of unidirectional gas transfer from the alveoli to the lung parenchyma, with subsequent xenon accumulation in the downstream blood pool. While such assumptions are a reasonably accurate description for the lung as a whole when assessed with global spectroscopy, these prerequisites break down at the regional level, where the xenon signal in more central lung volumes might also be affected by inflowing blood from the periphery. In this work, we investigated whether there is a regional difference in the observed apparent gas uptake between peripheral and central lung regions.Methods
Imaging experiments were performed in sedated New Zealand rabbits (approx. 4 kg). Animals were ventilated with room air until imaging began, at which point the gas mix was switched to 20% oxygen and 80% HXe for 5 breaths (6 ml/kg tidal volume), followed by an 8-s breath-hold at either end inspiration (EI) or end expiration (EE). All studies were approved by the Institutional Animal Care and Use Committee.MR imaging was conducted using a 1D-projection gradient-echo sequence with left-to-right frequency encoding that employed a non-selective 700-μs Gaussian RF excitation pulse centered at the dissolved phase (DP) resonance 3,530 Hz downfield from the gas-phase resonance. Taking advantage of the large frequency difference between the two phases combined with a sufficiently small acquisition bandwidth, HXe in the pulmonary air spaces and dissolved in the lung tissue were imaged simultaneously, side-by-side10-12. The following sequence parameters were used: matrix size 1920×80; TE 2.6 ms; FOV 220 mm; receiver bandwidth 120 Hz/pixel; flip angle 7°, TR 10 ms (TR90°,equiv 1.3 s10). During the breath hold, the dissolved-phase magnetization was saturated 6 times every 500 ms with 3 consecutive 3-ms frequency-selective Gaussian RF pulses centered at 200 ppm and separated by 1.2 ms spoiler gradients. Septal wall thickness and capillary transit time were calculated using the analytical uptake model of Patz et al.13, based on the recovery of the averaged dissolved-phase signal following each saturation pulse. All MR studies were performed at 1.5T (Avanto; Siemens) using a custom xenon-129 transmit/receive birdcage coil (Stark Contrast, Erlangen, Germany). Enriched xenon gas (87% xenon-129) was polarized using a prototype commercial system (XeBox-E10, Xemed LLC, Durham, NH).
Results and Discussion
Figure 1a shows the normalized 1D DP signal in the rabbit lung as a function of time following saturation of the DP magnetization. The signal within the cardiac cavity was set to zero due to its low signal-to-noise ratio. For clarification, the DP signals of just the edges of the lung are plotted in Fig. 1b. While the xenon accumulation in the periphery of the lung levels off following the initial filling phase, the xenon signal at the center of the lung keeps increasing, indicating a continued inflow of DP magnetization from the blood flow towards the heart. These discrepancies in gas accumulation dynamics are reflected in an apparent drop of the extracted capillary transit time (Fig. 1c) and an apparent increase in alveolar SWT (Fig. 1d), respectively, from the periphery towards the center. Since in a healthy lung no such outside-in asymmetry of transit time and SWT is plausible, it most likely can be attributed to regional differences in gas transport dynamics.Conclusion
We demonstrated an implausible change in observed capillary transit time and SWT from the periphery to the center of the lungs. This effect is likely caused by the transport of xenon-saturated blood towards the heart, giving rise to an unaccounted signal increase that biases the model-based parameter extraction and is not based on physiological differences. Our measurements indicate that the assumptions underlying the existing analytical gas-transport models are violated in the case of spatially resolved SWT measurements. We therefore conclude that the extraction of consistent SWT maps from regional xenon gas uptake images necessitates a fundamental revision of these models.Acknowledgements
Supported by NIH grants R01 EB015767, R01 HL129805, S10 OD018203 and R01 CA193050.References
[1] Ruppert K et al. NMR of hyperpolarized 129Xe in the canine chest: spectral dynamics during a breath-hold. NMR Biomed 2000;13:220-228. [2] Butler JP et al. Measuring surface-area-to-volume ratios in soft porous materials using laser-polarized xenon interphase exchange nuclear magnetic resonance. J Phys Condens Matter 2002;14:L297-L304. [3] Qing et al. Assessment of lung function in asthma and COPD using hyperpolarized 129Xe chemical shift saturation recovery spectroscopy and dissolved-phase MRI. NMR in Biomed 2014;27(12):1490-1501. [4] Zhong et al. Simultaneous assessment of both lung morphometry and gas exchange function within a single breath‐hold by hyperpolarized 129Xe MRI. NMR in Biomed 2017; 30(8). [5] Doganay et al. Quantification of regional early stage gas exchange changes using hyperpolarized 129Xe MRI in a rat model of radiation-induced lung injury. Med Phys 2016;43(5):2410-2420. [6] Kern et al. Regional investigation of lung function and microstructure 129Xe chemical shift saturation recovery parameters by localized and dissolved‐phase imaging: A reproducibility study. MRM 2019; 81(1):13-24. [7] Ruppert et al. Using Hyperpolarized Xenon-129 MRI to Quantify Early-Stage Lung Disease in Smokers. Acad Radiol 2019; 26(3):355-366. [8] Kern et al. Mapping of regional lung microstructural parameters using 129 Xe dissolved‐phase MRI in healthy volunteers hyperpolarized and patients with chronic obstructive pulmonary disease. MRM 2018; 81(4):2360-2373. [9] Zanette et al. Physiological gas exchange mapping of hyperpolarized 129Xe using spiral-IDEAL and MOXE in a model of regional radiation-induced lung injury. Med Phys 2018;45(2):803-816. [10] Mugler et al. Simultaneous magnetic resonance imaging of ventilation distribution and gas uptake in the human lung using hyperpolarized xenon-129. Proc Natl Acad Sci USA 2010;107(50):21707-21712. [11] Ruppert et al. Assessment of Pulmonary Gas Transport in Rabbits Using Hyperpolarized Xenon-129 Magnetic Resonance Imaging. Scientific reports 8, 7310, doi:10.1038/s41598-018-25713-0 (2018). [12] Ruppert et al. Assessment of flip angle-TR equivalence for standardized dissolved-phase imaging of the lung with hyperpolarized 129Xe MRI. MRM 2019; 81(3):1784-1794. [13] Patz et al. Diffusion of hyperpolarized 129Xe in the lung: a simplified model of 129Xe septal uptake and experimental results. New J Physics 2011;13:015009.Figures
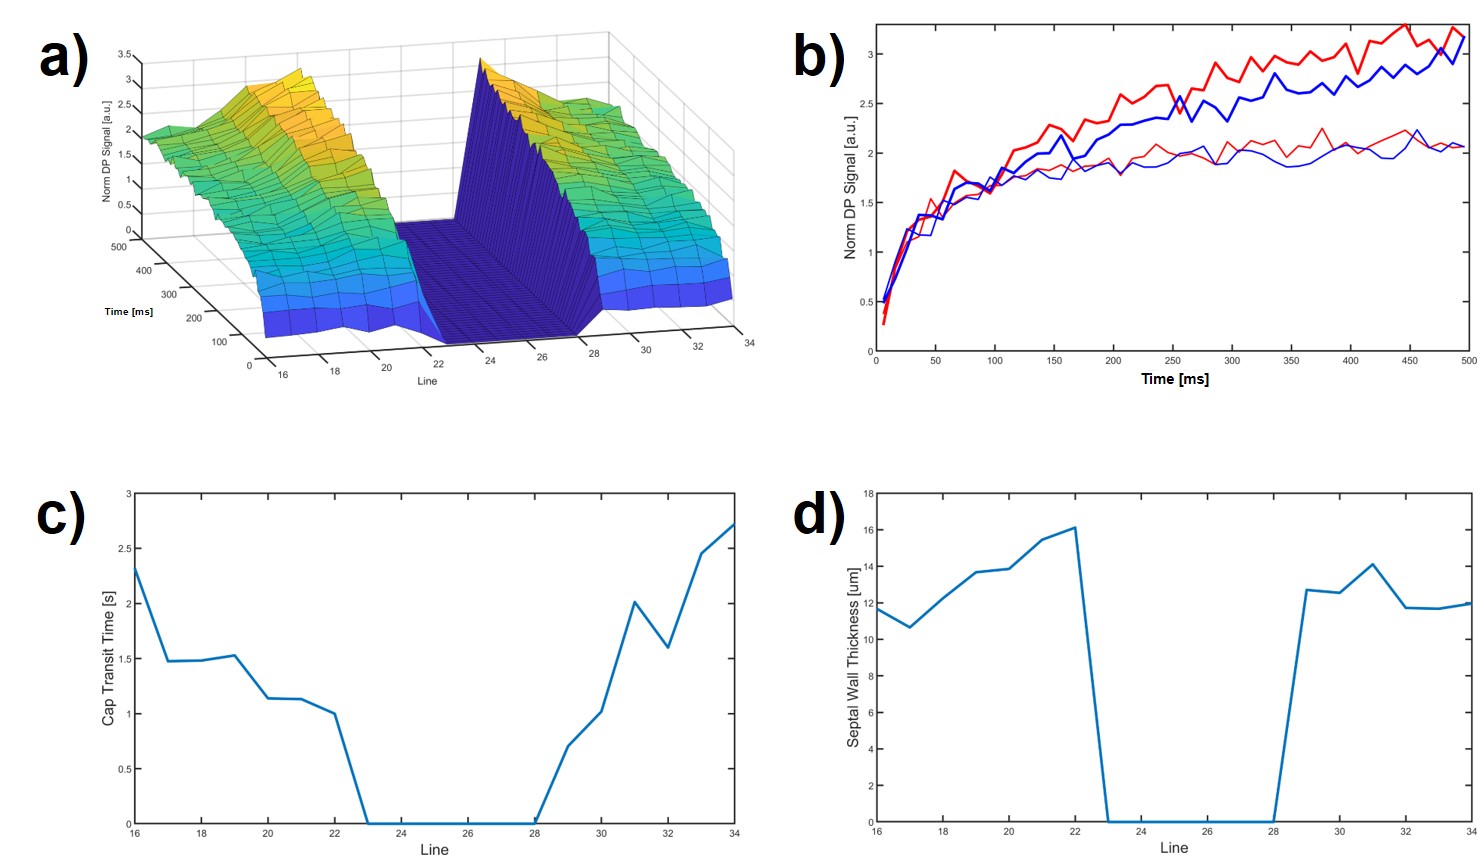
Figure 1. a) 1-dimensional xenon
gas uptake dynamics in the lung of a healthy rabbit. The signal in the cardiac
cavity was set to zero due to an insufficent signal-to-noise ratio; b) Differences
in gas uptake dynamics at the edges of the lung; c) Derived capillary transit
time associated with the gas uptake measurements in a); d) Derived SWT
associated with the gas uptake measurements in a).