2365
A Technique for Quantitative Measurement of Pulmonary Gas Uptake using Hyperpolarized 129Xe MRI in Free-Breathing Mice1Radiology, University of Pennsylvania, Philadelphia, PA, United States
Synopsis
Here we present an imaging technique for measuring regional gas uptake in a free-breathing mouse non-invasively. Gas- and dissolved-phase images were acquired simultaneously for a wide range of repetition times (13 ms up to 100 ms), and used to derive septal wall thickness measurements by fitting to a theoretical gas uptake model. The work shown here sets the groundwork for non-terminal longitudinal studies in rodent models of pulmonary radiation and fibrosis.
Introduction
Pulmonary septal wall thickness and gas transit time measurements using hyperpolarized 129Xe (HXe) MRI have enabled quantitative assessment of lung function. Previous studies using animal models of radiation-induced lung injury (RILI), for example, have shown such measurements to be sensitive to structural and functional changes during disease onset and progression1. However, such studies are limited by the fact that the intubation/tracheotomy procedures necessary for gas delivery are usually terminal. In this study, we demonstrate an imaging technique for non-invasively measuring global and regional gas uptake in free-breathing mice.Methods & Materials
Two C57BL/6 mice were anesthetized using 1-2% isoflurane and imaged in a 9.4T vertical-bore micro-imaging MRI system (Bruker Inc.) while free-breathing a normoxic gas mixture consisting of O2, isoflurane, and HXe gas administered via homemade gas delivery system. Gas and dissolved-phase images were acquired simultaneously using a respiratory-gated CSI sequence combined with a user-defined phase-encode/flip-angle table that utilized a rectangular RF pulse centered on the dissolved-phase such that the dissolved/gas peaks were subject to a 90º/5º flip angles, respectively. HXe uptake at different points in the gas exchange process was measured by acquiring images with different repetition times (TR values of 13 ms, 20 ms, 25 ms, 30 ms, 40 ms, 50 ms, 60 ms, 75 ms, and 100 ms). Individual k-space points were acquired in a series at end-exhale (3-9 points per breath depending on the TR), preceded by a dummy pulse that was used to eliminate magnetization accumulated during the non-imaged, inhale period. Gas- and dissolved-phase images were both normalized to the average gas signal within the lungs to account for the T1 decay of HXe during the course of imaging. Dissolved-to-gas (D:G) ratio maps were then fitted to a theoretical gas exchange and uptake model similar to that described in2 in order to derive regional septal wall thickness measurements.Results
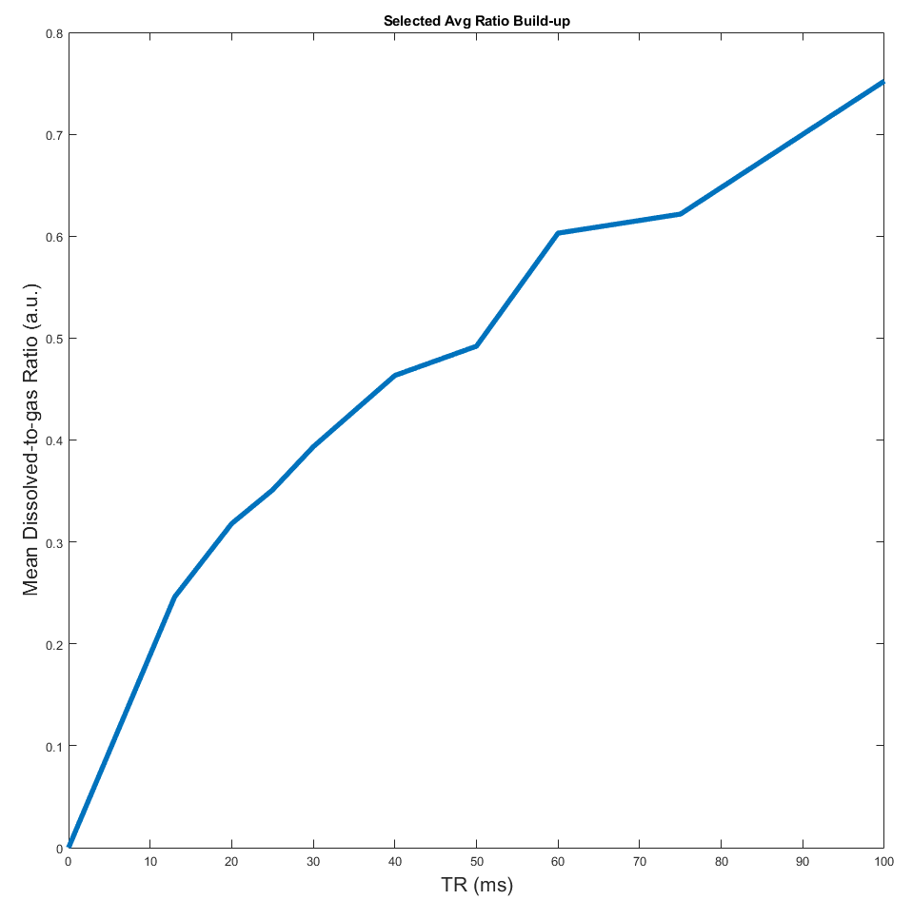
Figure 1 shows a representative plot of the average D:G ratio signal for images acquired with TRs increasing from 13 ms to 100 ms. The average D:G ratio increases with TR as expected, representing the gradual accumulation of signal as magnetization flows from the gas to dissolved compartments. This trend is corroborated by Figure 2, which displays representative projection axial D:G ratio maps for the same TRs as in Figure 1: similarly, as TR is increased, the global ratio for each of the maps increases. Figure 3A shows a septal wall thickness map derived from the images in Figure 2; as is apparent, there is a fairly homogenous distribution of values, where deviations are largely seen around the edges of the lung, as well as a few regions within the lung. Figure 3B shows a probability density function (PDF) displayed in a histogram plot for the septal wall thickness values shown in Figure 3A: while a few outliers can be seen, the majority of the values lie within 10 and 18 μm.Discussion
Septal wall measurements using HXe MRI have been carried out in many previous studies for the assessment of lung function in rodent models of RILI2, 3. However, no work has demonstrated such measurements in free-breathing mice without the use of mechanical ventilation. Acquisition of the functional measurements shown here are particularly useful since it reduces the number of animals used per study, and mitigates inter-cohort variability. Furthermore, the results shown here demonstrate the feasibility of acquiring such measurements under free-breathing conditions. Given the potential for differences, particularly in intrapulmonary blood volume during mechanical ventilation5, these conditions may be more representative of normal structure and physiology. Given a fixed flip-angle and increasing TR, the dissolved signal is expected to increase as demonstrated by both Figures 1 and 2. The mode of our septal wall thickness derived from the map in Figure 3A was 6 μm, and while it is in disagreement with a stereology-based assessment of the mouse septal wall thickness of approximately 4.91 ± 0.97 μm4, it is similar to previous HXe studies which calculated an average septal wall thickness of 12 ± 1.1 μm3. The discrepancy in our measurements are partially due to our model failing to account for pulmonary vasculature and non-symmetric geometric configurations of septal-wall-capillary boundaries, as well as intrinsic variations in animal breathing conditions during the course of imaging.Conclusion
In this work, we demonstrated a non-invasive imaging technique for measuring gas uptake over a range of TRs in free-breathing mice. Measurements of regional septal wall thickness were also obtained by fitting acquired images to a theoretical gas uptake model. Further work will apply this technique to rodent models of RILI and fibrosis to assess and characterize the onset and progression of lung injury longitudinally.Acknowledgements
No acknowledgement found.References
1Li, Haidong, et al. "Quantitative evaluation of radiation‐induced lung injury with hyperpolarized xenon magnetic resonance." Magnetic resonance in medicine 76.2 (2016): 408-416.
2 Patz, Samuel, et al. "Diffusion of hyperpolarized 129Xe in the lung: a simplified model of 129Xe septal uptake and experimental results." New Journal of Physics 13.1 (2011): 015009.
3 Li, Haidong, et al. "Quantitative evaluation of radiation‐induced lung injury with hyperpolarized xenon magnetic resonance." Magnetic resonance in medicine 76.2 (2016): 408-416.
4 Pozarska, Agnieszka, et al. "Stereological monitoring of mouse lung alveolarization from the early postnatal period to adulthood." American Journal of Physiology-Lung Cellular and Molecular Physiology 312.6 (2017): L882-L895.
5 Myziuk, Nicholas, et al. "Pulmonary blood mass dynamics on 4DCT during tidal breathing." Physics in Medicine & Biology 64.4 (2019): 045014.
Figures