2364
Quantify the Progression of Acute Lung Injury Induced by Lipopolysaccharide with Hyperpolarized 129Xe MR
Haidong Li1, Ming Zhang1, Hongchuang Li1, Xiuchao Zhao1, Yeqing Han1, Xianping Sun1, Chaohui Ye1, and Xin Zhou1
1National Center for Magnetic Resonance in Wuhan, Wuhan Institute of Physics and Mathematics, Innovation Academy of Precision Measurement Science and Technology, Chinese Academy of Sciences-Wuhan National Laboratory for Optoelectronics, Wuhan, China
1National Center for Magnetic Resonance in Wuhan, Wuhan Institute of Physics and Mathematics, Innovation Academy of Precision Measurement Science and Technology, Chinese Academy of Sciences-Wuhan National Laboratory for Optoelectronics, Wuhan, China
Synopsis
CT and PET should not be performed on patient repeatedly in short-term for monitoring the progression of diseases since the ionizing radiation and radioactivity. Herein, we tried to demonstrate the feasibility of hyperpolarized 129Xe MR for monitoring the progression of acute lung injury (ALI) in rats. Our results indicated hyperpolarized 129Xe MR has the potential to monitor the progression of ALI in rats.
Introduction
Compute tomography (CT) and positron emission tomography (PET) are currently widely used imaging modality in diagnosing pulmonary diseases in clinic. However, ionizing radiation and radioactivity limited these methods to repeatedly performed on patient in short-term. The lack of disease progression monitoring would increase the risk of the deterioration of the disease. As a non-invasive imaging modality, hyperpolarized (HP) 129Xe MR has been proven to be a useful tool for quantitatively evaluating the lung physiology and microstructure1-2. In this study, HP 129Xe diffusion-weighted imaging (DWI) and chemical shift saturation recovery (CSSR) spectroscopy were used to monitor the progression of the acute lung injury (ALI) induced by lipopolysaccharide (LPS) in rats, and the results were verified using pulmonary function tests (PFTs) and histopathological sections.Methods
A total of 20 Sprague-Dawley rats were equally divided into four groups, which included three experimental groups and one control group. The experimental groups were intratracheally instilled with LPS (3 mg/kg body weight) while the control group was treated with an equivalent amount (0.2 ml) of normal saline (NS). HP 129Xe MR, PFTs were performed on 2, 7, 14 days after instillation, wherein the control cohort was examined on day 2 to serve as the baseline. PFTs and HP 129Xe MR were performed in sequence. For PFTs measurement, the rat breathed spontaneously after connected to a Forced Maneuvers system (CRFM 100; EMMS, UK). For HP 129Xe MR experiments, oxygen and HP 129Xe (85% enriched, polarized to ~20%) were administered alternately to the rat lungs with a home-built HP gas delivery system. For HP 129Xe DWI experiments, the acquisition parameters were as follow: FOV=5 cm, matrix=64×64, α=10°, TE=3.62 ms, ramp up/down time=0.123 ms, constant time=1.2 ms, diffusion time=0.8 ms and five b value of 0, 8, 16, 24, and 32 s/cm2 were used. Lung microstructure parameters were obtained by fitting the data of DWI to the cylinder model3. For HP 129Xe CSSR experiments, 24 exchange time points ranging from 2 ~ 400 ms were used. Lung physiological parameters were obtained by fitting the data of CSSR to the model of xenon exchange (MOXE)4. After the experiments, the rat was sacrificed and the lung was extracted to evaluate the pulmonary changes by histopathology sections.Results
The comparison of the CSSR results among the different groups was shown in figure 1. Compared with the baseline (NS), exchange time constant (T), septal wall thickness (d) and thickness of air-blood barrier (δ) increased on day 2 and day 7, wherein the T and d have reached its maximum on day 2, and then, T and d decreased. On the contrary, the blood hematocrit (Hct) and fraction RBC xenon in blood (η) decreased firstly and then increased. The red star represents the value was significantly different compared with that in baseline. The similar trend was also found in the results of PFTs, however, the significant difference was only found in function residual volume on day 7 and forced vital capacity, total lung capacity and quasi-static pulmonary compliance on day 14. Figure 2 showed the representative microstructure maps of the rats from each group, and the inner radius (r), outer radius (R) and mean linear intercept (Lm) of the alveoli increased and surface to volume ratio (SVR) decreased on day 14, but no changes were observed on day 2 and day 7 compared to that of the baseline.Discussion and Conclusion
In this study, HP 129Xe MR and PFTs were employed to monitor the progression of ALI caused by LPS. The measured T and d increased while Hct and η decreased from day 2 to day 7 after LPS treatment. This might contribute to the thickening of the septal thickness caused by inflammation. The decrease of T and d and increase of Hct and η on day 14 were possibly due to the regression of inflammation. Although the similar trend was observed in PFTs, the significant difference in the early time between the groups was only found in CSSR. Moreover, the microstructural maps driven from DWI only showed significant difference on day 14. These results indicated that the HP 129Xe MR has the potential to monitor the disease progression and CSSR is more sensitive to the early stage of the ALI than PFTs and HP 129Xe DWI.Acknowledgements
This work was supported by National Key R&D Program of China (2018YFA0704000), National Natural Science Foundation of China (81625011, 91859206, 21921004, 81601491), Key Research Program of Frontier Sciences, CAS (QYZDY-SSW-SLH018) and Hubei Provincial Natural Science Foundation of China (2017CFA013, 2018ACA143).References
- Li H, Zhang Z, Zhao X, et al. Quantitative evaluation of radiation-induced lung injury with hyperpolarized xenon magnetic resonance. Magn Reson Med 2016; 76: 408-416.
- Ruan W, Zhong J, Wang K, et al. Detection of the mild emphysema by quantification of lung respiratory airways with hyperpolarized xenon diffusion MRI. J Magn Reson Imaging 2017; 45: 879-888.
- Sukstanskii AL, Yablonskiy DA. Lung morphometry with hyperpolarized Xe-129: theoretical background. Magn Reson Med 2012; 67: 856-866.
- Chang YV. MOXE: a model of gas exchange for hyperpolarized Xe-129 magnetic resonance of the lung. Magn Reson Med 2013; 69: 884-890.
Figures
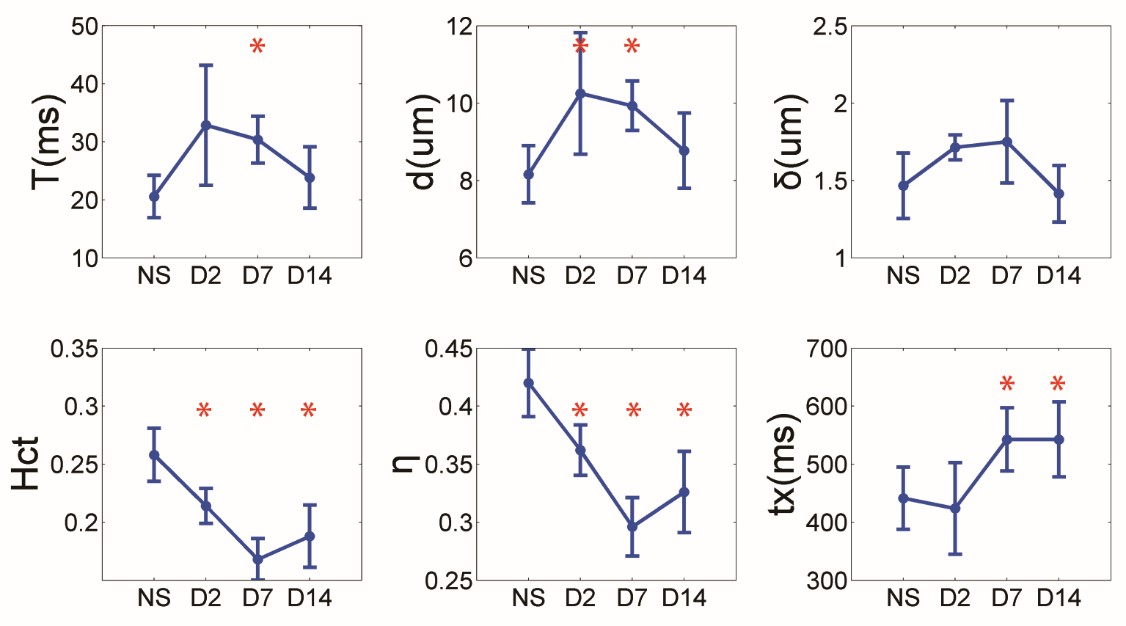
Figure 1. The comparison of the main physiological
parameters derived from MOXE. Each point on the line was shown in mean and
standard deviation (error bar). The red star represents that the parameter was
significantly different from the baseline.
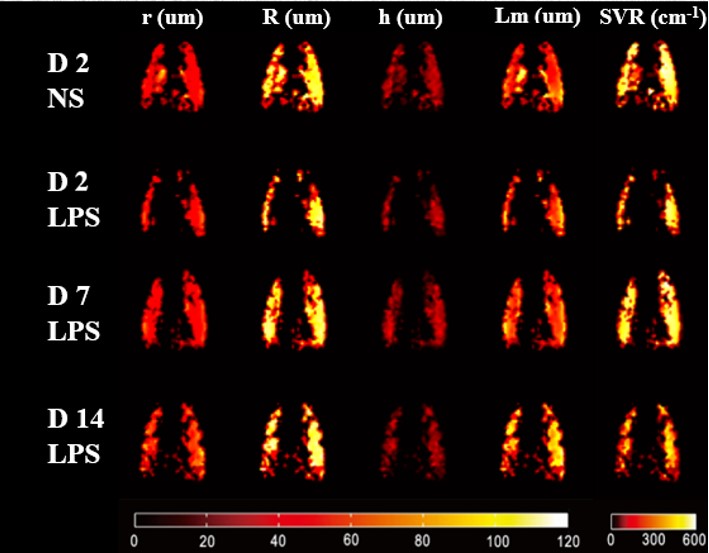
Figure 2. The representative microstructure parameters
maps derived from HP 129Xe diffusion images. From top row to bottom
row are maps from NS, LPS (D2), LPS(D7), and LPS(D14).