2363
3.0T Magnetic resonance for adult pulmonary tuberculosis
Qinqin Yan1, Shuyi Yang2, Jie Shen2, Shuihua Lu2, Fei Shan2, and Yuxin Shi2
1Radiology of Departemnt, Shanghai Public Health Clinical Center, Shanghai, China, 2Shanghai Public Health Clinical Center, Shanghai, China
1Radiology of Departemnt, Shanghai Public Health Clinical Center, Shanghai, China, 2Shanghai Public Health Clinical Center, Shanghai, China
Synopsis
Pulmonary tuberculosis is common chronic infectious disease, with a wide range of patients from infancy to the elderly. Currently, CT is the a commonly used method of examination, but radiation is not negligible. MRI as a non-radiative lesion, and functional measurement, can be used for tuberculosis examination and follow-up. This article provides a feasible examination plan for routine examination of tuberculosis via comparisons of T1-weighted Star vibe and standad vibe, and T2-weighted fBLADE and 3D SPACE.
Objectives
To optimize lung protocols of 3.0T magnetic resonance imaging(MRI) for evaluation of pulmonary tuberculosis(TB) in the clinical routine.Methods
42 patients who were diagnosed as pulmonary tuberculosis underwent CT and 3.0T MRI respectively. MRI lung protocols including the free-breathing T1WI StarVIBE, the multiple breath-hold VIBE, T2WI fBLADE and 3D SPACE were choosed and compared with image quality. The evaluation of image quality include SNR(signal to noise ratio), CNR(contrast to noise ratio) and 5-points scoring scale. 5-pionts scoring scale was evaluated by two radiologists and inter-observers agreement was calculated by cohen’s kappa(k). The SNR, CNR and 5-points scoring scale were compared using a two-tailed pared t-test. The detection rates and imaging findings were compared between CT and MRI. The detection rate of pulmonary abnormality was evaluated by Pearson’s Chi-square test.All analysis were evaluated by SPSS(version 19;IBM,Armonk,NY).Results
Inter-observers showed moderate agreement on 5-points scoring scale. T1WI free-breathing StarVIBE and multiple breath-hold VIBE performed as well with rare artifacts(P>0.05).T2WI fBLADE had significantly less artifacts than 3D SAPCE(P<0.05). T1WI free-breathing StarVIBE had better SNR(P<0.05)and identical CNR comparing with multiple breath-hold VIBE(P>0.05). T2WI fBLADE had statistically higher SNR(P<0.05) but inferior CNR comparing with 3D SPACE(P>0.05). MRI performed as good as CT in detecting most of pulmonary abnormality, with overall sensitivity of 51.29%, 90.62%, 100% for non-calcified nodules of size<5mm, 5-10mm, ≥10mm, 91.07% for calcified nodules and 78.57% for tree-in-bud sign. MRI has more advantages to show caseous necrosis, liquefaction, necrosis within cavity, alternations of lymph nodes and pleura.Conclusions
T1WI free-breathing StarVIBE and T2WI fBLADE with satisfied image quality is feasible for lung imaging especially for patients who have poor breath and wide range of lesios. Radiation-free MRI is an alternative tool for pulmonary TB imaging, especially for children, the elderly,the pregnant and patients who need long-term follow-up.Acknowledgements
No acknowledgement found.References
[1]Herzog H. History of tuberculosis. Respiration 1998; 65: 5-15. Available at : http://www.karger.com/ Article/PDF/29220, accessed on 11.9.10.[2]Boire NA, Riedel VAA, Parrish NM, et al. Tuberculosis: from an untreatable disease in antiquity to an untreatable disease in modern times. J Anc Dis Prev Rem 2013; 1 (2): 1-11. Available at : http://www.esciencecentral.org/journals/2329-8731/2329-8731-1-106.pdf , accessed on 11.9.13.[3]Brenner, D.J., Radiation risks potentially associated with low-dose CT screening of adult smokers for lung cancer. Radiology, 2004. 231(2): p. 440-445.[4]Mccunney, R.J. and J. Li, Radiation Risks in Lung Cancer Screening Programs. Chest, 2014. 145(3): p. 618-624.[5]Rampinelli, C., et al., Exposure to low dose computed tomography for lung cancer screening and risk of cancer: secondary analysis of trial data and risk-benefit analysis. Bmj, 2017. 356: p. j347.[6]Biederer, J., et al., Screening for lung cancer: Does MRI have a role? European Journal of Radiology, 2017. 86: p. 353-360.[7]Meier-Schroers, M., et al., Lung cancer screening with MRI: characterization of nodules with different non-enhanced MRI sequences. Acta Radiologica, 2018: p. 284185118778870.[8]Schroeder, T., et al., Detection of pulmonary nodules using a 2D HASTE MR sequence: comparison with MDCT. Ajr Am J Roentgenol, 2005. 185(4): p. 979-984.[9]Dewes, P., et al., Comparative evaluation of non-contrast CAIPIRINHA-VIBE 3T-MRI and multidetector CT for detection of pulmonary nodules: In vivo evaluation of diagnostic accuracy and image quality. European Journal of Radiology, 2016. 85(1): p. 193-198.[10]Liney G P . MRI from picture to proton: second best?[J]. The Lancet Oncology, 2007, 8(5):384-384.[11]Kumar Shivani,Rai Robba,Stemmer Alto et al. Feasibility of free breathing Lung MRI for Radiotherapy using non-Cartesian k-space acquisition schemes.[J] .Br J Radiol, 2017, 90: 20170037.[12]Block KT, Chandarana H, Milla S, Bruno M, Mulholland T, Fatterpekar G, et al. Towards Routine Clinical Use of Radial Stack-of-Stars 3D Gradient-Echo Sequences for Reducing Motion Sensitivity. J Korean Soc Mag Resonan Med 2014; 18: 87–106.[13]Pipe JG. Motion correction with PROPELLER MRI: Application to head motion and free-breathing cardiac imaging. Magn Reson Med. 1999;42:963–969.[14]Pandit Prachi,Qi Yi,King Kevin F et al. Reduction of artifacts in T2 -weighted PROPELLER in high-field preclinical imaging.[J] .Magn Reson Med, 2011, 65: 538-43.[15]Mulkern RV, Wong ST, Winalski C, Jolesz FA. Contrast manipulation and artifact assessment of 2D and 3D RARE sequences. Magn Reson Imaging 1990;8:557–566.[16]Mulkern RV, Melki PS, Jakab P, Higuchi N, Jolesz FA. Phase-encode order and its effect on contrast and artifact in single-shot RARE sequences. Med Phys 1991;18:1032–1037.[17]Danieli L,Riccitelli G C,Distefano D et al. Brain Tumor-Enhancement Visualization and Morphometric Assessment: A Comparison of MPRAGE, SPACE, and VIBE MRI Techniques.[J] .AJNR Am J Neuroradiol, 2019, undefined: undefined.[18]Arizono S, Isoda H, Maetani Y S, et al. High-spatial-resolution three-dimensional MR cholangiography using a high-sampling efficiency technique (SPACE) at 3T: comparison with the conventional constant flip angle sequence in healthy volunteers [J]. Journal of Magnetic Resonance Imaging, 2008, 28(3): 685-690.[19]Gold G E, Busse R F, Beehler C, et al. Isotropic MRI of the knee with 3D fast spin-echo extended echo-train acquisition (XETA): initial experience [J]. American Journal of Roentgenology, 2007, 188(5): 1287-1293.][Rosenkrantz A B, Patel J M, Babb J S, et al. Liver MRI at 3 T using a respiratory-triggered time-efficient 3D T2-weighted technique: impact on artifacts and image quality [J]. American Journal of Roentgenology, 2010, 194(3): 634-641.[20]Chassagnon Guillaume,Martin Charlotte,Ben Hassen Wadie et al. High-resolution lung MRI with Ultrashort-TE: 1.5 or 3 Tesla?[J] .Magn Reson Imaging, 2019, 61: 97-103.[21]Dournes G , Grodzki D , Macey J , et al. Quiet Submillimeter MR Imaging of the Lung Is Feasible with a PETRA Sequence at 1.5 T[J]. Radiology, 2015, 276(1):258-265.[22]Laqmani A , Avanesov M , Butscheidt S , et al. Comparison of image quality and visibility of normal and abnormal findings at submillisievert chest CT using filtered back projection, iterative model reconstruction (IMR) and iDose4?[J]. European Journal of Radiology, 2016, 85(11):1971-1979.[23]Pipe J G,Motion correction with PROPELLER MRI: application to head motion and free-breathing cardiac imaging.[J] .Magn Reson Med, 1999, 42: 963-9.[24]Chung, M., H.S. Lee and S. Park, MR imaging of solitary pulmonary lesion: emphasis on tuberculomas and comparison with tumors. Journal of Magnetic Resonance Imaging, 2015. 11(6): p. 629-637.[25]Sze G, Zimmerman RD. The magnetic resonance imaging of infec-tions and inflammatory diseases. Radiol Clin North Am 1988;26:839 – 859.[26]De Backer A I,Mortelé K J,Van Den Heuvel E et al. Tuberculous adenitis: comparison of CT and MRI findings with histopathological features.[J] .Eur Radiol, 2007, 17: 1111-7.Figures
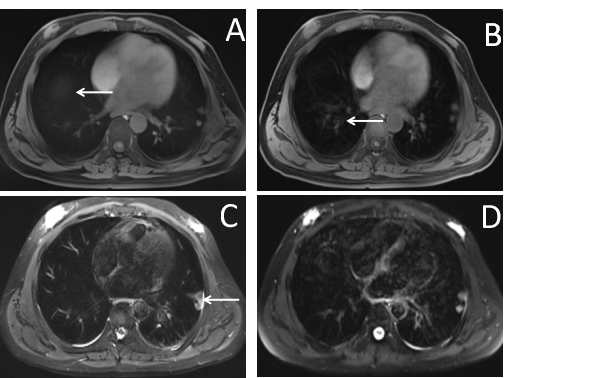
Fig1.A was rated as 5-points with almost no artifacts in Star vibe. (→means the dome).Fig1.B was rated as 4-points in standard Vibe with minimal artifacts(→) . Fig1.C was rated as 5-points with almost no artifacts in fBLADE. Fig1.D was rated as 4-points with little motion artifacts in 3D SPACE.
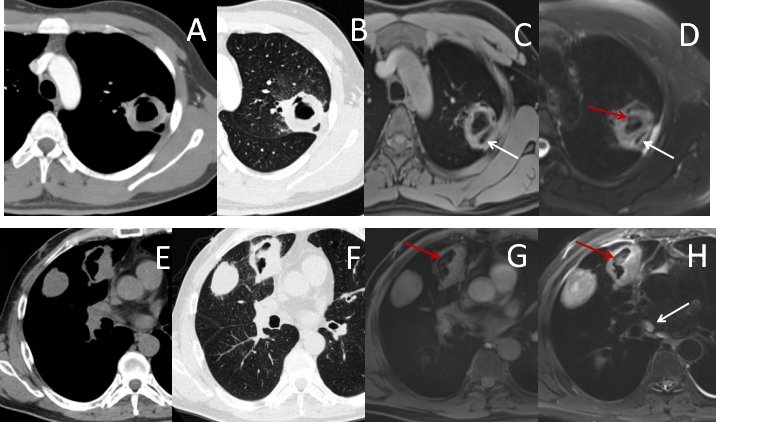
CT images(A and B) showed thick-walled cavity. Peripherally dilated draining bronchus were clearly described on MRI images(C and D). Additionally, local pleural effusion was seen on T2-weighted images(D). CT images(E and F) showed cavity within mass. Necrotic material and two small lymph nodes(<1cm) was seen on MRI images(G and H).
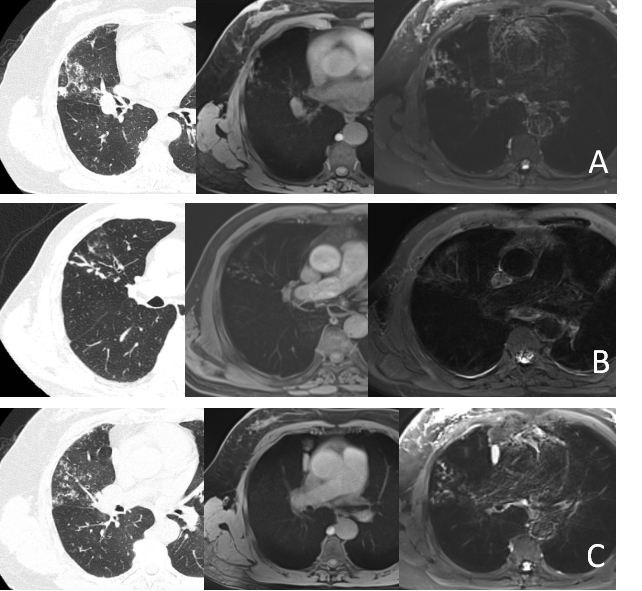
Fig3A. Tree-in-bud sign was partial display in T1-weighted and full display in T2-weighted. Fig3B. Tree-in-bud sign was full display in T1-weighted and false negative in T2-weighted. Fig3C. Tree-in-bud sign was not display at all in T1-weighted and full display in T2-weighted.