2359
Same-day reproducibility of quantitative lung perfusion metrics in patients with IPF1POLARIS, Department of Infection, Immunity and Cardiovascular Disease,, The University of Sheffield, Sheffield, United Kingdom, 2Sheffield Teaching Hospitals Foundation Trust, Academic Directorate of Respiratory Medicine, Sheffield, United Kingdom, 3Insigneo Institute for in silico Medicine, The University of Sheffield, Sheffield, United Kingdom
Synopsis
Recent work in assessing patients with idiopathic pulmonary fibrosis suggests that vascular changes, as assessed by dynamic contrast enhanced lung MRI, are a useful marker to assess disease progression. Therefore this work aimed to develop an image processing pipeline to assess same-day intra-participant reproducibility of quantitative perfusion metrics in a cohort of patients with idiopathic pulmonary fibrosis. From the data here it suggests that these quantitative metrics are not reproducible, even when patients are scanned on the same day.
Intorduction
Dynamic contrast enhanced MRI (DCE-MRI) is a well-known method for assessing perfusion of multiple organs within the body1-3. Numerous respiratory diseases affect perfusion within the lung, with some work showing that DCE-MRI is able to detect perfusion changes in idiopathic pulmonary fibrosis (IPF)4,5. Therefore this work aimed to create an image processing workflow for assessment of quantitative pulmonary perfusion metrics (blood volume (PBV), blood flow (PBF) and transit time (TT)) in a small cohort of patients with IPF.Purpose
To assess the same-day intra-participant reproducibility of quantitative perfusion metrics in a small group of patients with IPF.Methods
This retrospective study utilised data from five patients with IPF6 scanned at 1.5T (GE HDx, Milwaukee, WI).Imaging: Patients were positioned in an 8-element 1H chest receiver coil. In order to map T1 and magnetisation density, 3D SPGR images were first acquired during three separate inspiratory breath holds with flip angles of 2°, 10° and 30° with an acquisition matrix of 200x80, TR of 2.85ms and a TE <1ms during the first imaging session only. DCE perfusion images were then acquired at end inspiratory breathold with 36 time-frames at approximately 0.5 seconds per volume (full lung coverage) using a 3D SPGR sequence with TRICKS7 and SENSE8 factor 2 using an acquisition matrix of 200x80, BW of ±125kHz, TE <0.9ms, TR <2.3ms and a flip angle of 30°. Imaging began at the same time as the injection of Gadovist (0.05ml/kg injected at 4ml/s followed by a saline flush of 20ml at the same flow rate). Patients were scanned using the DCE perfusion image sequence twice on the same day with an interval of 155.2±26.2 minutes between contrast injections.
Image Analysis: The flip angle image acquired in the first imaging session for each patient (FA=2°) was used as the target image for DCE images. Prior to co-registering DCE perfusion images to the 2° image, the 2° image was down-sampled to match the number of DCE perfusion acquisition slices. All image registration was carried out using the ANTs registration toolbox9. For calculation of baseline longitudinal relaxation and magnetisation density (T1,0 and M0, respectively) a non-linear least squares algorithm was implemented in Matlab, where each voxel in the three flip angle images was fitted to the standard SPGR signal equation10. For perfusion quantification each voxel within the lung, defined via manual segmentation of the first phase of the DCE perfusion acquisition, was fit to a gamma variate11 function with singular value decomposition being used to calculate PBV, PBF and TT12. Major vessels were removed semi-automatically using a thresholding algorithm and manual correction. Median values of PBV, PBF and TT are reported along with the interquartile range (IQR).
Results
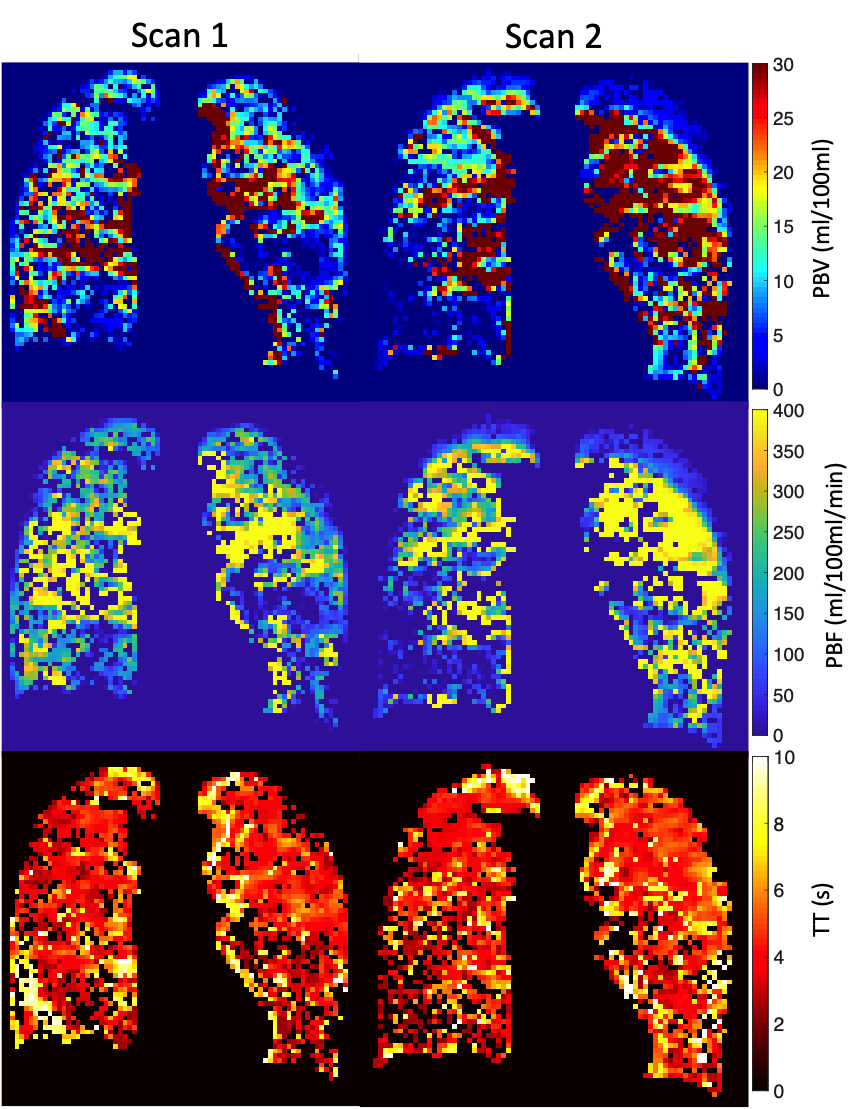
Figure 1 shows the change in perfusion parameters. Three of five patients had an increase in whole-lung median PBV at scan 2 when compared to scan 1, whilst four of five had an increased median PBF. All patients displayed a reduction in TT at scan 2 when compared to scan 1. Changes in the IQR of PBV and PBF followed the patterns of change in median PBV and PBF, however two of the five patients had a minor increase in the IQR of TT. Between acquisitions (Scan 2 – Scan 1) the mean absolute difference of lung volume was 0.15L (range 0.04-0.21). Figure 3 shows example central slices form the 3D parametric maps for patient IPF01, emphasising the poor repeatability seen in Figure 1.Discussion and Conclusions
We have shown in the small cohort of IPF patients analysed here that reproducibility of quantitative pulmonary perfusion measures is generally poor, although as shown in the Bland-Altman plots in Figure 2, the bias is relatively small, however this is offset by relatively large limits of agreement. The results of reproducibility in patients with IPF follows previous results seen in the lungs of healthy volunteers13-15, namely that breathold quantitative perfusion parameters are not reproducible. Interestingly the changes in perfusion metrics between scans in these patients was generally lower than those reported by Ingrisch et al.15 in their volunteer study. These changes could be due to many factors, including the use of different scanning hardware and analysis methodologies, but also due to the restrictive nature of IPF. As the disease progresses these patients will have reduced lung volumes over time and will find it more difficult to complete breathold manoeuvres. Changes in TT may also be due to some of the patients undergoing incremental shuttle walk testing in between scanning sessions, as although there was a rest period it is unknown how long perfusion would take to return to baseline levels. Possible changes to the methodology here include normalisation by lung volume similar to the treatment response method developed for ventilation images16, as it is well known that the level of inflation will have an effect on the perfusion parameters17, although as reported there is less than 200mL difference in lung volume on average difference between each scan. Despite these issues, the image registration method used here is robust to disease and allows voxel-by-voxel comparison of quantitative pulmonary perfusion.Acknowledgements
NIHR, MRC and GlaxoSmithKline (PJCH: BIDS3000032592) for fundingReferences
1. E.L. Barbier et al, JMRI, 2001, 13(4),496-520
2. C. Schoenfeld et al., Radiology, 2015, 279(3), 925-934
3. Y. Ohno et al., JMRI, 2004, 20(3), 353-365
4. N. Weatherley et al., BMJ, 2018, S73
5. N. Weatherley et al., ATS, 2018, A5925
6. H-F. Chan et al., Radiology, 2019, 291(1), 223-229
7. F. Korosec et al., MRM, 1996, 36(3), 345-351
8. K. Pruessman et al., 1999, MRM, 42(5), 952-962
9. B. Avants et al., Neuroimage, 2011, 54(3), 2033-2044
10. H. Chen et al., MRM, 2006, 55(3), 566-574
11. H.K. Thompson et al., Circ Res, 1964, 14(6), 502-515
12. L. Østergaard et al., MRM, 1996, 36(5), 715-725
13. A. Ter-Karapetyan et al., PloS one, 2018, 13(12), e0208587
14. J. Ley-Zaporozhan et al., J Thorac Imaging, 2011, 26(3), 230-239
15. M. Ingrisch et al., Invest Radiol , 2014, 49(6), 382-389
16. F. Horn et al., Radiology, 2017, 284(3), 854-861
17. C. Fink et al., Invest Radiol, 40(2), 72-79
Figures