2357
Functional Lung Investigation with Tiny Golden Angle Ultra-Short Echo-Time Stack of Stars (UTE STyGAS)1Department of Internal Medicine II, Ulm University Medical Center, Ulm, Germany
Synopsis
Deriving lung data with MRI is challenging due to several reasons, including short T2*, cardiac and respiratory motion, and low proton density. In this study, a tiny golden angle UTE stack-of-stars (UTE STyGAS) sequence was applied for quantification of lung parenchymal functional parameters, including proton fraction, fractional ventilation and perfusion. Data were acquired during free breathing and reconstructed applying an image-based self-gating technique.
Purpose
To investigate the feasibility of lung ventilation, perfusion and proton density quantification from self-gated tiny golden angle ultra-short echo-time stack-of-stars acquisitions.Introduction
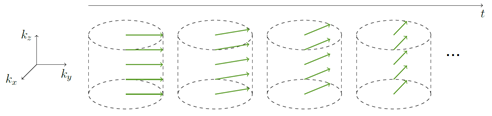
Due to short T2*, cardiac and respiratory motion, and low proton density MR imaging of the lung is still challenging. [1,2] Previous studies have shown that ultra-short echo-time (UTE) techniques are suitable for imaging short T2* tissue and have successfully been applied to lung imaging. [3–5] Thereby lung motion has been controlled either by breathholding or by self-gating. Even though promising, the long acquisition times in three-dimensional UTE, mainly caused by the isotropic field-of-view (FOV) and resolution, limits its practicability in clinical routine. In the UTE stack-of-stars (UTE SOS) technique, UTE in-plane encoding is combined with thru-plane Fourier encoding, thus combining ultra-short TE acquisitions with non-isotropic FOV and resolution and enabling a substantial reduction in data acquisition time, while slightly compromising minimal echo times. [6] In this contribution, the UTE SOS technique has been combined with tiny golden angle (UTE STyGAS) angular increments [7] and applied to quantify the fractional ventilation, perfusion and proton density by analysing the MR signal changes over the cardiac and respiratory cycle. [8,9]Methods
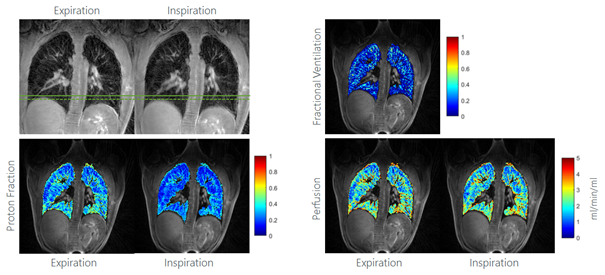
Data of seven healthy volunteers were acquired on a 3T MR whole-body system (Achieva 3.0T, Philips Healthcare, Best, The Netherlands), applying a UTE STyGAS in coronal orientation during free breathing. The sequence parameters were as: FOV = 450mmx450mm, Voxel = 2mmx2mm, slice thickness = 10mm/8mm/5mm, TE = 0.17ms, TR = 1.94ms/2ms/2.2m, FA = 4°, tiny golden Angle 𝜓7=23.62814°. The number of slices was selected volunteer-specific ensuring coverage of the entire lung. With a sliding-window technique [10], low-resolution images were reconstructed from the continuous data and a respiratory gating signal derived from the lung liver interface. The detected signal intensity (SI) in the lung parenchyma was used to calculate the signal-to-noise ratio (SNR), the fractional ventilation [9] ($$$FV = \frac{SI_{EX}-SI_{IN}}{SI_{EX}}$$$) and the proton fraction [11] ($$$f_P = \frac{SI_{lung}}{SI_{muscle}}\cdot \exp (\frac{TE}{T2^*})$$$). For considering T2* decay during proton density calculation, a T2*=0.74ms [12] was assumed. Lung perfusion was quantified as $$$f = \frac{SI_{lung}}{SI_{blood}} \cdot \frac{1}{2\cdot T_{exp}} $$$ [8,13] with $$$T_{exp}$$$ being the total experimental time divided by the number of heartbeats. Noise-correction was performed in the SI images before parameter calculation.Results
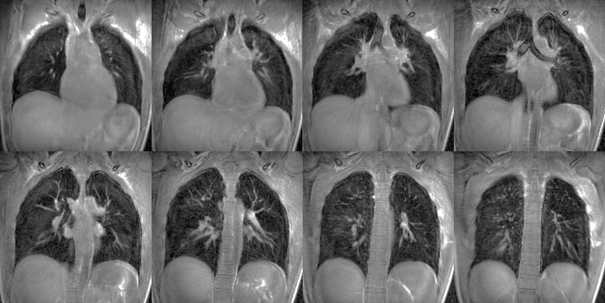
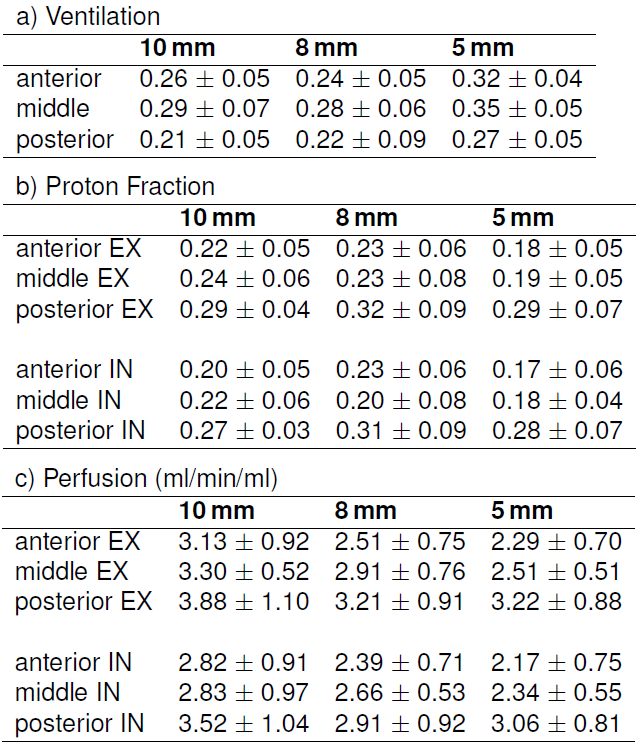
With the UTE STyGAS sequence (Figure 1), images with sufficient lung signal could be obtained (Figure 2). Gibb's Ringing in thru-plane direction was observed in thick slices, which generated artefacts in the slice selection direction and caused non-physiological intensity modulations within the lung parenchyma. Functional parameters could be obtained (Figure 3, Table 1). Differences in the lung parenchyma signal intensity between expiration (EX) and inspiration (IN) were obvious, and FV maps could be calculated. A trend to reduced $$$f_P$$$ was observed with decreasing slice thickness. An increase in perfusion from anterior to posterior was observed as well as a significant difference between expiration and inspiration. The comparison between the different slice thicknesses shows no difference between 8mm and 5mm slice. The values of the 10mm result slightly higher.Discussion and Conclusion
The study shows the feasibility of UTE STyGAS at 3T for the imaging of respiratory motion and respective changes of the lung parenchyma density. The chosen self-gating technique allows the reconstruction of individual breathing phases. The observed differences between IN and EX states resulted as expected, and the increase from anterior to posterior has already been described in [5]. The unexpected dependence of the proton density on the slice thickness can probably be explained by blood vessel contamination in the thicker slices and the decrease of the SNR with decreasing slice thickness. The perfusion values, their increase from anterior to posterior, and the difference between expiration and inspiration are in concordance with literature [8,14]. In contrast to Fischer et al. [8], a perfusion dependency on the slice thickness was observed, which may be explained by the Gibb’s ringing into slice selection direction.Acknowledgements
The authors thank the Ulm University Center for Translational Imaging MoMAN for its support.References
1. Wild JM, Marshall H, Bock M, et al. MRI of the lung (1/3): methods. Insights Imaging 2012;3:345–353.
2. Theilmann RJ, Arai TJ, Samiee A, et al. Quantitative MRI measurement of lung density must account for the change in T with lung inflation. J. Magn. Reson. Imaging Off. J. Int. Soc. Magn. Reson. Med. 2009;30:527–534.
3. Tibiletti M, Kjørstad A, Bianchi A, Schad LR, Stiller D, Rasche V. Multistage self-gated lung imaging in small rodents. Magn. Reson. Med. 2016;75:2448–2454.
4. Tibiletti M, Paul J, Bianchi A, et al. Multistage three-dimensional UTE lung imaging by image-based self-gating. Magn. Reson. Med. 2016;75:1324–1332.
5. Lederlin M, Crémillieux Y. Three-dimensional assessment of lung tissue density using a clinical ultrashort echo time at 3 tesla: a feasibility study in healthy subjects. J. Magn. Reson. Imaging 2014;40:839–847.
6. Liu J, Spincemaille P, Codella NC, Nguyen TD, Prince MR, Wang Y. Respiratory and cardiac self-gated free-breathing cardiac CINE imaging with multiecho 3D hybrid radial SSFP acquisition. Magn. Reson. Med. 2010;63:1230–1237.
7. Wundrak S, Paul J, Ulrici J, Hell E, Rasche V. A small surrogate for the golden angle in time-resolved radial MRI based on generalized fibonacci sequences. IEEE Trans. Med. Imaging 2014;34:1262–1269.
8. Fischer A, Pracht ED, Arnold JF, Kotas M, Flentje M, Jakob PM. Assessment of pulmonary perfusion in a single shot using SEEPAGE. J. Magn. Reson. Imaging Off. J. Int. Soc. Magn. Reson. Med. 2008;27:63–70.
9. Kjørstad A, Corteville DM, Henzler T, et al. Quantitative lung ventilation using Fourier decomposition MRI; comparison and initial study. Magn. Reson. Mater. Phys. Biol. Med. 2014;27:467–476.
10. Paul J, Divkovic E, Wundrak S, et al. High-resolution respiratory self-gated golden angle cardiac MRI: comparison of self-gating methods in combination with k-t SPARSE SENSE. Magn. Reson. Med. 2015;73:292–298.
11. Hatabu H, Alsop DC, Listerud J, Bonnet M, Gefter WB. T2* and proton density measurement of normal human lung parenchyma using submillisecond echo time gradient echo magnetic resonance imaging. Eur. J. Radiol. 1999;29:245–252.
12. Yu J, Xue Y, Song HK. Comparison of lung T2* during free-breathing at 1.5 T and 3.0 T with ultrashort echo time imaging. Magn. Reson. Med. 2011;66:248–254.
13. Kjørstad A, Corteville DM, Fischer A, et al. Quantitative lung perfusion evaluation using Fourier decomposition perfusion MRI. Magn. Reson. Med. 2014;72:558–562.
14. Pracht ED, Fischer A, Arnold JF, Kotas M, Flentje M, Jakob PM. Single-shot quantitative perfusion imaging of the human lung. Magn. Reson. Med. Off. J. Int. Soc. Magn. Reson. Med. 2006;56:1347–1351.
Figures