2355
Detecting regional differences of lung motion by optical flow analysis combined with rapid cine MRI using compressed sensing1Department of Clinical Radiology, Graduate School of Medical Sciences, Kyushu University, Fukuoka, Japan, 2Department of Health Sciences, Faculty of Medical Sciences, Kyushu University, Fukuoka, Japan, 3Department of Medical Technology, Division of Radiology, Kyushu University, Fukuoka, Japan, 4Departmant of Health Sciences, Graduate School of Medical Sciences, Kyushu University, Fukuoka, Japan
Synopsis
The application of cine MRI to lung disease has been technically challenging. In this study, we exploited optical flow analysis combined with rapid acquisition of cine MRI using compressed sensing to detect differences in regional lung motion. The high spatial and temporal resolution and higher signal-to-noise ratio of cine MRI enabled optical flow analysis to visualize regional differences between five lung segments. It also differentiated between chest and diaphragm breathing patterns in volunteers. In the future, this non-invasive method could be applied to assess and follow lung diseases, such as interstitial pneumonia or chronic obstructive pulmonary disease.
INTRODUCTION
Diagnostic imaging of lungs has been dependent on static and structural imaging approaches, such as computed tomography, but detecting regional lung motion is important to diagnose diseases, such as interstitial pneumonia or chronic obstructive pulmonary disease (COPD). Cine MRI is widely used to assess cardiac function in clinics, but its application to lung motion analysis has been technically limited by low, uninterpretable signal produced by lung parenchyma, severe susceptibility, and larger field of view.1Optical flow analysis is a fundamental method to calculate image motion and is widely utilized in video-processing, such as in detection and tracking of vehicles in traffic surveillance.2 Because motion-estimation algorithms are highly noise-sensitive, higher resolution and signal-to-noise ratio are required for application of optical flow analysis to MRI, as well as higher temporal resolution to track the rapid motion of the lung.
Compressed sensing (CS) is a method to accelerate MRI acquisition by acquiring less data through undersampling of k-space.3 It has the potential to improve temporal and spatial resolution of dynamic MRI study without sacrificing signal-to-noise ratio.
The purpose of this study was to investigate the feasibility of optical flow analysis combined with rapid cine MRI using CS to detect regional differences of lung motion in healthy volunteers.
METHODS
<Image Acquisition> Two healthy volunteers underwent MRI using a 3T MR scanner (Ingenia, Philips Healthcare, Cleveland, OH) with a 32-channel body coil. After a scout image, cine steady-state free precession images were obtained, with a voice instruction to take deep breaths, in the sagittal slices at the center of each lung. The duration of each dynamic phase was 268 ms, and 50 phases were acquired per slice. Other cine imaging parameters included repetition time 4.0 ms, echo time 1.9 ms, compressed SENSE reduction factor 2.0 with CS denoising, flip angle 25°, slice thickness 5 mm, field of view 450 × 450 mm2, acquisition matrix 200 × 200, and reconstruction voxel size 1.34 × 1.34 mm2. In this study, a series of dynamic images from the center slice of the right lung were analyzed.<Lung motion analysis> Lung motion was semi-automatically calculated using a program we wrote in MATLAB (R2018b, The MathWorks, Natick, MA). First, the areas of lung field were manually segmented as binarized images through a breath cycle. Second, optical flows of binarized images of lung area at each phase, with respect to the expiratory phase, were computed using the Lucas-Kanade algorithm by solving the following optical flow constraint equation4,5:
$$I_x u+I_y v+I_t=0$$
Ix, Iy, and It are the spatiotemporal image brightness derivatives and μ and ν are the horizontal and vertical image optical flows, respectively. The magnitude vector |μν| was then calculated by the following equation:
$$|uv|=√(u^2+v^2 )$$
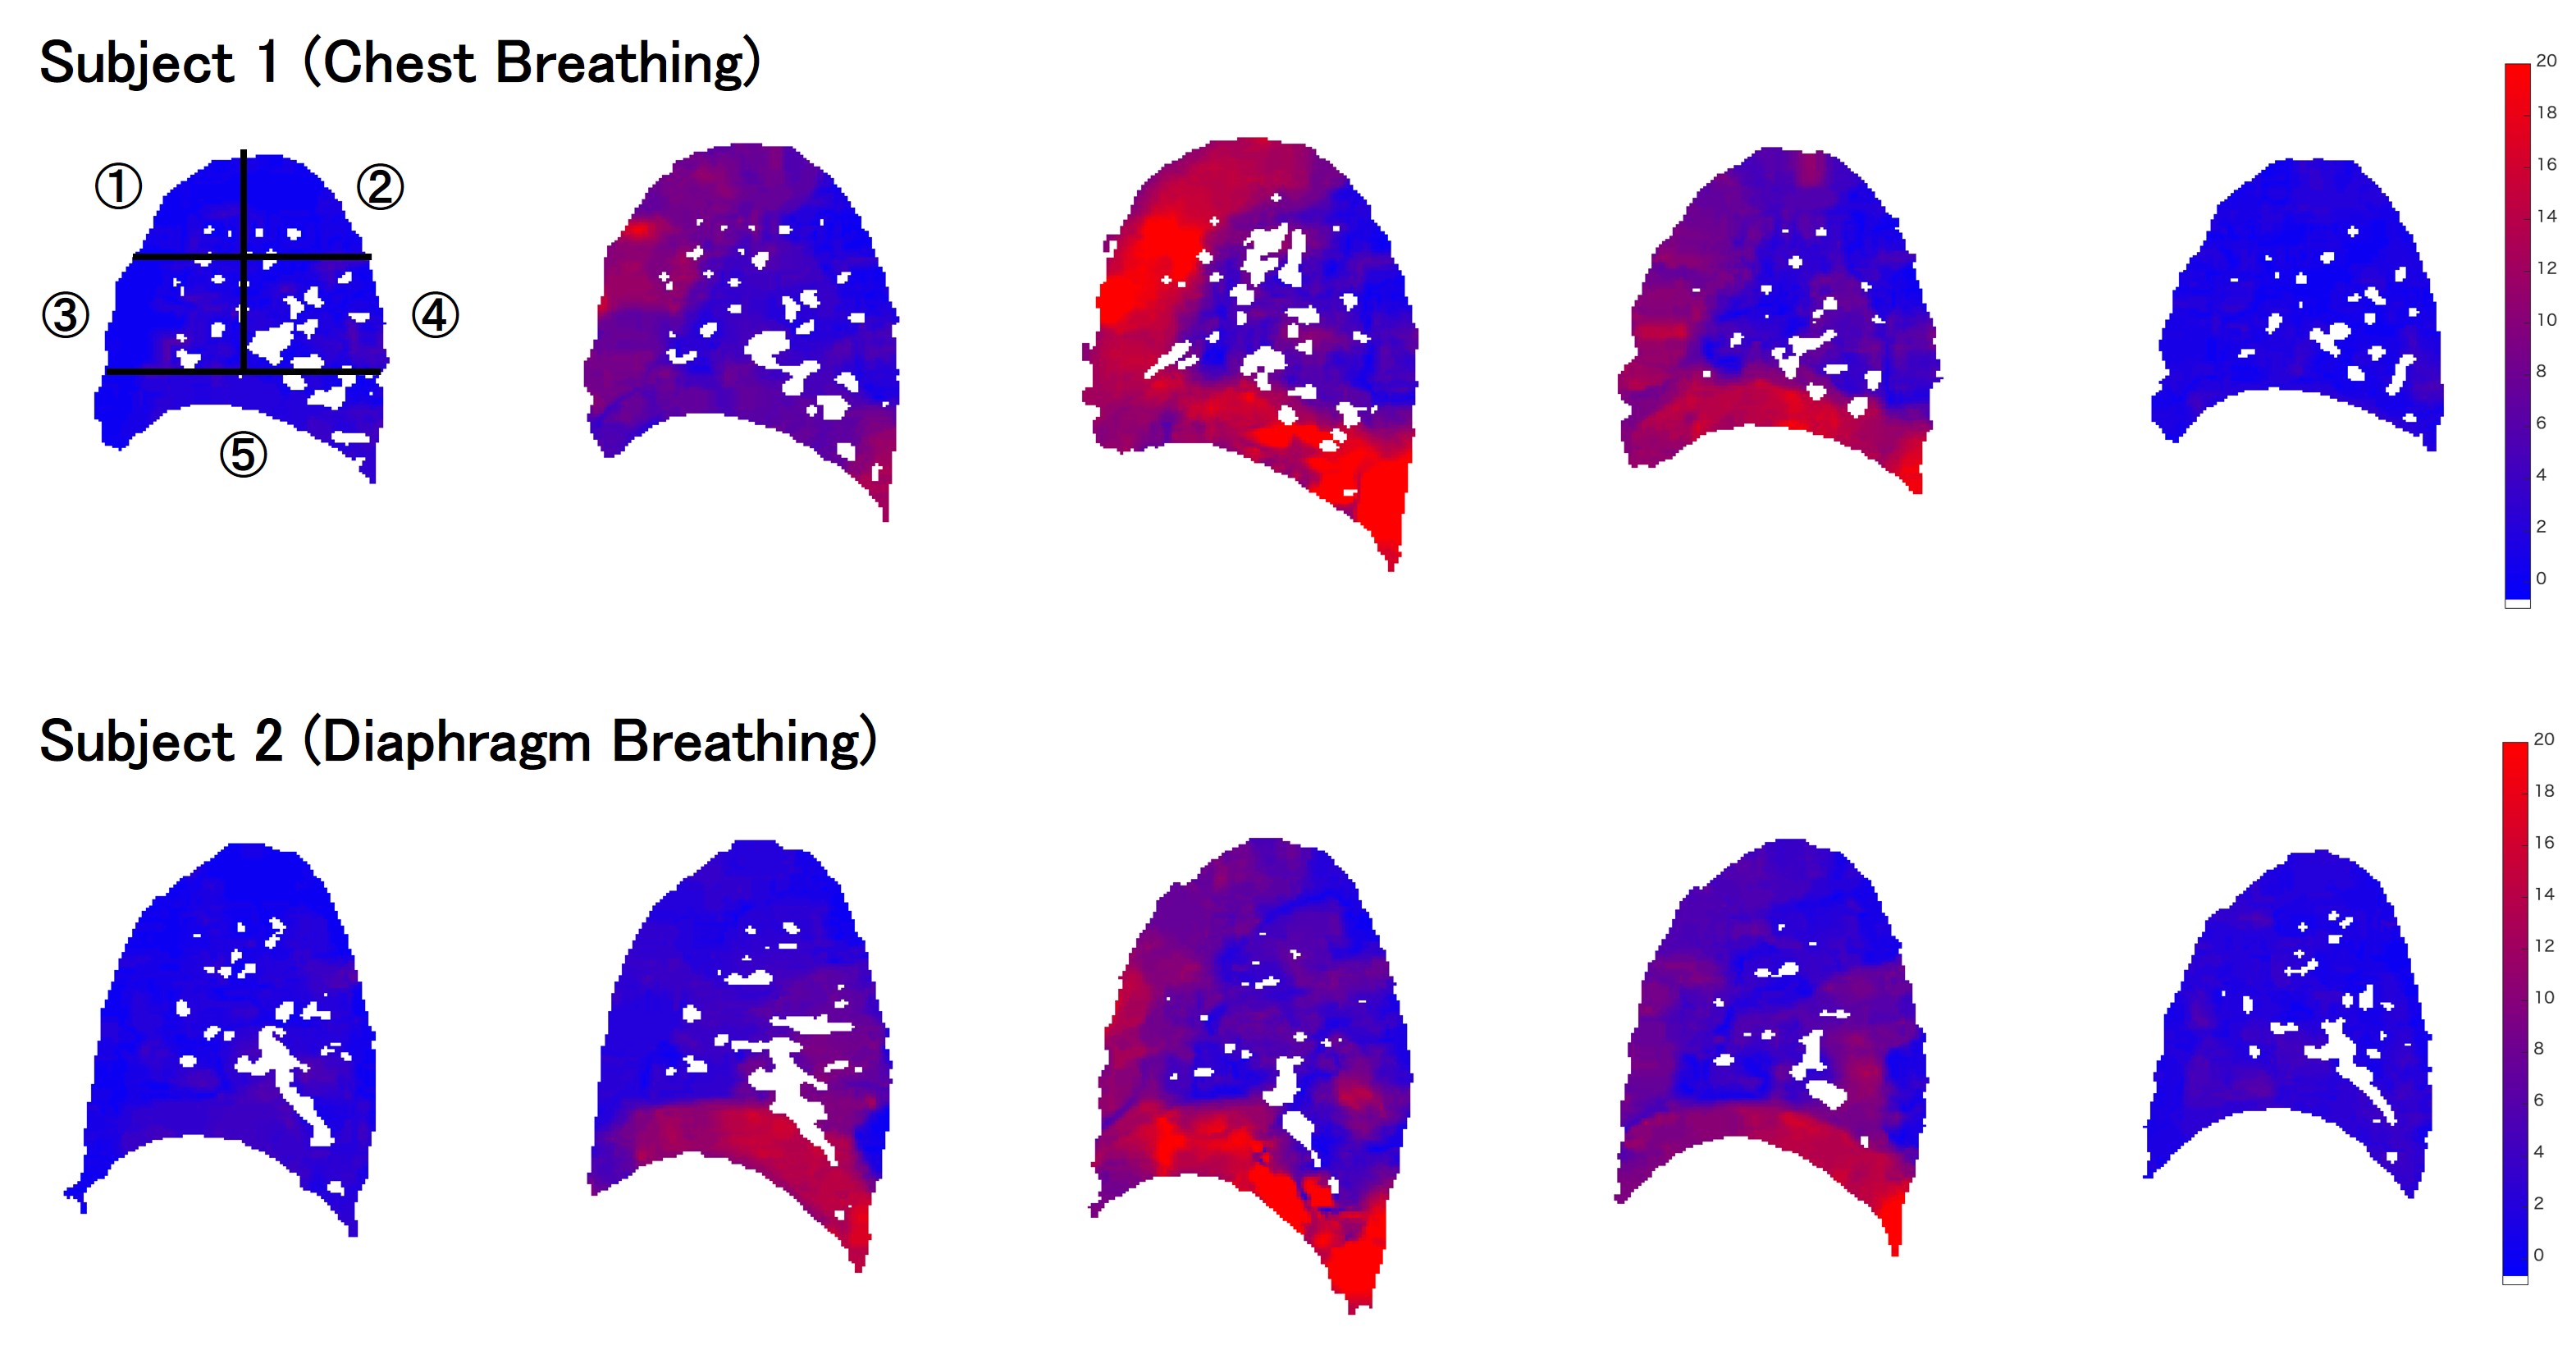
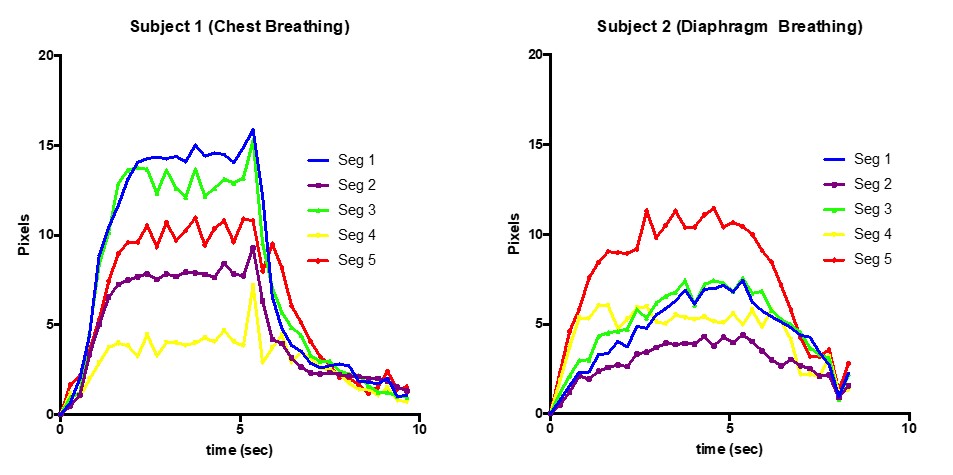
Next, the magnitude vector of movement in the lung field (|μν|) was divided into 5 segments according to the minimum and maximum x and y coordinates. Finally, the curve with the mean value of the magnitude vectors in the global and regional lung area at each breath phase was plotted (Fig. 1).
RESULTS
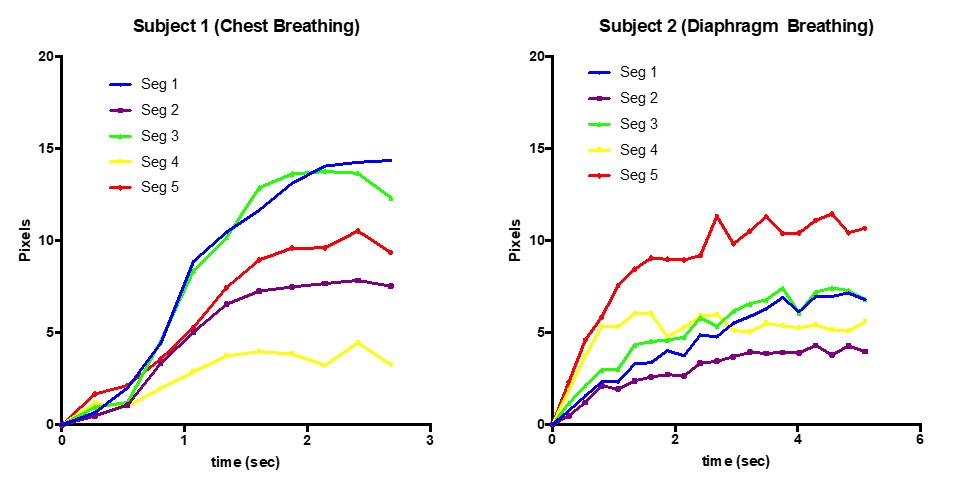
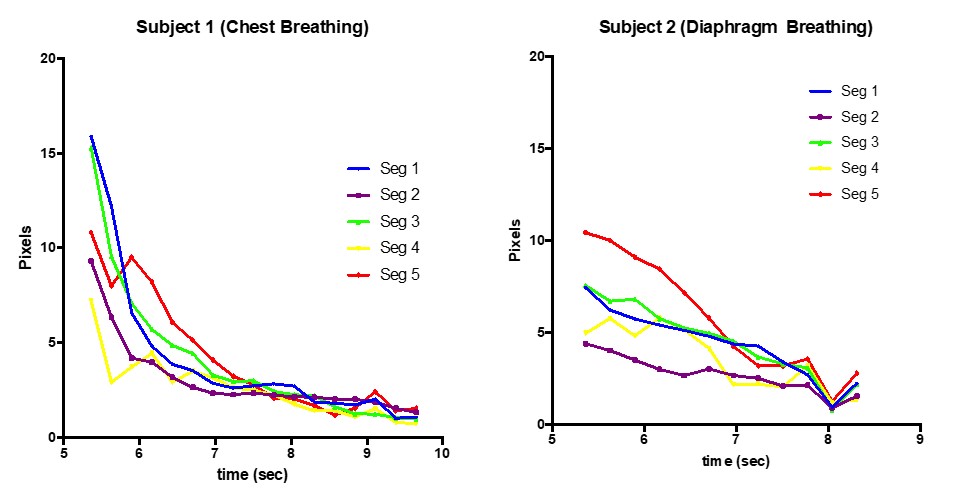
Figure 1 shows color maps of regional motion of the right lung through a breath cycle in the first subject (top) and the second subject (bottom). For subject 1, inspiration started at the anterior segment (the 2nd column) followed by the diaphragm segment (the 3rd column), which indicates that the subject performed chest breathing. In contrast, subject 2 started breathing at the diaphragm segment, and motion of anterior segments was smaller than that of the subject 1, indicating diaphragm breathing.Lung motion in each lung segment through a breath cycle is shown in Figure 2, and enlarged views of the inspiration and expiration phases are shown in Figures 3 and 4, respectively. In the inspiration phase of subject 1, the upper and middle anterior segments (segments 1 and 3) moved first and the most, followed by the diaphragm segment (segment 5). Alternatively, the diaphragm segment (segment 5) led the inspiration phase in subject 2, followed by the middle posterior segment (segment 4). The speed of lung motion in subject 1 was faster and reached plateau earlier than in subject 2. In the expiratory phase, all segments of subject 1 returned rapidly towards plateau, while lung segments of subject 2 returned slowly, especially in the diaphragm segment (segment 5).
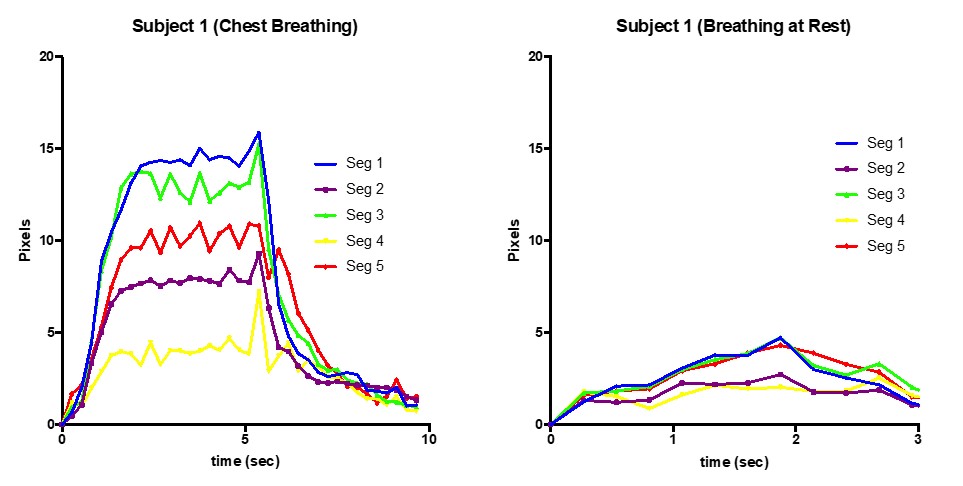
Figure 5 compares subject 1’s breathing at deep chest breath and at rest. At rest, the upper, middle anterior, and diaphragm segments (segments 1, 3, and 5) moved together, and the overall amount of lung motion was much smaller than that of deep breathing.
DISCUSSION
In this study, optical flow analysis combined with rapid cine MRI visualized regional differences in lung motion, and clearly differentiated between two types of physiological breathing in volunteers. Rapid acquisition of cine MRI using CS enabled high temporal and spatial resolution, both of which are essential for reliable segmentation and tracking in optical flow analysis. In the future, this non-invasive method could be applied to assess and follow lung diseases such as interstitial pneumonia or COPD.CONCLUSION
Rapid cine MRI using CS enabled optical flow analysis to detect regional differences of lung motion in volunteers.Acknowledgements
This study received funding by JSPS KAKENHI Grant Number JP19K08228.References
1. Biederer J, Beer M, Hirsch W, et al. MRI of the lung (2/3). Why … when … how? Insights into Imaging 2012;3(4):355-371.
2. Denis Fortun, Patrick Bouthemy, Charles Kervrann. Optical flow modeling and computation: a survey. Computer Vision and Image Understanding, Elsevier, 2015, 134, pp.21. hal-01104081v2
3. Jaspan ON, Fleysher R, Lipton ML. Compressed sensing MRI: a review of the clinical literature. The British Journal of Radiology 2015;88(1056):20150487.
4. Lucas BD, Kanade T. An iterative image registration technique with an application to stereo vision. Proceedings of the 7th international joint conference on Artificial intelligence - Volume 2. Vancouver, BC, Canada: Morgan Kaufmann Publishers Inc.; 1981. p. 674-679.
5. Barron JL, Fleet DJ, Beauchemin SS. Performance of optical flow techniques. International Journal of Computer Vision 1994;12(1):43-77.
Figures