2354
Development and Validation of T2WI-Based Radiomics Classifier in Patients with solid solitary pulmonary lesion1The First Affiliated Hospital of Guangzhou Medical University, Guangzhou, China, 2Philips Healthcare, Guangzhou, China
Synopsis
The solitary pulmonary lesion (SPL) is one of the most common imaging findings. In this study, lung MR using T2 weighted imaging were acquired and analyzed using radiomics. Both 2D and 3D features combined with machine learning approach were compared to determinate an optimal model for differentiation of SPLs. We found that the radiomics signatures derived from 3D features outperformed that from 2D features. The best 3D radiomics model for the classification was a combination of principal component analysis(PCA), analysis of variance(ANOVA) and linear discriminant analysis (LDA). The T2WI-based radiomics model shows potential in differentiating malignancy from benign SPLs.
Introduction
The solitary pulmonary lesion (SPL) is one of the most common findings on chest radiographs and CT. With the prevalence of lung cancer screening, an increasing number of pulmonary nodules are detected by CT. However, most of these positive detections were not cancerous1. The high false-positive rate could lead to waste of medical resources, additional radiation exposure, unnecessary patient anxiety and so on. Recent advances in MR techniques make it possible to utilize lung MRI in routine clinical practice. Published evidence showed that lung MRI could be a potential screening tool for the reason that it performed comparably to low-dose CT2, even with a lower false positive rate for nodule detection3. Conventional MRI sequence, such as T2WI, has the potential for detection of pulmonary nodules greater than 6 mm in diameter4, which is essential for screening. However, as a morphological sequence, it might have limited value on distinguishing malignant from benign SPLs. The present study aimed to develop and validate a T2WI-based radiomics classifier to differentiate between malignant and benign SPLs. Besides, different machine learning methods were evaluated to achieve best classification performance. Furthermore, 3D and 2D features,as well as their combination were compared.Material and Methods
A total of 132 patients (93 malignant lesions and 39 benign lesions) were included. All patients were examined with a 3.0-T MRI (Achieva, Philips Healthcare, Best, The Netherlands) using a body phased-array coil. Turbo spin-echo T2-weighted (T2WI) imaging was acquired using the following parameters: TR=992 msec, TE=80 msec, field of view=350 mm× 430 mm, matrix=640 × 640, thickness=7.0 mm, slice gap =0.7 mm. The patients were randomly divided into two independent groups with a ratio of 7:3. The training cohort included 92 patients (65/27 = positive/negative), whereas the independent test cohort of 40 patients(28/12 = positive/negative).Mass segmentation was performed to select the entire tumor using open‐source software (ITK‐SNAP v. 3.6.0) by two experienced radiologists with 3 and 8 years of experience. The 3D ROI was manually delineated around the tumor profile, then 2D ROI with the maximum area was generated from the 3D ROI. The data were analyzed by Philips Radiomics tool (v.1.9.2) to extract the features. Four types of radiomics features were calculated in our studynamely tumor intensity, shape, texture, and Wavelet features. A total of 1692 3D radiomics features and 1231 2D features per patient were extracted. The performance of 2 dimension reduction algorithms: PCA, Pearson Correlation Coefficients(PCC), 3 different feature selection methods: ANOVA, Relief, recursive feature elimination (RFE)) and 6 different classifiers :support vector machine (SVM), auto-encoder (AE), LDA, Random forest(RF), logistic regression(LR) and LR-Lasso were compared. Receiver operating characteristic curve analysis was used to assess the accuracy of classification.Results
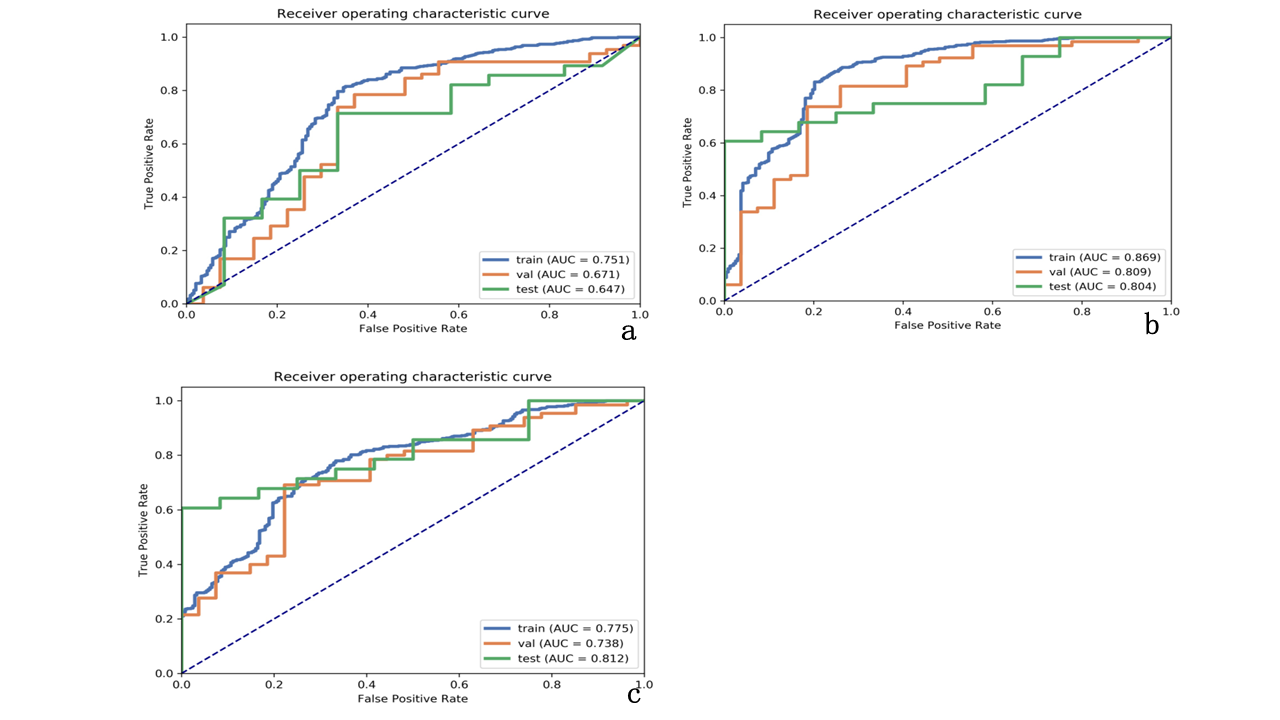
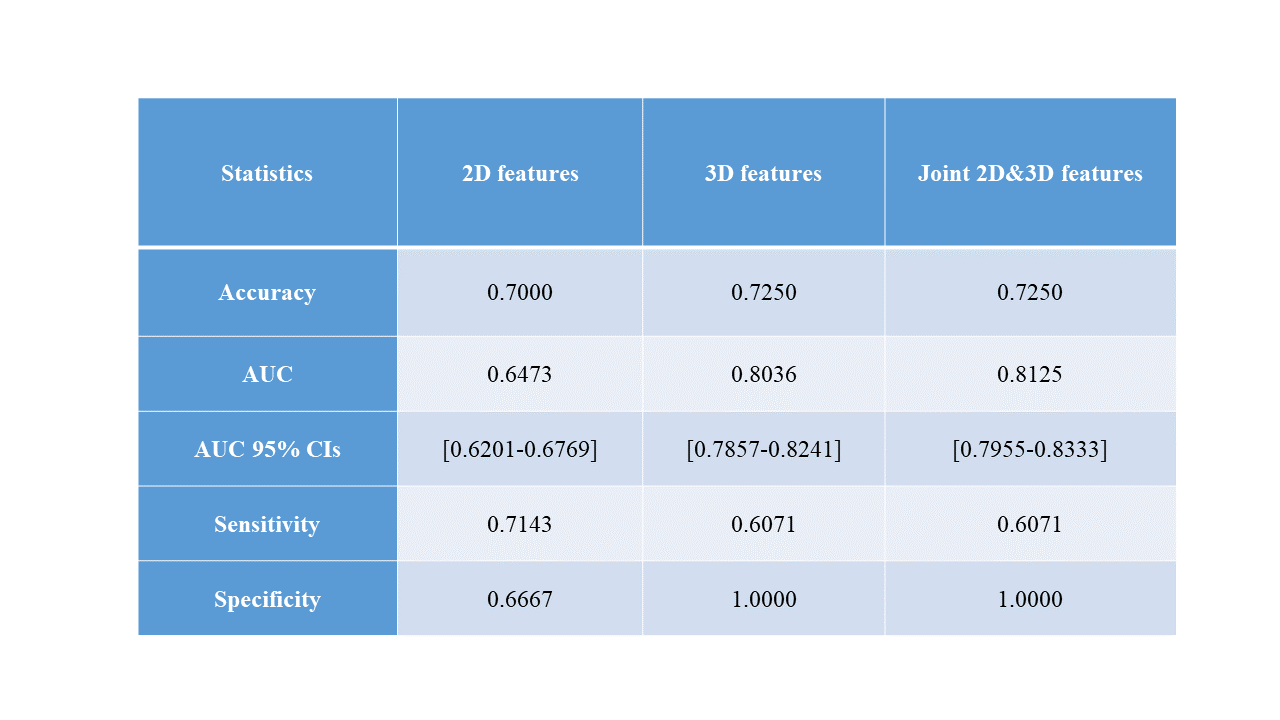
The radiomics signatures derived from 3D features outperformed 2D features in our binary classification task. The combined 3D and 2D features showed similar result compared with 3D features. The best 3D radiomics model for the classification of SPLs was a combination of PCA and ANOVA for feature selection + LDA for classification, with an area under the curve (AUC) in the training group (train: 0.869, validation: 0.809) and the independent test group (0.804, with 95% CI: 0.785-0.824). For 2D features, we found that the model with the combination of PCC and RFE for feature selection, + SVM for classification can generate the most stable and best results in both train (train: AUC = 0.751, validation: AUC = 0.671)and test data set(AUC = 0.647 with 95% CI: 0.6201-0.6769). For combined 2D and 3D features, the model of PCC, ANOVA for feature selection, SVM for binary classification achieved highest AUC for train data set(train: AUC = 0.775, validation: AUC = 0.738) and 0.812 (95% CI: 0.7955-0.8333) on testing data set. (Table 1.)Discussion
The present study showed that 3D features outperformed 2D features in the classification of SPLs, which might indicate that the 3D volumetric ROI contains more comprehensive information than 2D ROI and therefore has better diagnostic performance. Although a previous study5 reported a higher AUC for joint 2D and 3D features, it fails to show superiority demonstrating similar performance with 3D features in the current study. This suggests that the joint features contain information of both 2D and 3D features, while 2D features might be unable to provide new information to 3D features in the current cohort. Accordingly, the classification results have not been improved. Furthermore, the machine learning methods are different among 2D, 3D and joint features, which suggests that the optimal machine learning methods are not consistent in various scenarios. In the future, a multi-center clinical trial is necessary to validate the feasibility of such approach.Conclusion
The radiomics based on T2 weighted magnetic resonance image has potential to differentiate malignant and benign SPL. The 3D radiomics features, as well as combined 2D and 3D radiomics features, are better than 2D features in differentiating SPL. 3D radiomics features combined with machine learning approach could be potentially served as a biomarker for differentiation of malignant and benign SPL in future.Acknowledgements
No acknowledgement found.References
1. National Lung Screening Trial Research T, Aberle DR, Adams AM, et al. Reduced lung-cancer mortality with low-dose computed tomographic screening. The New England journal of medicine. 2011; 365:395-409.
2. Meier-Schroers M, Homsi R, Gieseke J, Schild HH, Thomas D. Lung cancer screening with MRI: Evaluation of MRI for lung cancer screening by comparison of LDCT- and MRI-derived Lung-RADS categories in the first two screening rounds. European radiology. 2019; 29:898-905.
3. Sommer G, Tremper J, Koenigkam-Santos M, et al. Lung nodule detection in a high-risk population: comparison of magnetic resonance imaging and low-dose computed tomography. European journal of radiology. 2014; 83:600-605.
4. Meier-Schroers M, Homsi R, Schild HH, Thomas D. Lung cancer screening with MRI: characterization of nodules with different non-enhanced MRI sequences. Acta radiologica (Stockholm, Sweden : 1987). 2018:284185118778870.
5. Yang L, Yang J, Zhou X, et al. Development of a radiomics nomogram based on the 2D and 3D CT features to predict the survival of non-small cell lung cancer patients. European radiology. 2019; 29:2196-2206.
Figures