2353
Assessing the Error in Functional Lung Parameters obtained via SENCEFUL MRI1Department of Diagnostic and Interventional Radiology, University Hospital of Würzburg, Würzburg, Germany
Synopsis
Until now, no study assessed the error that arises during calculation of quantitative functional lung parameters obtained from MRI. Using a bootstrapping approach with shuffling residuals the error of ventilation and perfusion (amplitude and phase) of the SENCEFUL technique was investigated in this study. Obtained error values were in an acceptable range rendering quantitative functional lung MRI a promising technique for the assessment of regional alterations in lung function.
INTRODUCTION
Recently, some new MRI based lung function testing approaches complement standard lung function tests like spirometry or body plethysmography. Proposed methods range from the use of (hyperpolarized) noble gases like Xenon (1) or Helium (2) over fluorinated gases (3,4) to completely unenhanced techniques like standard Fourier decomposition (5–7) and SElf-gated Non-Contrast-Enhanced FUnctional Lung (SENCEFUL) imaging (8 - 10).However, none of the studies assessed the error of the estimated quantitative parameters, which was the aim of the current study.
METHODS
Quantitative functional lung imaging using the SENCEFUL approach was performed in one healthy volunteer (HC), one patient with cystic fibrosis (CF) and one patient with acute pulmonary embolism (PE).For imaging, a two-dimensional (2D) FLASH sequence with asymmetric echo readout was used on a 3T scanner (Siemens Magnetom Prisma) employing the following acquisition parameters: field-of-view (FOV) = 450 x 450 mm2, matrix = 128 x 128, slice thickness = 10 mm, slice orientation = coronal, repetition time (TR) = 2.5 ms, echo time (TE) = 0.69 ms, acquisition time (TA) = 160 sec, flip-angle = 8°. After each readout, gradients were wound back and the direct current signal for self-gating was acquired. A total of 64,000 readouts was obtained for each slice. The phase encoding steps were chosen according to a Niederreiter quasi random number sequence (11, 12) to decouple the sampling pattern from the periodic physiological processes namely breathing and cardiac motion.
Calculation of functional lung parameters was performed using the SENCEFUL method as described previously (8,9,13). The perfusion amplitude for every voxel was calculated from the first harmonic of the signal amplitude over the cardiac cycle and normalized by choosing a reference ROI either in the descending aorta or the pulmonary trunk. The time to peak-enhancement or equivalently the perfusion phase is determined as the phase of that first harmonic.
In addition, quantitative ventilation values can be calculated for every voxel of the lung parenchyma following the approach presented by Zapke et al. (14) giving values in ml gas per ml lung parenchyma.
During the estimation of the functional parameters, either perfusion or ventilation related, data modeling is performed via fitting a harmonic along the temporal dimension of the cardiac or the breathing cycle. By subtracting the model data from the original reconstructed dataset, residuals were calculated for every time point. In a bootstrapping approach (resampling residuals) the residuals were randomly permuted and added to the model data. From this new data functional maps were calculated again. By repeating the steps of randomly permuting the residuals and calculating functional maps for 100 times, a stack of quantitative functional parameter maps was generated. Subsequently, the standard deviation over the stack in each voxel was calculated representing the error of the observed functional parameter. By that, maps of the error of the functional parameters were calculated.
RESULTS
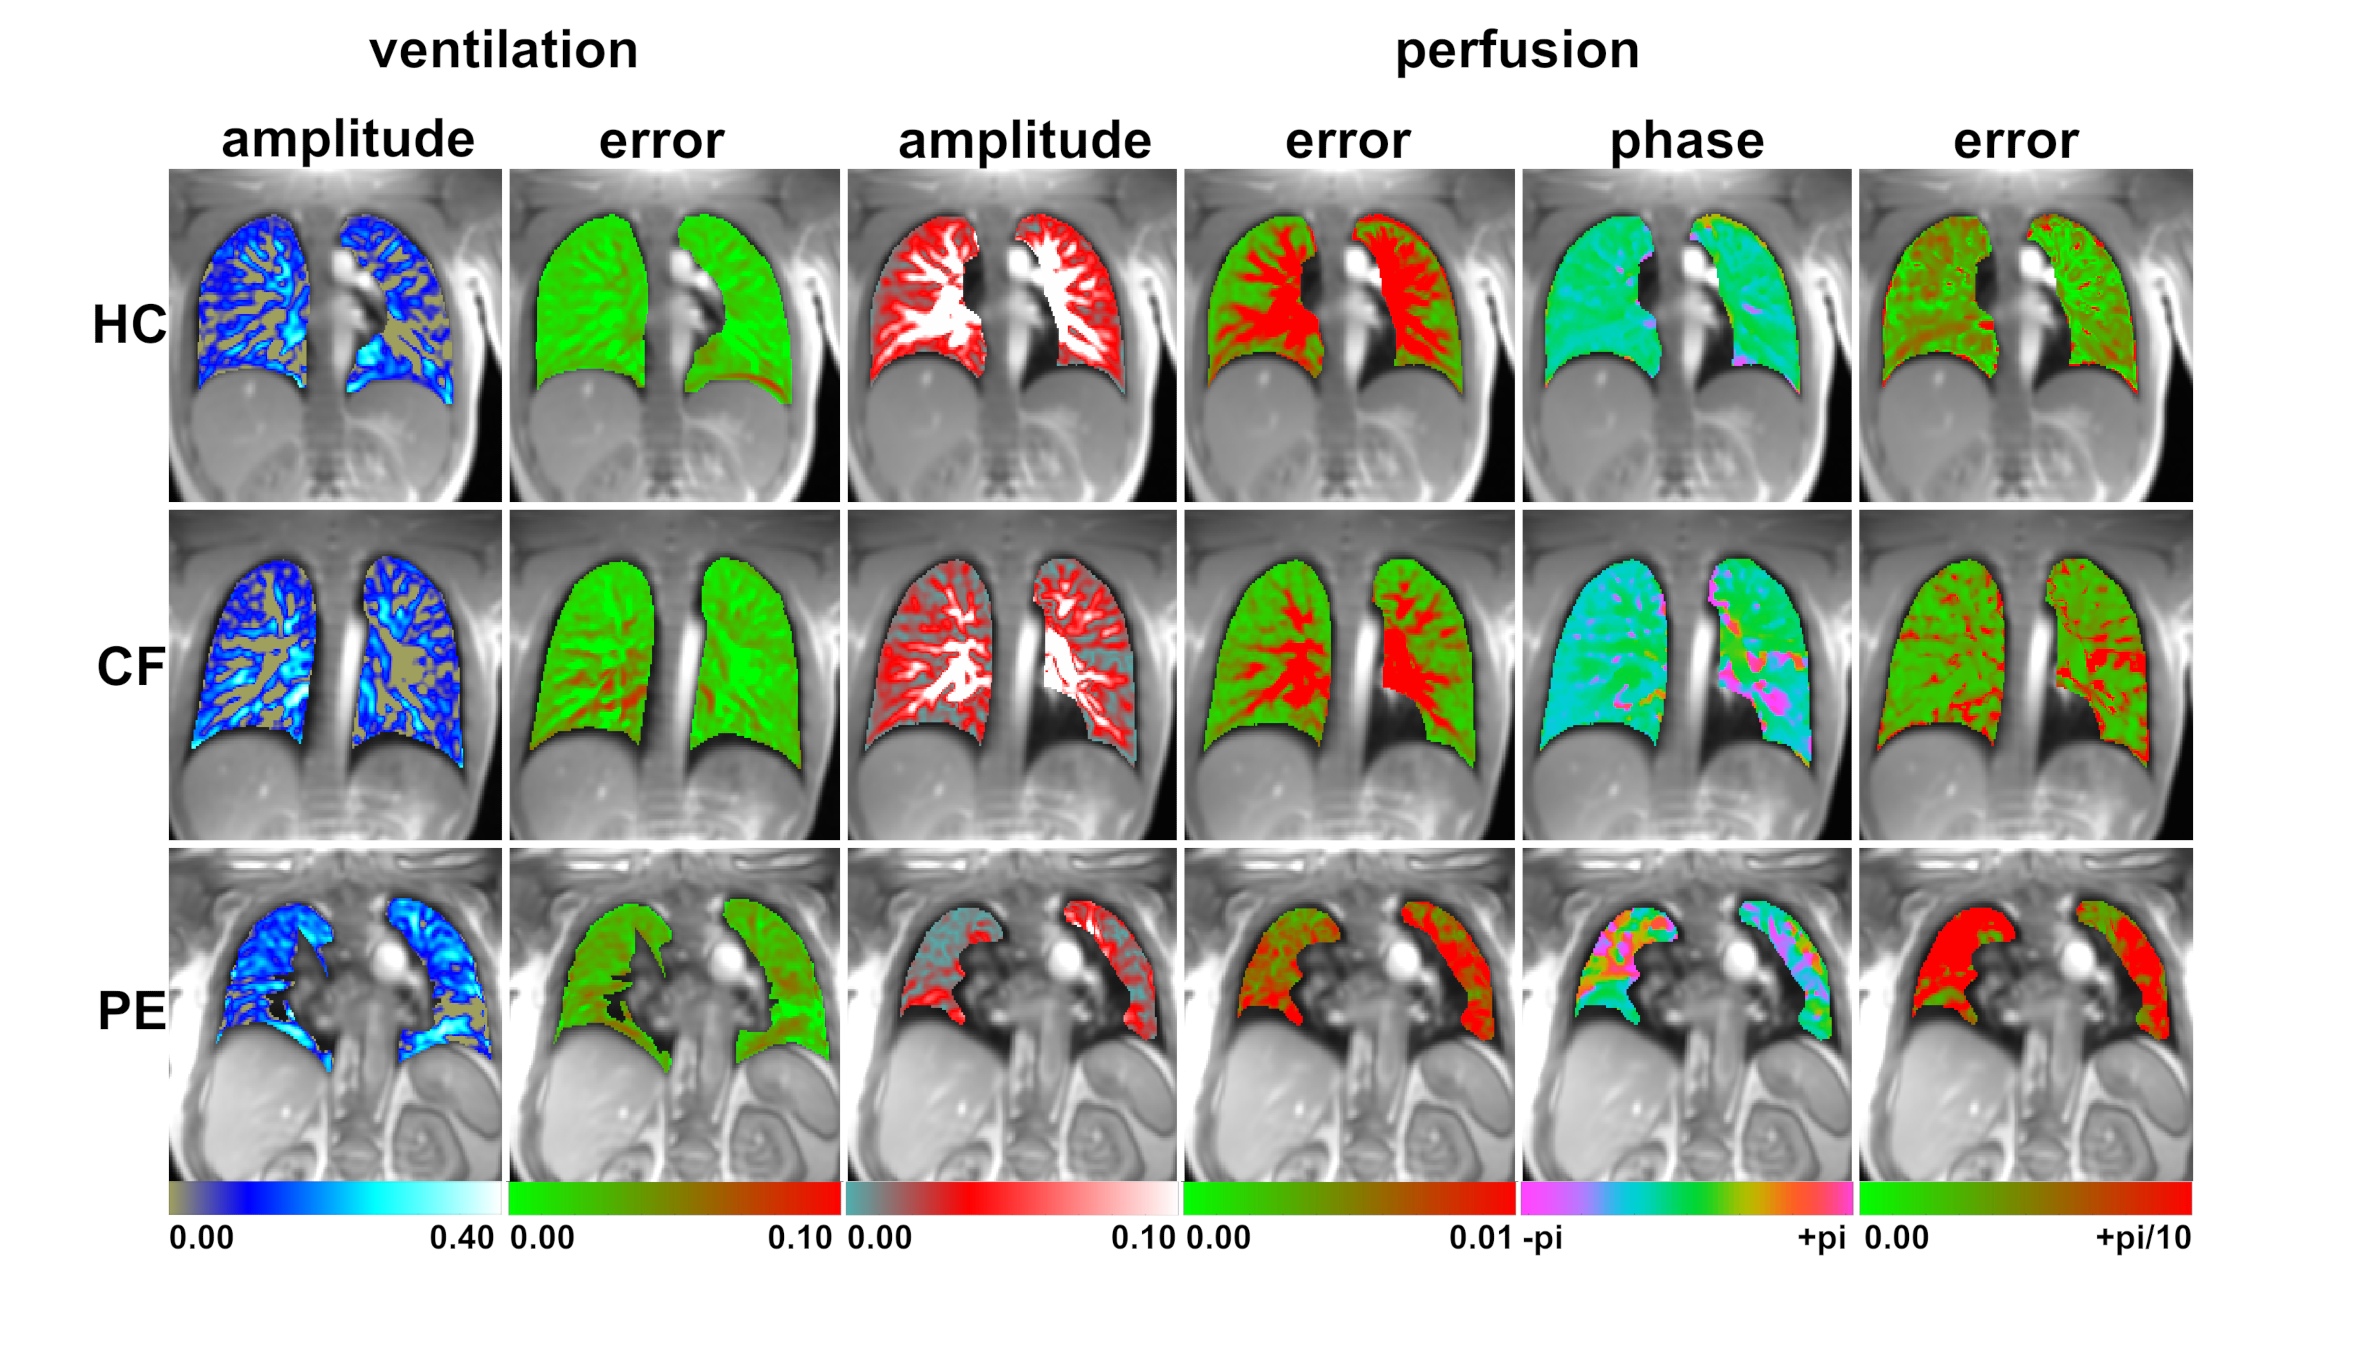
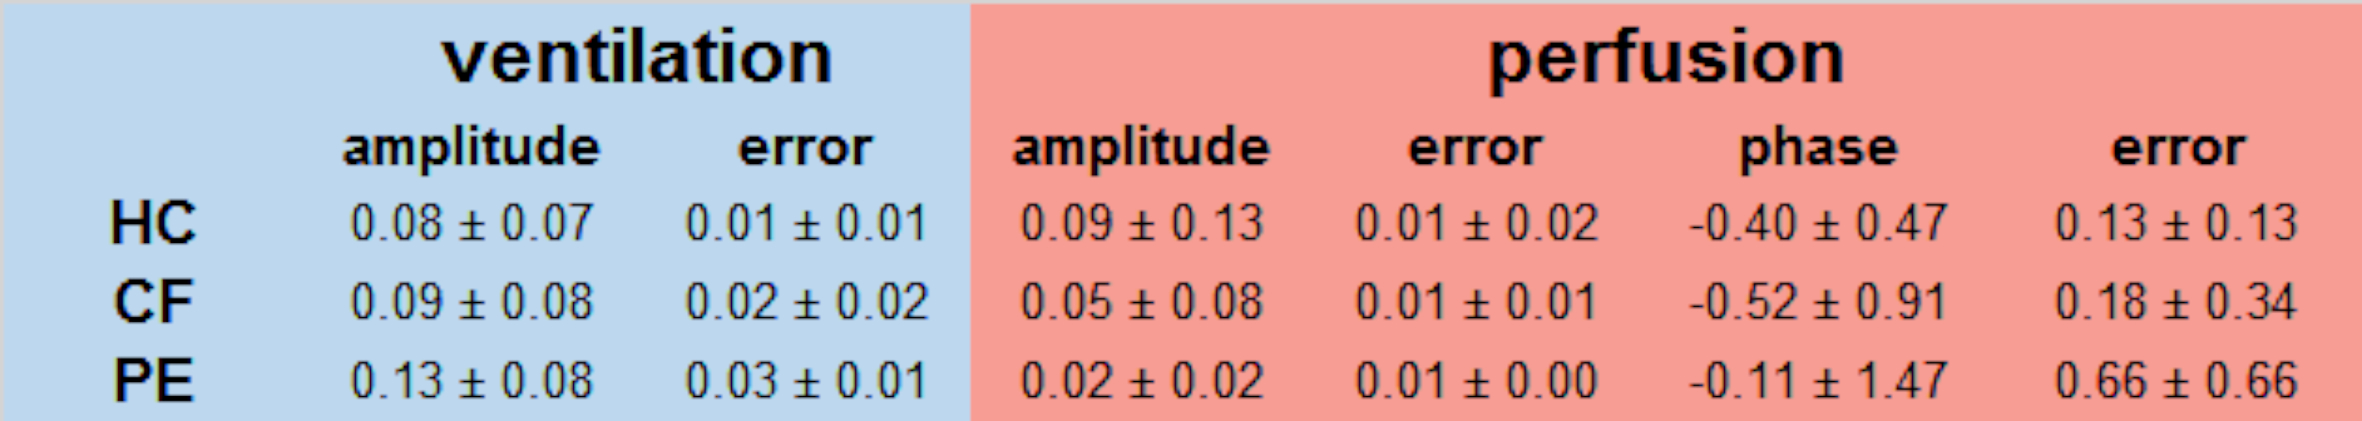
Figure 1 shows parametric maps of all subjects: healthy first row, CF second row and PE in the third row. The first column shows fractional ventilation with the corresponding error map in the second column. Perfusion amplitude and error are presented in columns three and four while perfusion phase and errors are presented in the last two columns.Ventilation could be assessed with a mean error from 0.01 ml gas / ml parenchyma (healthy control) to 0.03 ml gas / ml parenchyma (pulmonary embolism). The mean error in perfusion amplitude was consistently 0.01 for all participants while the mean error of the perfusion phase was in the range from 0.13 (HC) to 0.66 (PE). A summary of all results is presented in table 1.
CONCLUSION
SENCEFUL MRI provides voxel-wise information on lung ventilation and perfusion amplitude and perfusion phase. The magnitude of the error is in an acceptable range rendering this technique suitable for assessing local ventilation and/or perfusion deficits in the lung. In some cases like pulmonary embolism, the error maps illustrated that a determination of the perfusion phase is not possible in regions with very low perfusion signal.Acknowledgements
No acknowledgement found.References
1. Kern AL, et al., Magn. Reson. Med. 2019.
2. Van Beek EJR, et al., J. Magn. Reson. Imaging 2004.
3. Jacob RE, et al., Magn. Reson. Med. 2005.
4. Gutberlet M, et al., Acad. Radiol. 2019.
5. Bauman G, et al., Magn. Reson. Med. 2009.
6. Bauman G, et al., Magn. Reson. Med. 2016.
7. Deimling M, et al., Proc. Intl. Soc. Mag. Reson. Med. 2008.
8. Fischer A, et al., NMR Biomed. 2014.
9. Veldhoen S, et al., Radiology. 2017.
10. Mendes Pereira L, et
al., Magn. Reson. Med. 2018.
11. Weick S, et al., Proc. Intl. Soc. Mag. Reson. Med. 2011.
12. Niederreiter H, Bull.
Am. Math. Soc. 1978.
13. Stäb D, et al., Proc. Intl. Soc. Mag. Reson. Med. 2015.
14. Zapke M, et al., Respir. Res. 2006.
Figures