2352
Feasibility of 3D flow-volume loop analysis using phase-resolved functional lung imaging (PREFUL) in comparison with 2D PREFUL1Institute of Diagnostic and Interventional Radiology, Hanover Medical School, Hanover, Germany, 2Biomedical Research in Endstage and Obstructive Lung Disease Hannover (BREATH), German Center for Lung Research (DZL), Hanover, Germany, 3Siemens Healthcare GmbH, Erlangen, Germany
Synopsis
The measurement of ventilation dynamics with 2D proton MRI (PREFUL) might offer a sensitive lung function test but lacks a high spatial resolution and whole-lung acquisition is time consuming. Recently, the feasibility of 3D PREFUL was demonstrated. In this work, ventilation dynamics assessment using flow-volume loop (FVL) analysis is performed on 2D and 3D data of a healthy volunteer and an asthma patient. Full respiratory cycle was reconstructed to calculate regional ventilation and cross-correlation metric of FVL. Similar results suggest that 3D PREFUL might be an interesting alternative to 2D PREFUL due to its improved spatial resolution and acquisition efficiency.
Introduction
MRI-based spirometry measurement is gaining increasing interest in the last years1–5. Phase-resolved functional lung (PREFUL)3 imaging offers sensitive measurement of regional ventilation dynamics, which is essential to show regional pulmonary function impairment. One limitation of PREFUL is its 2D acquisition, which requires long measurement times if the analysis of the whole lung volume is needed. Furthermore high spatial resolution is missing. Recently, preliminary results of a 3D PREFUL approach have been presented6; however, no comparison of ventilation dynamics between 2D and 3D was performed. Similarly to spirometry, ventilation dynamics of PREFUL could be assessed using flow-volume loops (FVL). The purpose of this work was to demonstrate the feasibility of 3D FVL analysis using PREFUL ventilation measurement with improved spatial resolution in an asthma patient and a healthy volunteer in comparison to 2D PREFUL measurement.Methods
One asthma patient (female, age: 70 years, FEV1%pred 63%) and one healthy volunteer (male, age: 33 years) underwent imaging on a 1.5T MR-scanner (MAGNETOM Avanto, Siemens Healthcare, Erlangen, Germany).For 2D PREFUL, 250 images per slice were acquired for 10-11 coronal slices of the lungs using a spoiled gradient echo sequence with the following parameters: TE 0.82 ms, TR 3 ms, TA 190 ms, flip angle 5°, FOV 50 x 50 cm2, slice thickness 15 mm, matrix size 128x128 interpolated to 256x256, pixel bandwidth 1500 Hz/pixel, total acquisition time 48 seconds per slice.
For the 3D PREFUL approach, 8184 spokes were acquired using a prototype stack-of-stars spoiled gradient echo sequence with golden-angle increment (FOV 50 x 50 cm2, matrix size 128x128 interpolated to 256x256, slice thicknes 3.9 mm - interpolated to 1.95 mm, TE 0.81 ms, TR 1.9 ms, flip angle 3.5°, pixel bandwidth 1500 Hz/pixel) over a period of 12:45 min. Low-resolution images with high temporal resolution of approximately 100 ms were used to divide the spokes over 65 respiratory states, and the images were reconstructed off-line using iterative compressed sensing reconstruction7 by enforcing the sparsity along respiratory states dimension which was implemented in Berkeley Advanced Reconstruction Toolbox (BART)8.
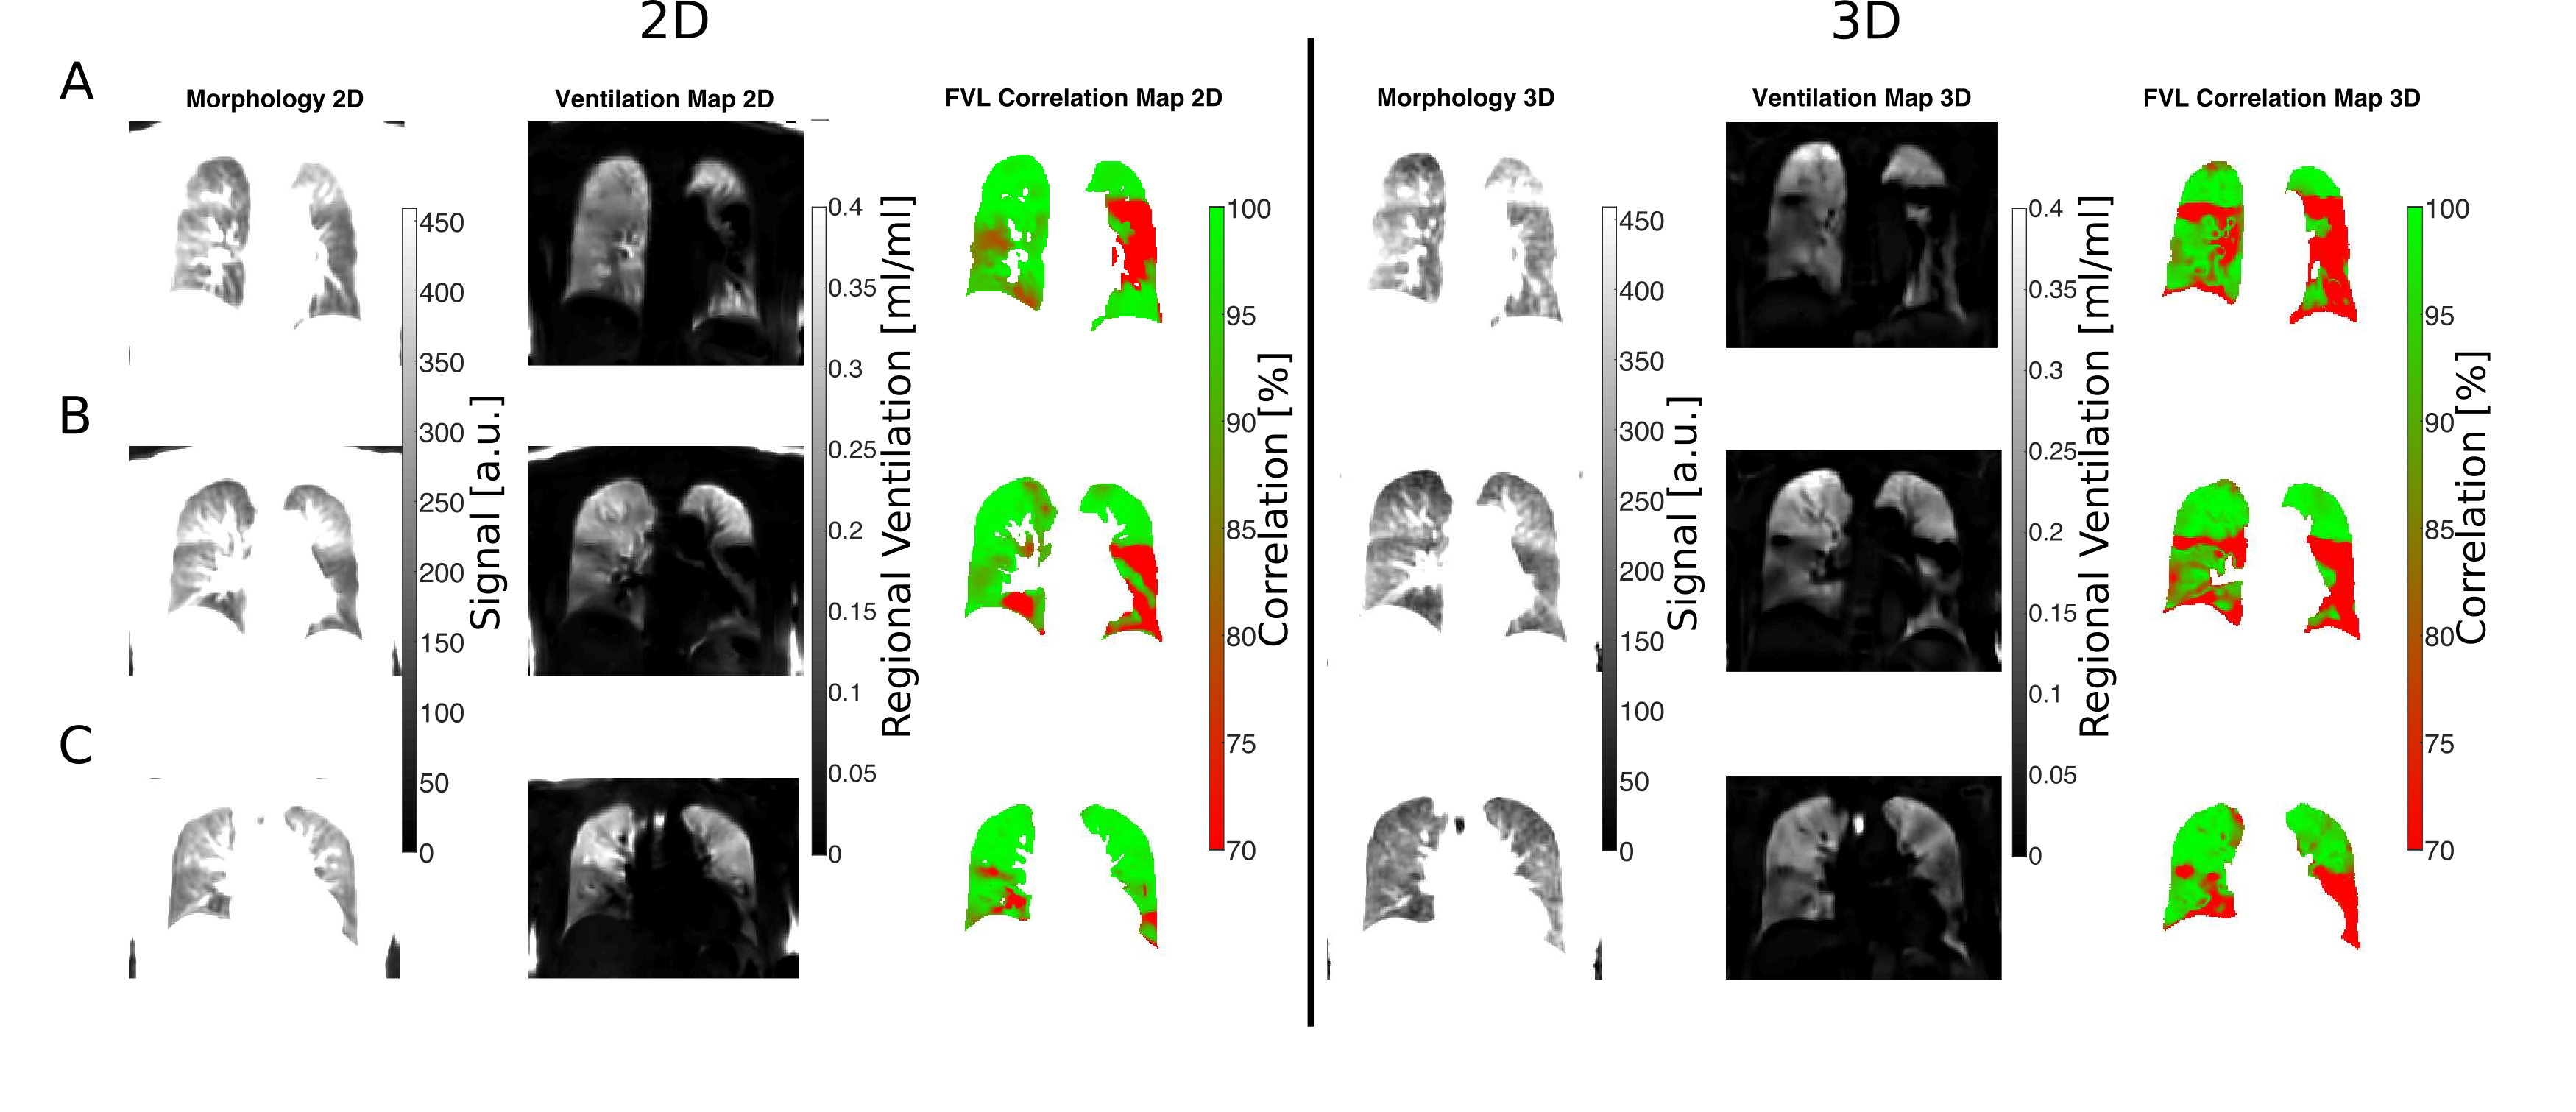
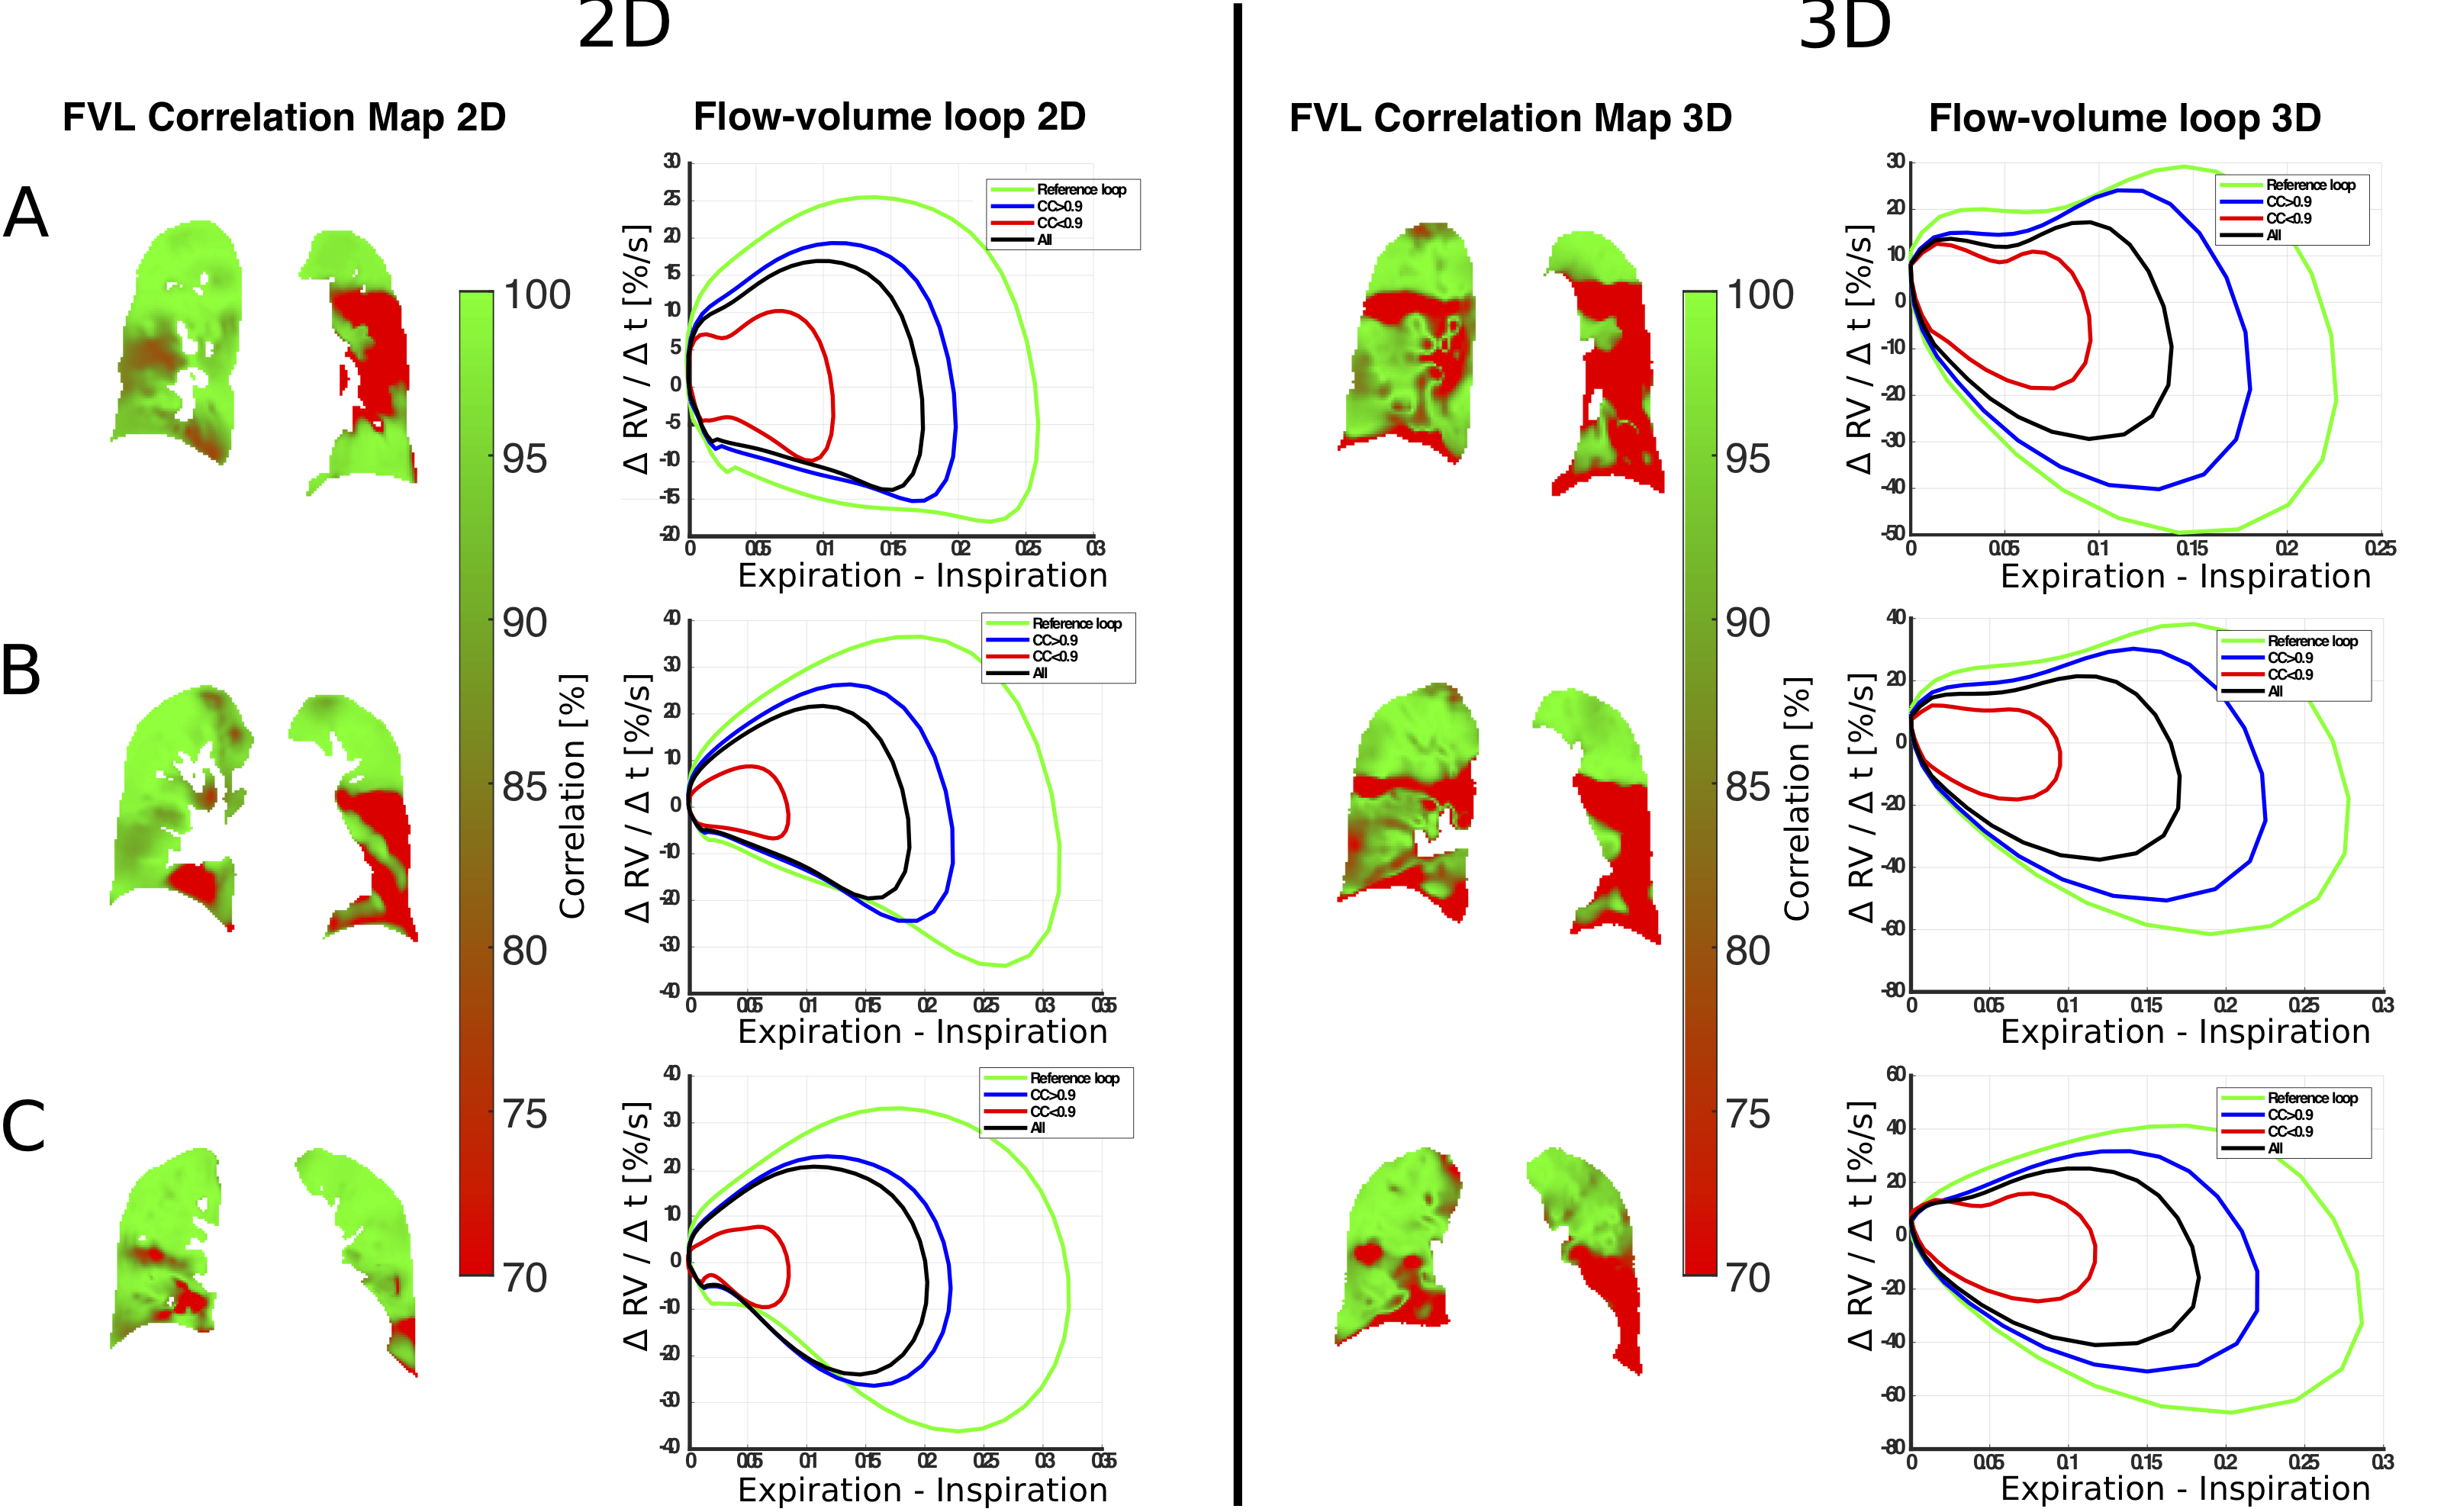
Image processing was performed with in-house Matlab software. The image registration using group-oriented approach9 towards an intermediate respiratory state / inspiration was performed for 2D and 3D PREFUL with Advanced Normalization Tools (ANTs)10. Regional ventilation (RV) maps were computed for each respiratory state6. After quantification of RV dynamics, a semi-automated segmentation was used to exclude large vessels and the RV dynamics was further analyzed by calculation of the regional RV slopes (ΔRV/Δt). By plotting the RV slopes as a function of RV a flow-volume loop (FVL) was calculated for each voxel in the lung parenchyma4. Similarity of all FVLs to a healthy-reference FVL11, which was obtained by averaging the FVLs in a selected region with high RV values (75-95% quantile), was measured by cross-correlation (CC) metric. Thus a quantitative correlation map of FVL in percent was generated.
Results
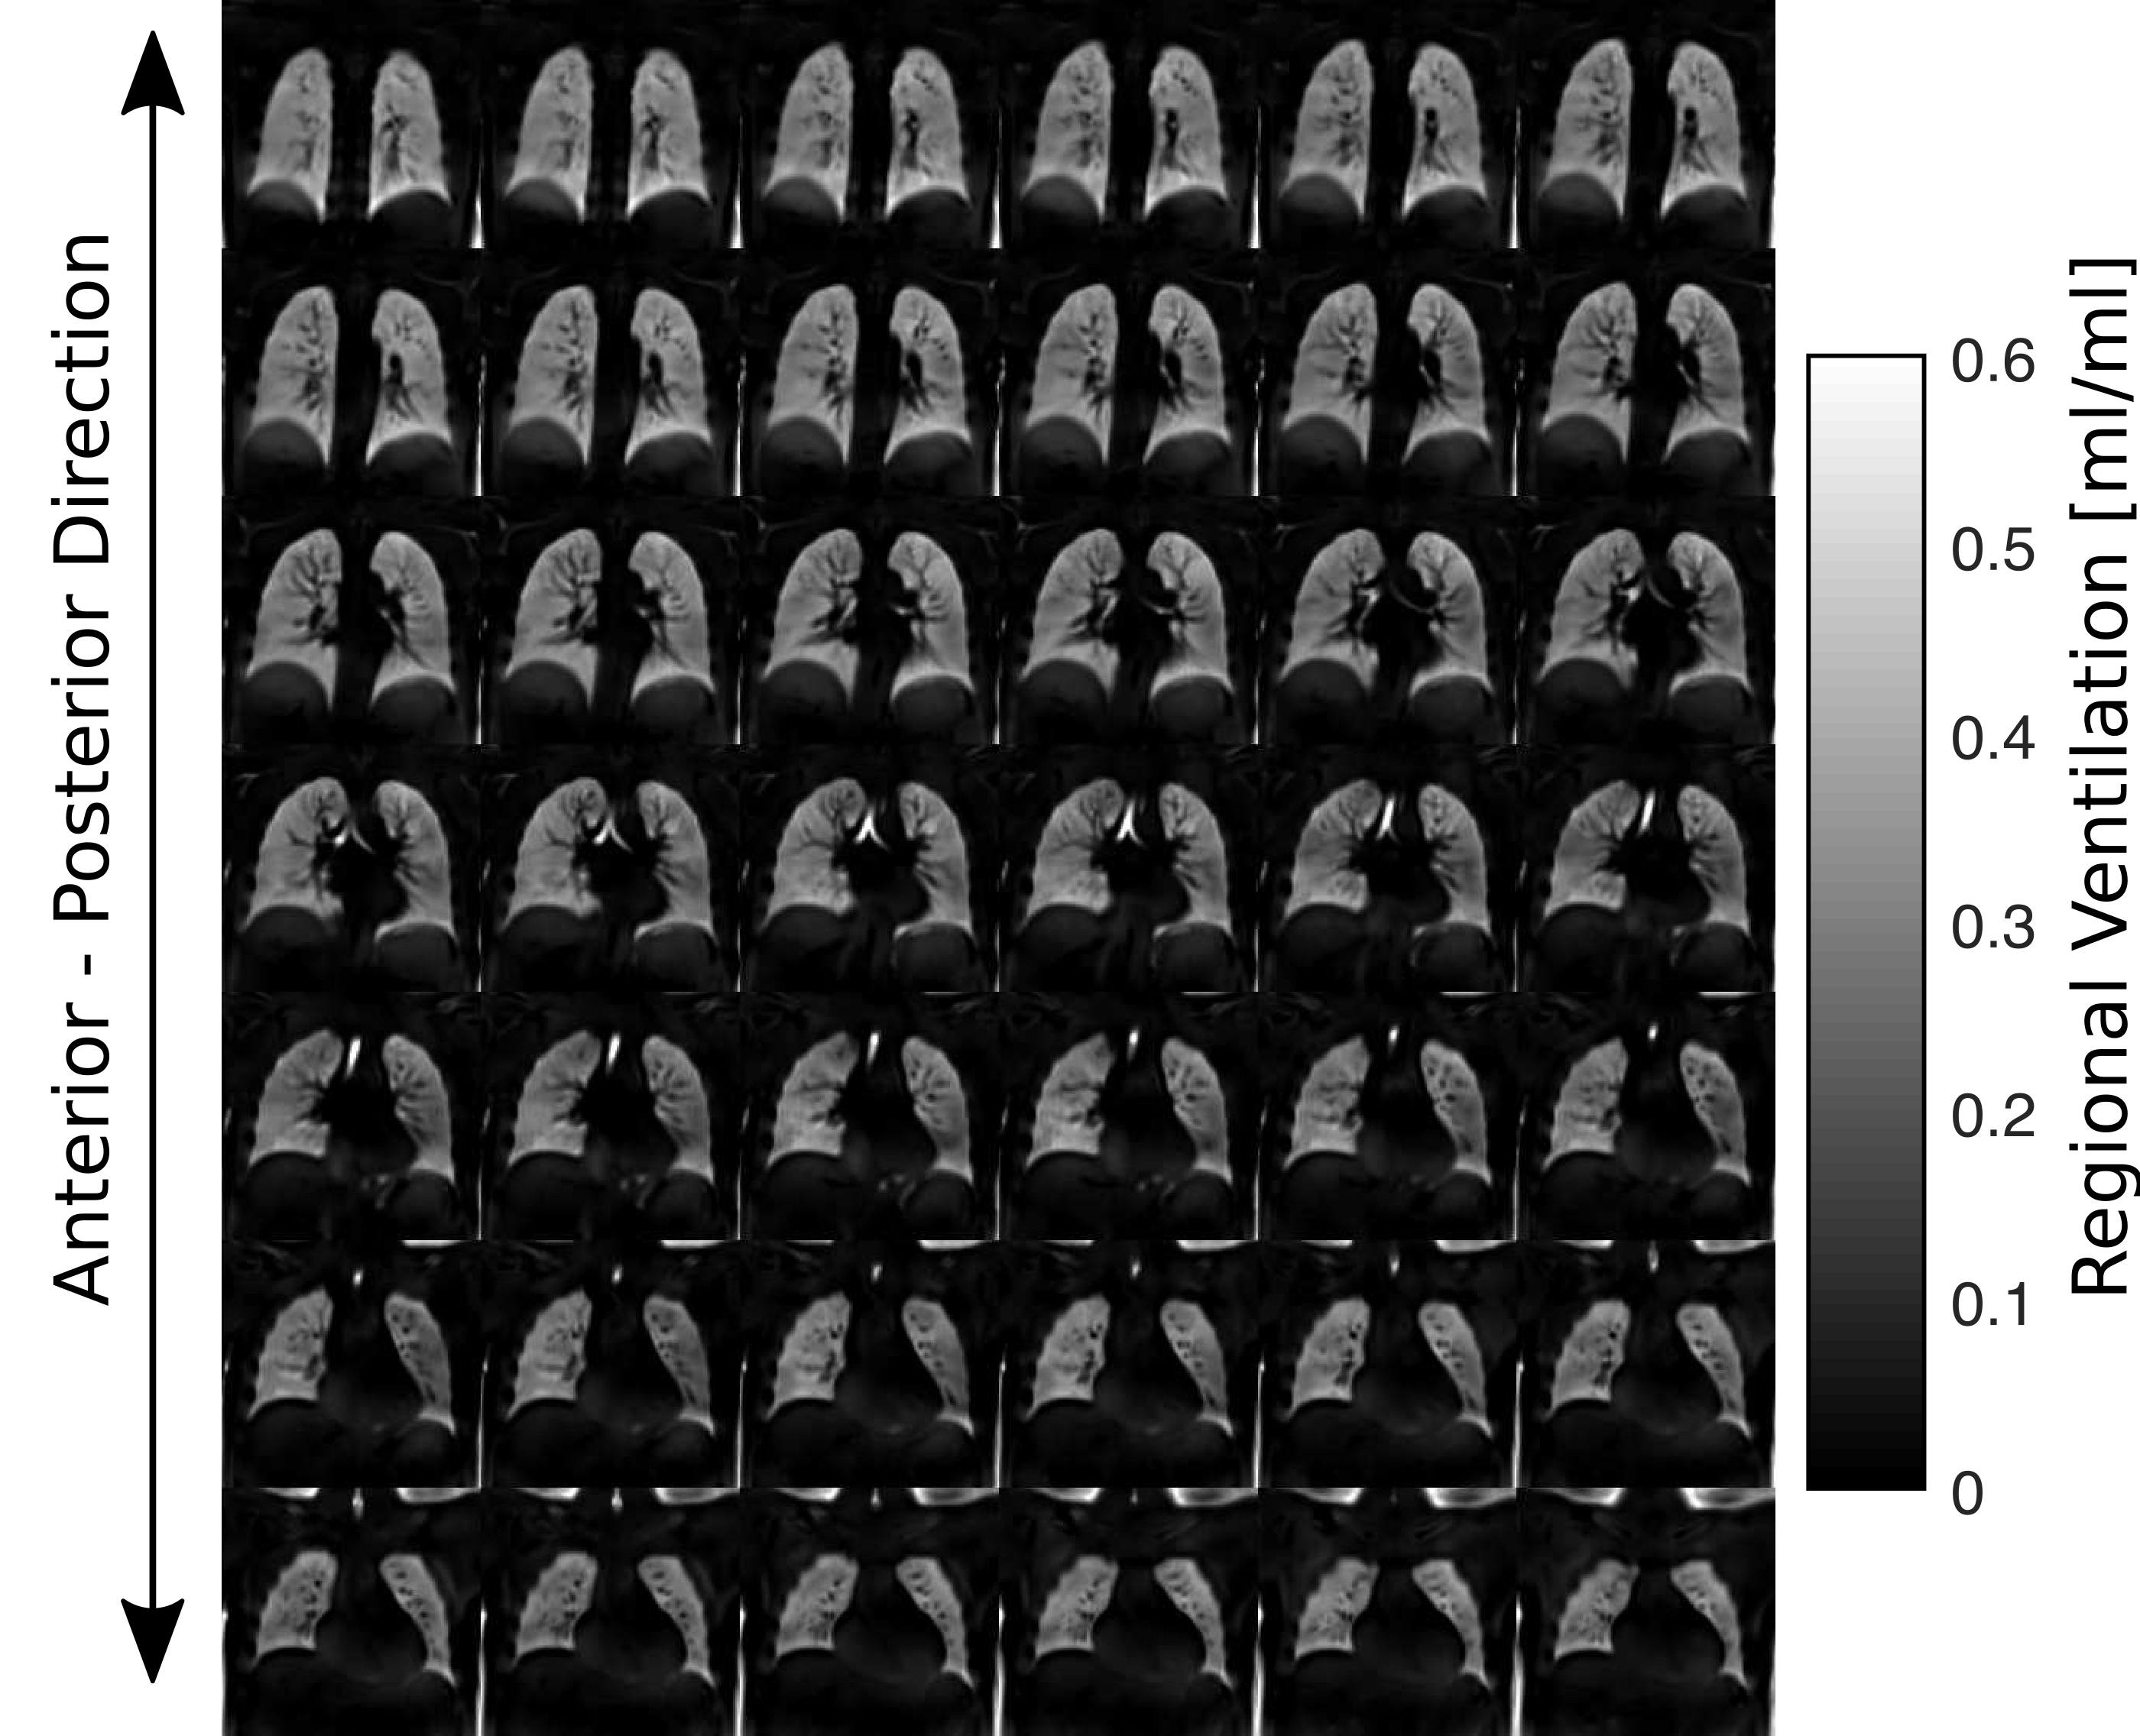
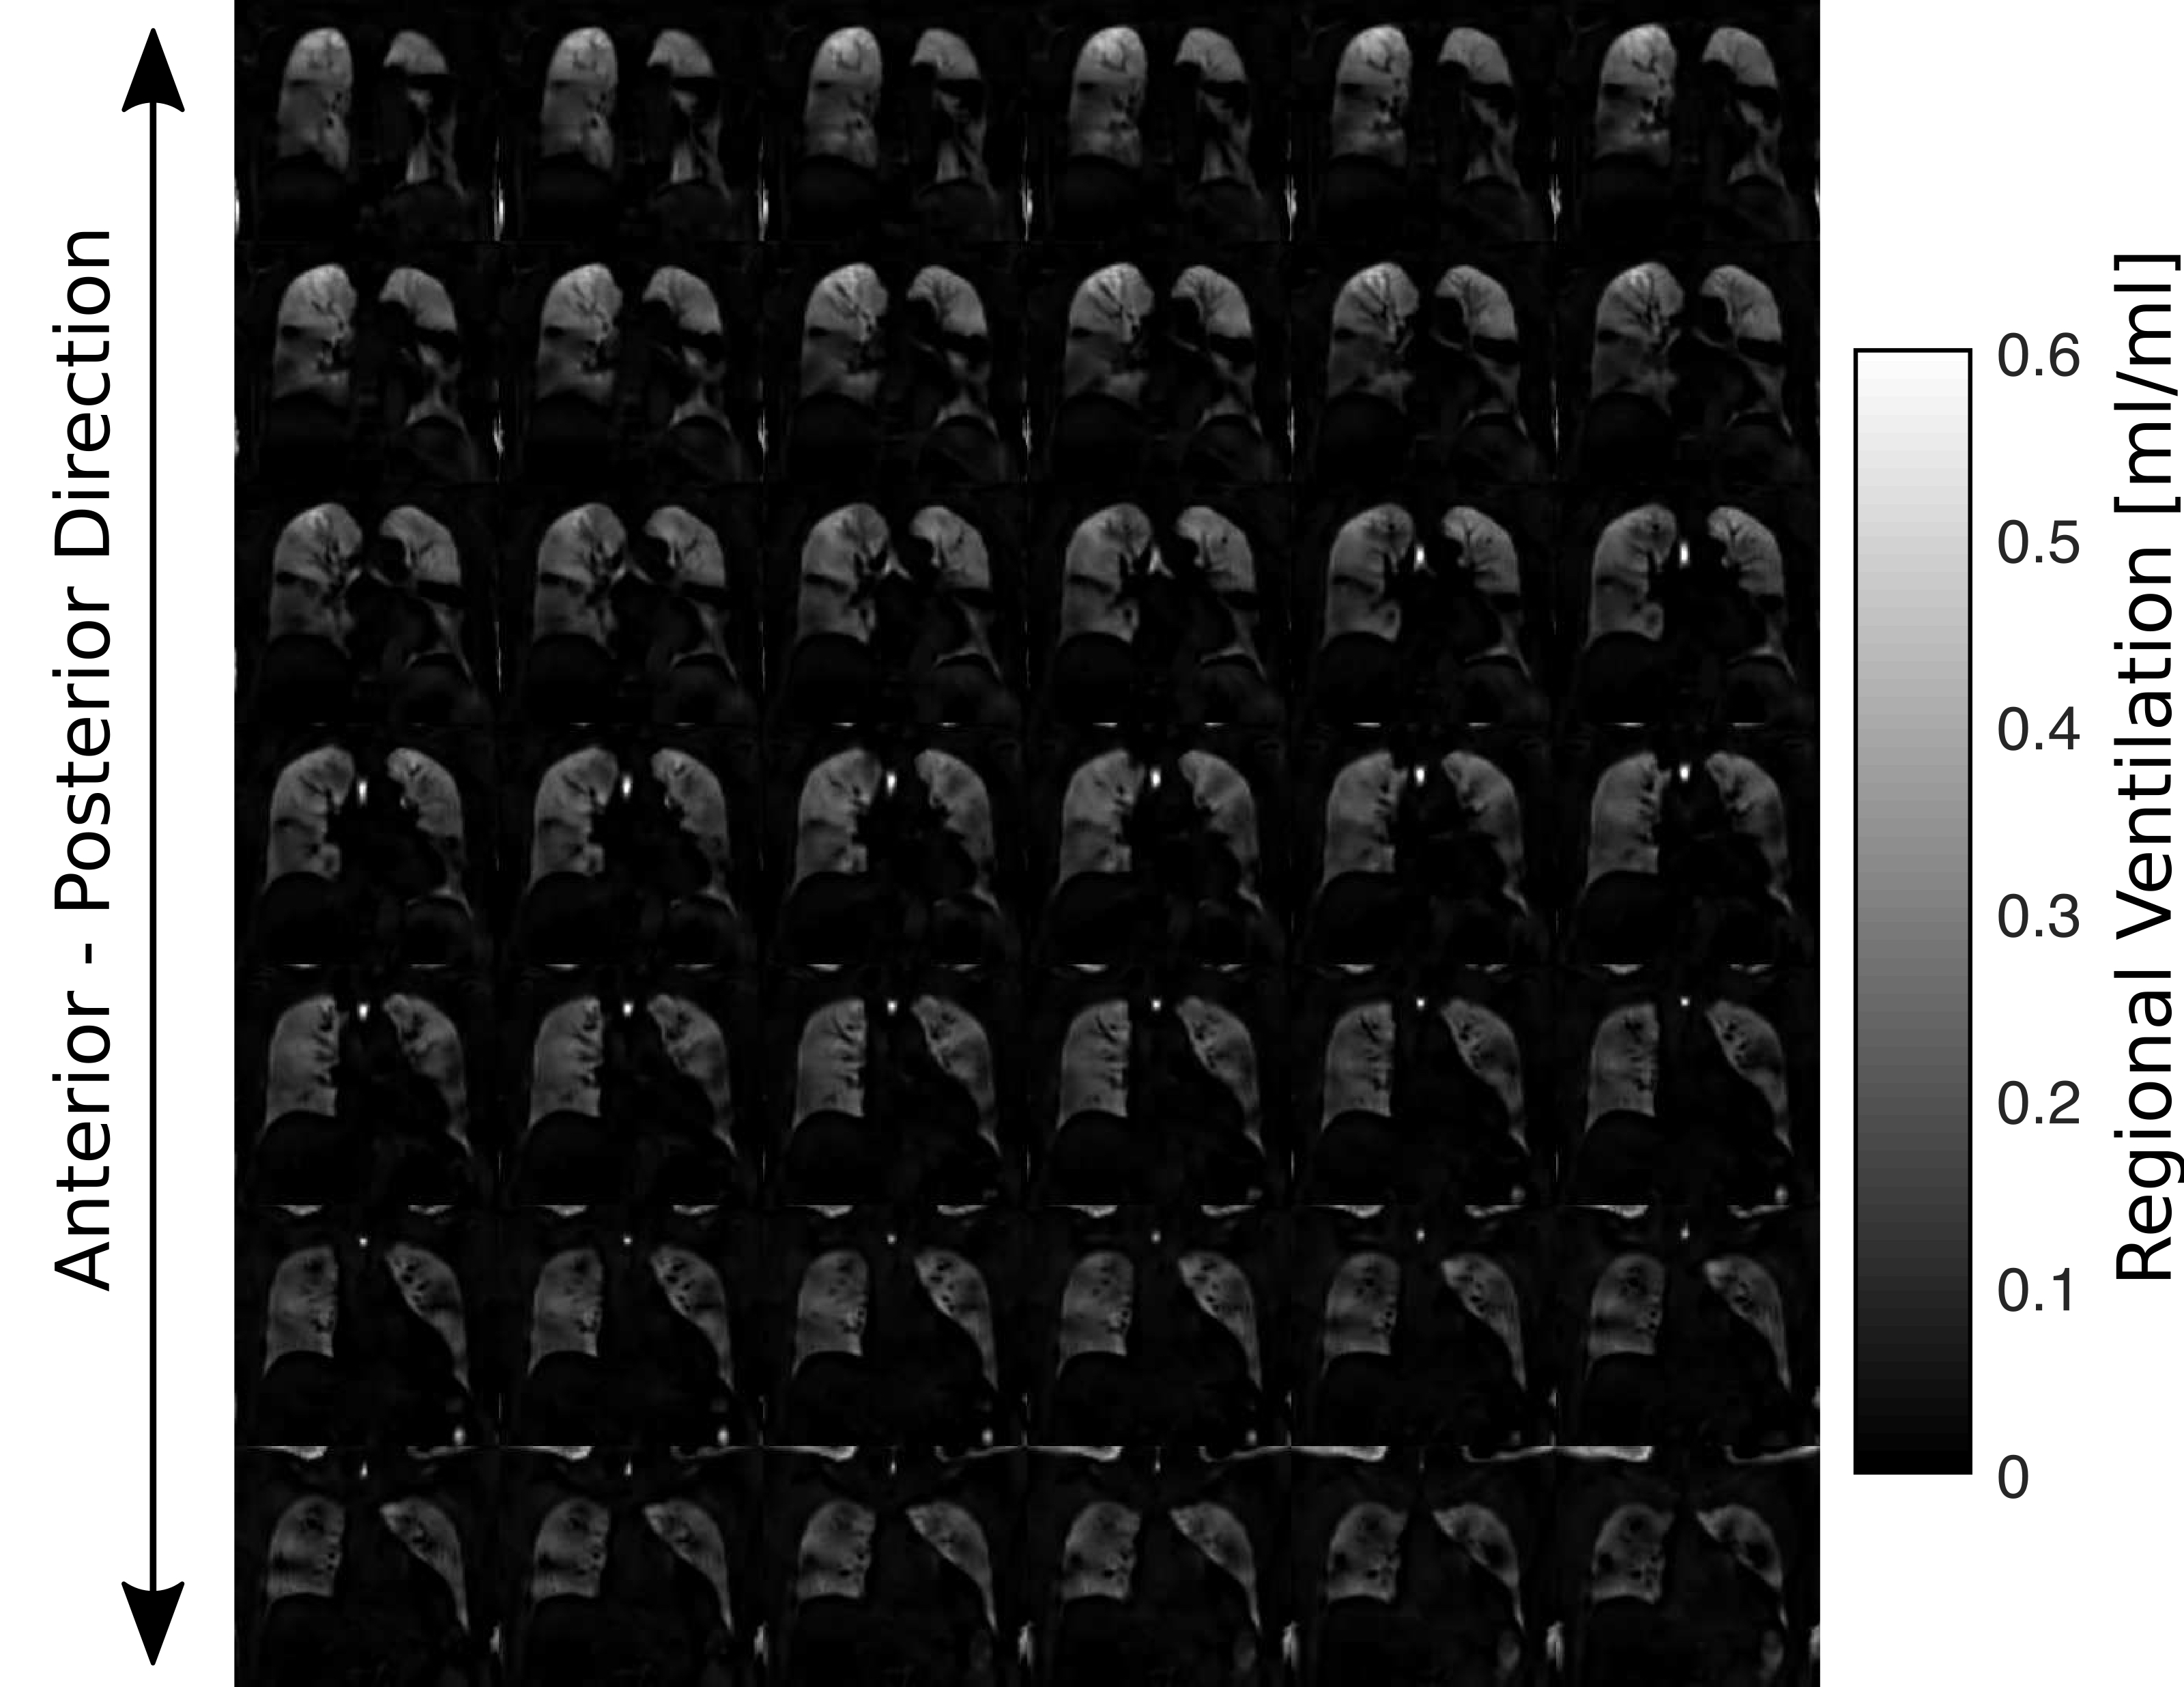
Figure 1 / 2 shows functional 3D PREFUL RV maps for a healthy volunteer / an asthma patient. Similar visual appearance is seen in Figure 3 and Figure 4 for 2D and 3D RV and FVL correlation maps in healthy volunteer and asthma patient. Mean RV and CC of both approaches are in good agreement in the healthy volunteer; in the asthma patient, the CC metric was in general lower in the 3D PREFUL approach by 10%. Figure 5 shows comparison of FVL correlation maps and respective FVL derived by 2D / 3D PREFUL approach of three slices in asthma patient. Regions with decreased CC (<90%) are visible in the FVL correlation maps with both techniques. Visual appearance of FVLs shape preferably during the expiration is slightly different.Discussion
This study demonstrates the feasibility of ventilation dynamics assessment with 3D PREFUL and shows initial comparison with 2D PREFUL.The 3D approach offers a significantly increased spatial resolution (3.9 mm isotropic vs. 3.9x3.9x15 mm), no respiratory variability between different slice positions, and the capturing of trough plane motion. The comparison with 2D PREFUL showed a good correspondence of lung areas with decreased regional ventilation or abnormal ventilation dynamics in an asthma patient.
Nevertheless, the comparison of FVL showed visible shape differences, which can be explained by different temporal resolution, non perfect match of slice positions and different healthy regions of both techniques taken as healthy reference. Further examination of healthy subjects / patients is required to perform a statistical comparison to 2D PREFUL.
In future studies, ventilation parameters derived from non-invasive 3D PREFUL technique may serve as potential markers for clinical trials, especially in patients where whole lung coverage is required.
Conclusion
The 3D PREFUL approach represents an alternative technique to assess lung ventilation dynamics with high-spatial-resolution proton MRI. This might be beneficial in clinical routine, especially in patients with small ventilation defects, which are not easily detectable with 2D techniques due to relatively thick slices of lung (>15mm).Acknowledgements
This work was funded by the German Center for Lung Research (DZL) and supported by Siemens Healthcare GmbH. Furthermore, the authors would like to thank Agilo Kern, Arnd Obert and Lea Behrendt for postprocessing support and useful discussions.References
1. Voorhees A, An J, Berger KI, Goldring RM, Chen Q. Magnetic resonance imaging-based spirometry for regional assessment of pulmonary function. Magn Reson Med. 2005;54(5):1146-1154. doi:10.1002/mrm.20682
2. Eichinger M, Tetzlaff R, Puderbach M, Woodhouse N, Kauczor H-U. Proton magnetic resonance imaging for assessment of lung function and respiratory dynamics. Eur J Radiol. 2007;64(3):329-334. doi:10.1016/j.ejrad.2007.08.007
3. Voskrebenzev A, Gutberlet M, Klimeš F, et al. Feasibility of quantitative regional ventilation and perfusion mapping with phase-resolved functional lung (PREFUL) MRI in healthy volunteers and COPD, CTEPH, and CF patients. Magn Reson Med. 2018;79(4):2306-2314. doi:10.1002/mrm.26893
4. Voskrebenzev A, Klimeš F, Gutberlet M, et al. Imaging-Based Spirometry in Chronic Obstructive Pulmonary Disease (COPD) Patients using Phase Resolved Functional Lung Imaging (PREFUL). Proc Intl Soc Mag Reson Med 26. 2018:1079.
5. Boucneau T, Fernandez B, Larson P, Darrasse L, Maître X. 3D Magnetic Resonance Spirometry. Proc Intl Soc Mag Reson Med 27. 2019:0002.
6. Klimeš F, Voskrebenzev A, Gutberlet M, et al. Free‐breathing quantification of regional ventilation derived by phase‐resolved functional lung (PREFUL) MRI. NMR Biomed. 2019;(February):e4088. doi:10.1002/nbm.4088
7. Lustig M, Donoho D, Pauly JM. Sparse MRI: The application of compressed sensing for rapid MR imaging. Magn Reson Med. 2007;58(6):1182-1195. doi:10.1002/mrm.21391
8. Uecker M, Ong F, Tamir J, et al. Berkeley Advanced Reconstruction Toolbox. Proc Intl Soc Mag Reson Med 23. 2015:2486.
9. Voskrebenzev A, Gutberlet M, Kaireit TF, Wacker F, Vogel-Claussen J. Low-pass imaging of dynamic acquisitions (LIDA) with a group-oriented registration (GOREG) for proton MR imaging of lung ventilation. Magn Reson Med. 2017;78(4):1496-1505. doi:10.1002/mrm.26526
10. Avants BB, Tustison NJ, Song G, Cook PA, Klein A, Gee JC. A reproducible evaluation of ANTs similarity metric performance in brain image registration. Neuroimage. 2011;54(3):2033-2044. doi:10.1016/j.neuroimage.2010.09.025
11. Moher Alsady T, Voskrebenzev A, Greer M, et al. MRI‐derived regional flow‐volume loop parameters detect early‐stage chronic lung allograft dysfunction. J Magn Reson Imaging. 2019;L:1-10. doi:10.1002/jmri.26799
Figures