2351
Comparison of Quantitative and Semi-Quantitative Metrics from Dynamic Contrast Enhanced MRI: Evaluation in Idiopathic Pulmonary Fibrosis1Dept. of Medical Physics, University of Wisconsin - Madison, Madison, WI, United States, 2Dept. of Medicine, University of Wisconsin - Madison, Madison, WI, United States, 3Dept. of Radiology, University of Wisconsin - Madison, Madison, WI, United States, 4Dept. of Biomedical Engineering, University of Wisconsin - Madison, Madison, WI, United States
Synopsis
Fully quantitative pulmonary perfusion metrics for the evaluation of lung disease can be difficult and time consuming to compute. We compare fully quantitative pulmonary blood flow (PBF) and mean transit time (MTT) to simpler semi-quantitative metrics slope and first moment transit time (FMTT) in idiopathic pulmonary fibrosis (IPF). We found strong correlations between the slope and PBF, as well as MTT and FMTT. A decrease in slope values was found in subjects with IPF when compared to healthy subjects. Slope could potentially be used as a surrogate for PBF to evaluate IPF.
Introduction
Dynamic Contrast-Enhanced MRI (DCE-MRI) has shown promise in the evaluation of perfusion in lung disease.1–4 In practice, fully quantitative modeling of perfusion is often difficult or impossible in the lungs due to inconsistent breath-hold, non-linear signal kinetics in the pulmonary artery5, or potential bias due to sequence and hardware parameters. Semi-quantitative metrics could serve as a potential surrogate for fully quantitative parameters when trying to answer the same clinical questions. We hypothesize that semi-quantitative metrics will be as clinically relevant as their quantitative counterparts, while being simpler to compute in practice.Methods
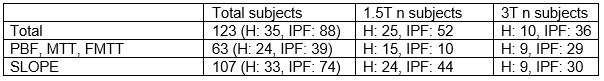
We evaluate our hypothesis in a comparison of healthy subjects with a patient population of Idiopathic Pulmonary Fibrosis (IPF), a pulmonary disease with unknown etiology but clinically significant outcome that would benefit from more sensitive markers of progression. As part of a larger, HIPAA-compliant and IRB approved study, 39 subjects were imaged repeatedly (2-4 visits) using DCE-MRI (Control N=16, 6M:10F, 56.5±13.8 years, IPF N = 23, 21M:2F, 70.5±8.4 years). Due to hardware upgrades during the course of the study, some subjects were imaged only at 1.5T, some only at 3T, and some at both field strengths (Table 1). All subjects were scanned while supine at end-expiratory breath hold. Contrast injection was performed using a dose of 0.05 mmol/kg dose of gadobenate dimeglumine (Multihance; Bracco Imaging) at 4 mL/s followed by a 35 mL saline flush to ensure a linear relationship between signal intensity and contrast concentration in the lung parenchyma.5 DCE pulmonary perfusion scans were acquired using 3D spoiled gradient-echo sequences. An Interleaved Variable Density sampling scheme (IVD, In -House)6 was used at 1.5T, and a Differential Subsampling with Cartesian Ordering sampling scheme (DISCO, GE)7, at 3T. Both sequences were acquired with full chest coverage and a parallel acceleration factor of 2x2. Other relevant scan parameters can be found in Table 2. Analysis was performed using MATLAB (R2018b, The MathWorks, Natick, MA). Consecutively acquired morphological images were used to semi-automatically segment the perfusion datasets as previously reported.8,9 The voxel-wise signal time courses were calculated by subtraction of and normalization to the baseline mask signal. The arterial input function (AIF) was automatically generated as previously described10. Pulmonary blood flow (PBF) and mean transit time (MTT) were derived using a Tikhonov regularized deconvolution technique11–13. The regularization parameter for each voxel is selected using an l-curve criterion optimization.14 The semi-quantitative parameter "slope" was was calculated using:$$\frac{S_p-S_0}{t_p-t_0}$$
where Sp and tp are the peak signal value and time to peak (TTP), while S0 and t0 are the signal at the bolus time of arrival (TOA) and the TOA, respectively. The first moment transit time (FMTT) was calculated using the following equation:
$$\frac{\int S*t\,dt}{\int S\,dt}$$
The total sample sizes can be seen in Table 1. The high failure rates in IPF subjects occurred due to scan length and loss of breath-hold requiring development of semi-quantitative methods. We note that after applying quality control, we retain more data for the slope due to needing fewer temporal data for accurate calculation.
Statistical comparisons were performed using analysis of covariance. Each parameter was adjusted for dependence on age, lung volume, and field strength. Adjusted parameters were used in the rest of the analysis to determine group differences, quantitative to semi-quantitative correlations, and correlations to PFTs.
Results
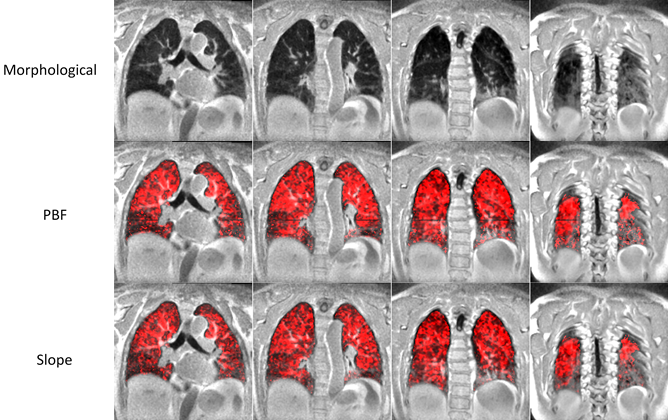
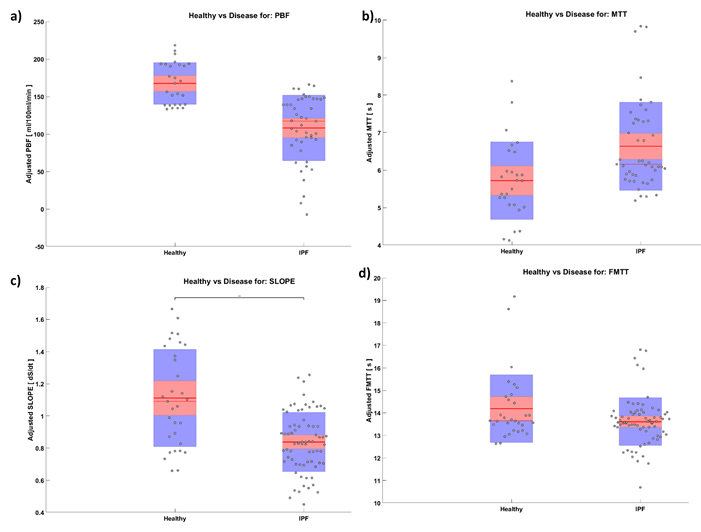
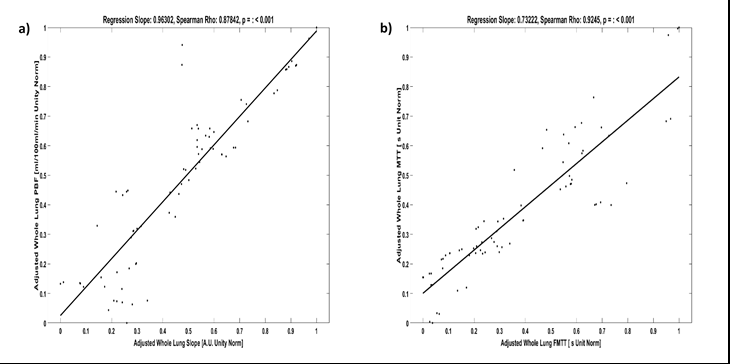
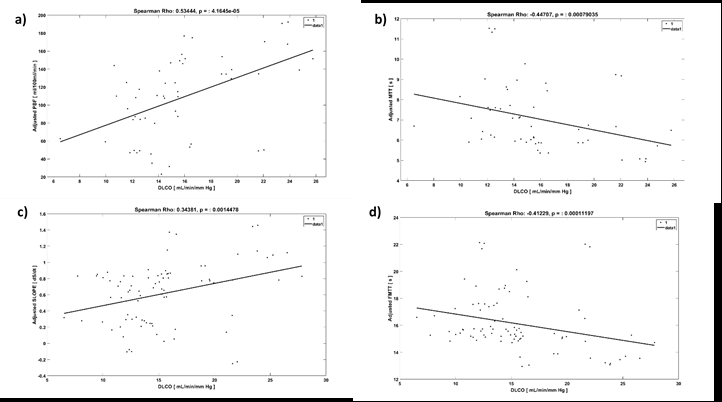
Representative images comparing parametric maps of PBF and SLOPE in a fibrotic patient are shown in Figure 1. We observe clear spatial correlations between the areas of disease, reduction in pulmonary blood flow, and reduction in slope. Patients with IPF exhibit similarly reduced PBF and SLOPE compared to healthy subjects, although only SLOPE reached significance (p < 0.01) (Figure 2). We observed strong associations between semi-quantitative and quantitative values with statistically significant correlations between PBF and SLOPE (rho = 0.88), and MTT and FMTT (rho = 0.92). (Figure 3). When testing whether these perfusion metrics are associated with canonical measures of pulmonary function, the strongest relationships were with DLCO (p < 0.01 for all parameters) (Figure 4).Discussion
We provide evidence for using slope as a surrogate for PBF. Although PBF and slope show similar trends, only slope reached statistical significance in a group comparison, likely due to a larger sample size. This highlights a benefit of using slope in subjects that have difficulty performing the breath-holds required for quantification. FMTT and MTT seem to have a strong correlation, but they do not trend similarly in the diseased cohort. This could be because FMTT behaves differently than MTT in areas of disease, which might be a limitation of FMTT as a surrogate. Another limitation of the semi-quantitative parameters is the sensitivity to the bolus injection speed and contrast dose. Further investigation needs to be done to evaluate the robustness to the injection protocol, as well as to quantify the repeatability of these parameters.Conclusion
Slope could serve as a surrogate predictor in the absence of fully quantitative PBF. Slope has a strong relationship with PBF and requires less dynamic information to compute. FMTT and MTT show good correspondence, however further work should be performed to evaluate the response in fibrotic disease. Future work should also quantify the repeatability of these metrics.Acknowledgements
The authors thank our collaborators and colleagues. This work was supported by NIH/NHLBI grants R01 HL126771, R01 HL136965, UL1TR000427 to University of Wisconsin Institute for Clinical and Translational Research (ICTR), and the University of Wisconsin Pulmonary Imaging Center (NIH S10 OD016394). This project was also supported in part through a fellowship to Luis Torres from the University of Wisconsin Science and Medicine Graduate Research Scholars Program (SciMed GRS).References
1. Eichinger, M. et al. Contrast-enhanced 3D MRI of lung perfusion in children with cystic fibrosis--initial results. Eur. Radiol. 16, 2147–2152 (2006).
2. Kluge, A. et al. Pulmonary perfusion in acute pulmonary embolism: agreement of MRI and SPECT for lobar, segmental and subsegmental perfusion defects. Acta Radiol. Stockh. Swed. 1987 47, 933–940 (2006).
3. Ohno, Y. et al. Primary Pulmonary Hypertension: 3D Dynamic Perfusion MRI for Quantitative Analysis of Regional Pulmonary Perfusion. Am. J. Roentgenol. 188, 48–56 (2007).
4. Ohno, Y. et al. Quantitative assessment of regional pulmonary perfusion in the entire lung using three-dimensional ultrafast dynamic contrast-enhanced magnetic resonance imaging: Preliminary experience in 40 subjects. J. Magn. Reson. Imaging 20, 353–365 (2004).
5. Neeb, D. et al. Quantification of pulmonary blood flow (PBF): validation of perfusion MRI and nonlinear contrast agent (CA) dose correction with H(2)15O positron emission tomography (PET). Magn. Reson. Med. 62, 476–487 (2009).
6. Wang, K. et al. Pulmonary perfusion MRI using interleaved variable density sampling and HighlY constrained cartesian reconstruction (HYCR). J. Magn. Reson. Imaging JMRI 38, 751–756 (2013).
7. Saranathan, M., Rettmann, D. W., Hargreaves, B. A., Clarke, S. E. & Vasanawala, S. S. DIfferential Subsampling with Cartesian Ordering (DISCO): a high spatio-temporal resolution Dixon imaging sequence for multiphasic contrast enhanced abdominal imaging. J. Magn. Reson. Imaging JMRI 35, 1484–1492 (2012).
8. Kohlmann, P. et al. Automatic lung segmentation method for MRI-based lung perfusion studies of patients with chronic obstructive pulmonary disease. Int. J. Comput. Assist. Radiol. Surg. 10, 403–417 (2015).
9. Tustison, N. J. & Avants, B. B. Explicit B-spline regularization in diffeomorphic image registration. Front. Neuroinformatics 7, (2013).
10. Kohlmann, P., Laue, H., Krass, S. & Peitgen, H.-O. Fully-Automatic Determination of the Arterial Input Function for Dynamic Contrast-Enhanced Pulmonary MR Imaging. in MIUA (2011).
11. Meier, P. & Zierler, K. L. On the Theory of the Indicator-Dilution Method for Measurement of Blood Flow and Volume. J. Appl. Physiol. 6, 731–744 (1954).
12. Sourbron, S. et al. Deconvolution of bolus-tracking data: a comparison of discretization methods. Phys. Med. Biol. 52, 6761 (2007).
13. Bell, L. C. et al. Comparison of Models and Contrast Agents for Improved Signal and Signal Linearity in Dynamic Contrast-Enhanced Pulmonary MRI. Invest. Radiol. 50, 174–178 (2015).
14. Sourbron, S., Dujardin, M., Makkat, S. & Luypaert, R. Pixel-by-pixel deconvolution of bolus-tracking data: optimization and implementation. Phys. Med. Biol. 52, 429–447 (2007).
Figures