2350
Native T1-mapping of focal pulmonary lesions in 3.0-T magnetic resonance imaging: lesions display and accuracy of size estimation1Shanghai public health clinical center, Shanghai, China
Synopsis
This study aimed to investigate the diagnosis efficacy of native T1-mapping in focal pulmonary lesion, focused on lesions display and accuracy of size estimation. All lesions were clearlly demonstrated by CT, native T1-mapping, T1-star VIBE, and T2-fBLADE TSE. The tumor and distal obstructive pulmonary atelectasis can also be detected clearly by native T1-mapping. T1-mapping-based diameter measurements yielded excellent intra-observer and inter-methods consistent.In conclusion, we considered that native T1-mapping displays focal pulmonary lesions clearly (particularly when accompanying obstructive atelectasis and/or pneumonia) and enable accurate and reliable diameter measurement.
Purpose
To investigate the diagnosis efficacy of native T1-mapping in focal pulmonary lesion, compared to T1-star 3D-volumetric interpolated breath-hold sequence (VIBE), T2-fBLADE turbo-spin echo (TSE), and computed tomography (CT)Materials and Methods
Thirty-nine patients with CT-detected focal pulmonary lesions underwent thoracic 3.0-T MRI using axial free-breathing 3D T1-star VIBE, respiratory triggered T2-fBLADE TSE, breath-hold T1-Turbo FLASH and T1-FLASH 3D. Native T1-mapping images were generated by T1-FLASH 3D with B1-filed correction by T1-Turbo FLASH. The intraclass correlation coefficient (ICC) and Bland-Altman plots were used to evaluate intra-observer agreement and inter-method reliability of diameter measurements (T1-mapping & T1-star VIBE, T1-mapping & T2-fBLADE TSE and T1-mapping & CT).Results
Forty-five focal pulmonary lesions (3.30 ± 1.90cm, range: 1.00 - 7.80cm; 27 with a range of 1.00 - 2.92cm) were displayed by CT, native T1-mapping, T1-star VIBE, and T2-fBLADE TSE. Four lesions showed consolidation on CT, but showed distal obstructive pulmonary atelectasis and/or pneumonia with native T1-mapping. T1-mapping-based diameter measurements yielded an intra-observer ICC of 0.995 and a mean difference of -0.03 cm. Additionally, inter-method measurements were highly consistent (T1-mapping & T1-star VIBE: ICC 0.982, mean difference 0.23 cm, T1-mapping & T2-fBLADE TSE: ICC 0.978, mean difference 0.17 cm, T1-mapping & CT: ICC 0.972, mean difference 0.15 cm). For lesions < 3.00 cm, T1-mapping intra-observer (ICC 0.982, mean difference 0.01 cm) and inter-method diameter measurements were also highly consistent (T1-mapping & CT: ICC 0.823, mean difference 0.10 cm). T1-mapping intra-observer lesions’ T1-values measurements were also highly consistent (ICC: 0.984).Conclusion
Native T1-mapping displays focal pulmonary lesions clearly (particularly when accompanying obstructive atelectasis and/or pneumonia) and enable accurate and reliable diameter measurement.Acknowledgements
References
Figures
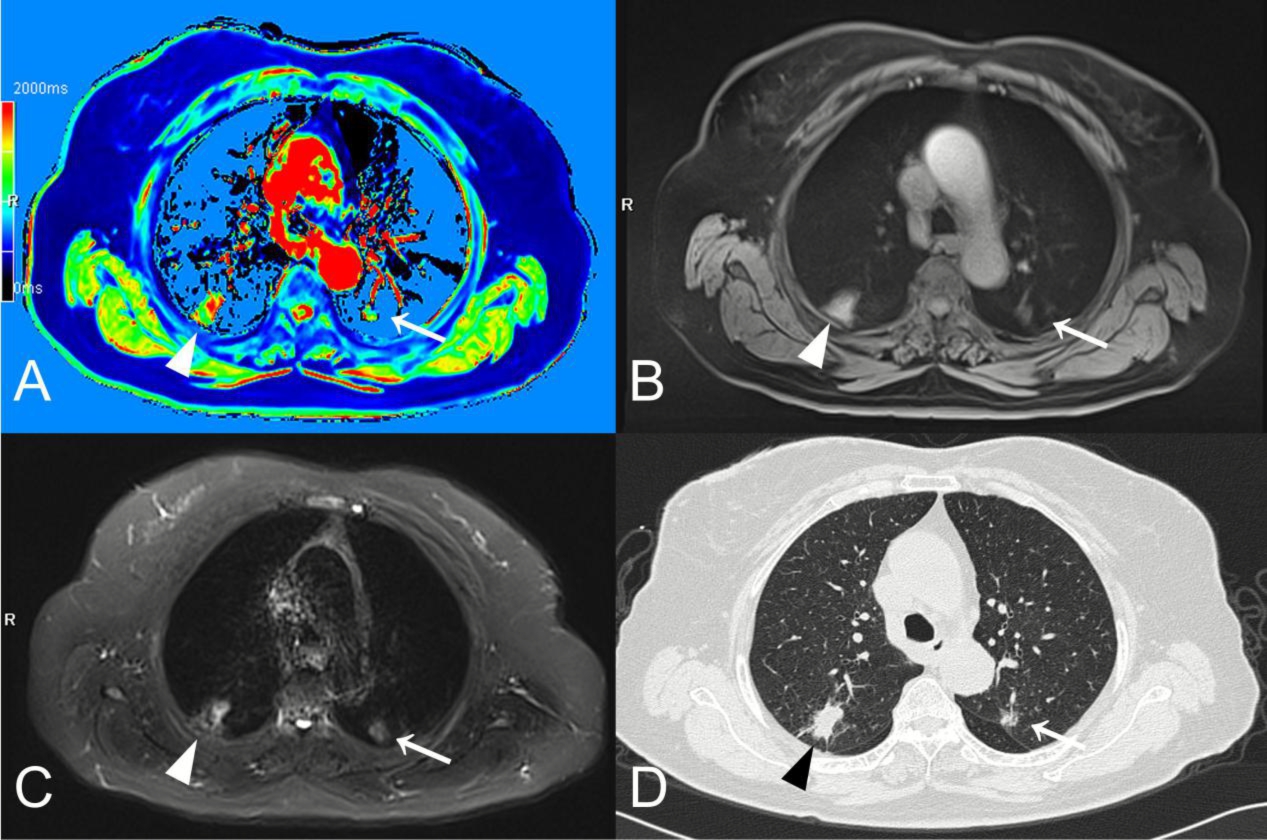
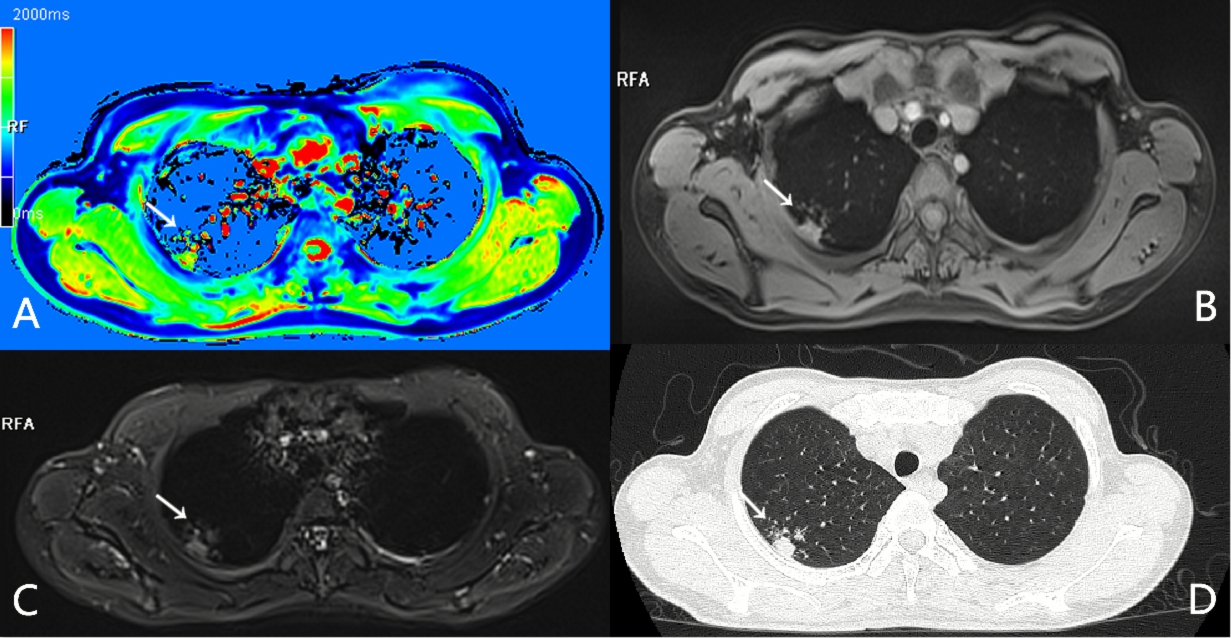
A patient with two simultaneous primary lung adenocarcinomas.
A nodule in the left superior lobe can be detected clearly by T1-mapping (A, white ‘→’) while manifested as a part-solid nodule in CT (D, white‘→’) with less intense in T1-star VIBE (B, white ‘→’), but more intense in T2-fBLADE TSE (C, white‘→’). Another solid nodule can also be clearly detected by T1-mapping (A, white ‘△’) with slightly more intense in T1-star VIBE (B, white ‘△’), and markedly more intense in T2-fBLADE TSE (C, white ‘△’).