2349
3D and 2D MRI sequences of lung nodules: comparison of capability for nodule detection and image quality evaluation
Shuyi Yang1, Qinqin Yan1, Fei Shan1, Zhiyong Zhang2, Yuxin Shi1, and Mengxiao Liu3
1Shanghai public health clinical center, Shanghai, China, 2Fudan University, Shanghai, China, 3Scientific Marketing, Diagnositic Imaging, Siemens Healthcare Ltd., Shanghai, China
1Shanghai public health clinical center, Shanghai, China, 2Fudan University, Shanghai, China, 3Scientific Marketing, Diagnositic Imaging, Siemens Healthcare Ltd., Shanghai, China
Synopsis
This study aimed to evaluate the capability of different non-enhanced MRI sequences for lung nodules assessment. Sensitivity and specificity from MR images were calculated, with CT regarded as golden standard. The sensitivities by T1-starVIBE, T1-VIBE, T2-fBLADE TSE and T2-SPACE were 79.79%, 75%, 88.3%, 89.89%, while the specificity were 100%, 83.33%, 33.33%, 53.33% respectively. In conclusion, for uncooperative patients who can’t hold their breath, T1-starVIBE and T2-fBLADE were advised because of the excellent ability to remove artifacts. T1-VIBE can applied to those who coordinate well. All those three sequences can be used for pulmonary nodules assessment and long-term follow-up in clinical.
Background
There is an increased interest in pulmonary magnetic resonance imaging (MRI) as a radiation-free alternative to computed tomography (CT) for lung nodules detection and evaluation recentlyPurpose
To compare the detection capability for lung nodule and to evaluate image quality of pulmonary MRI. T1-weighted free-breathing star-volumetric interpolated breath-hold sequence (T1-StarVIBE), breath-hold T1-VIBE, respiratory triggered T2-weighted two-dimensional fast BLADE turbo spin-echo(T2-fBLADE TSE) and T2-weighted three-dimensional isotropic turbo spin-echo(T2-SPACE TSE) were compared with CT image in this studyMaterials and methods
Sixty-eight patients with 188 solid lung nodules underwent pulmonary MRI using axial T1-StarVIBE, T1-VIBE, T2-fBLADE TSE and T2-SPACE TSE. All data were collected on a 3.0 T scanner (MAGNETOM Skyra, Siemens healthcare, Erlangen, Germany) with a 18-channel body ciol. Sensitivity and specificity of all nodules were calculated. For nodules larger than 1.0 cm, the picture signal to noise ratio (Picture-SNR), lesion signal to noise ratio (Lesion-SNR) and lesion contrast to noise ratio (CNR) were calculated. MRI images were also assessed with a five-point visual scoring system (range: 0’-4’, 2’-4’ were available in clinical practice). Picture-SNR, Lesion-SNR and CNR were compared among MR sequences by Mann-Whitney U tests, while the five-point visual scoring were evaluated by frequency analysis. All analysis were evaluated by SPSS 26 (IBM, Armonk,NY) and MedCalc 18.11.3 (MedCalc Software bvba, Ostend, Belgium)Results
One hundred and eighty-eight solid lung nodules (size:1.01±0.78cm, range: 0.30-3.00cm) were detected by CT. According to the Lung-RADS category, the sensitivities of lung nodules detection by T1-Star VIBE were 61.63% (< 0.60cm), 90.38% (0.60-1.50cm), 100.00% (1.50-3.00cm) and 79.79% (overall); T1-VIBE were 52.33% (< 0.60cm), 88.46% (0.60-1.50cm), 100.00% (1.50-3.00cm) and 75.00% (overall); T2-fBLADE TSE were 76.74% (< 0.60cm), 96.15% (0.60-1.50cm), 100.00% (1.50-3.00cm) and 88.30% (overall); T2-SPACE TSE were 79.07% (< 0.60cm), 98.08% (0.60-1.50cm), 100.00% (1.50-3.00cm) and 89.89% (overall) (Table1). The specificities of lung nodules detection by T1-Star VIBE, T1-VIBE, T2-fBLADE TSE and T2-SPACE TSE were 100%, 83.33%, 33.33% and 53.33%. Sixty-four lung nodules were measured larger than 1.00cm (size: 1.97±0.56cm, range: 1,00-3.00cm). T1-Star VIBE had significantly higher picture & lesion SNR and CNR compared with T1-VIBE (P<0.05). T2-fBLADE TSE had significantly higher lesion-SNR compared with T2-SPACE TSE (P<0.05) (Table2). The frequency of scores which larger than 2’ were 82.8% by T1-Star VIBE, 92.2% by T1-VIBE, 89.1% by T2-fBLADE TSE and 87.5% by T2-SPACE TSE.Discussion and conclusion
T2WI including T2-SPACE TSE and T2-fBLADE TSE had higher detection sensitivity of lung nodules compared to T1WI, but with lower specificity. T2-SPACE TSE sequence had higher sensitivity and specificity compared to T2-fBLADE TSE. T1-starVIBE achieved better picture & lesion-SNR and CNR but lower visual score than T1-VIBE. That means, for patients with excellent coordination of breath-hold, T1-VIBE was available in clinical practice. T2-fBLADE TSE achieved higher lesion-SNR and visual score compared with T2-SPACE TSE, which was due to the worse display of lung parenchyma. In conclusion, we advised T1-StarVIBE (patients without excellent coordination of breath-hold) or T1-VIBE (patients with excellent coordination) and T2-fBLADE TSE for pulmonary nodules assessment and long-term follow-up in clinical practice.Acknowledgements
References
Figures
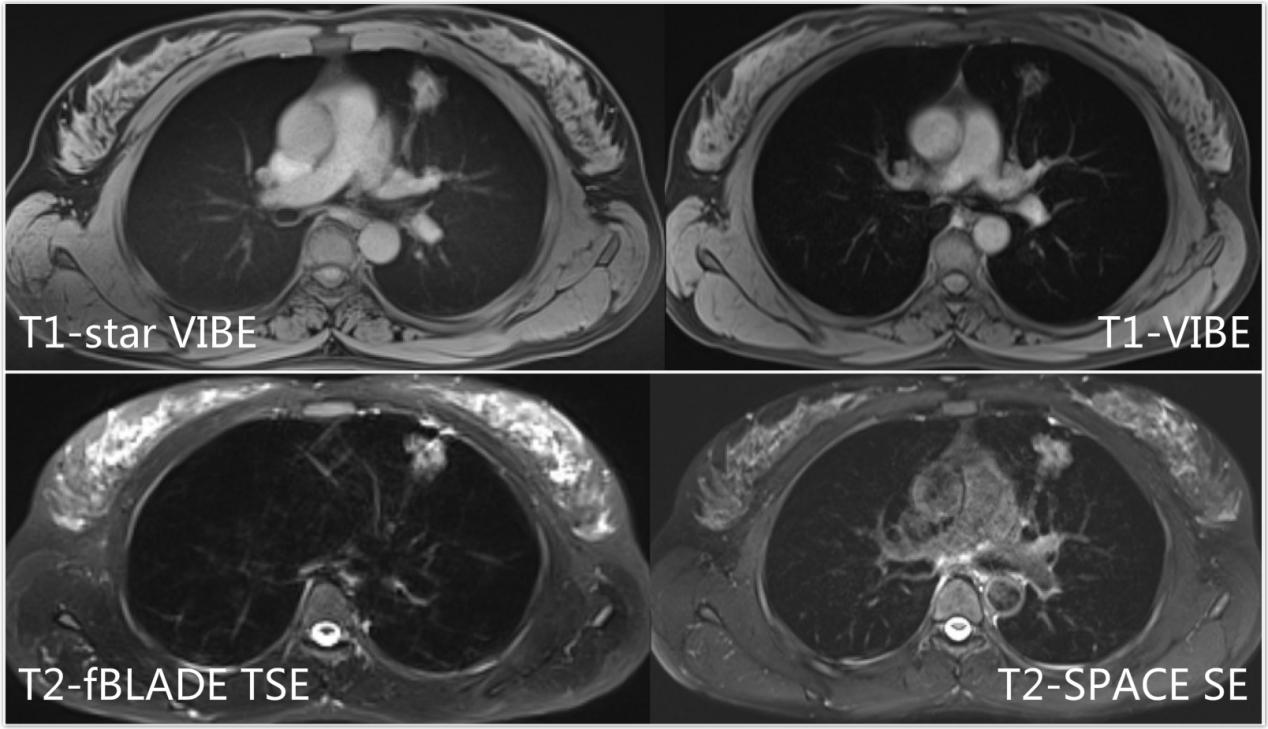
A nodule confirmed as lung adenocarcinoma located in the upper lobe of left lung. T1-star VIBE, T1-VIBE, T2-fBLADE TSE and T2-SPACE SE all showed lesion, which with lower lesion signal by T1-VIBE
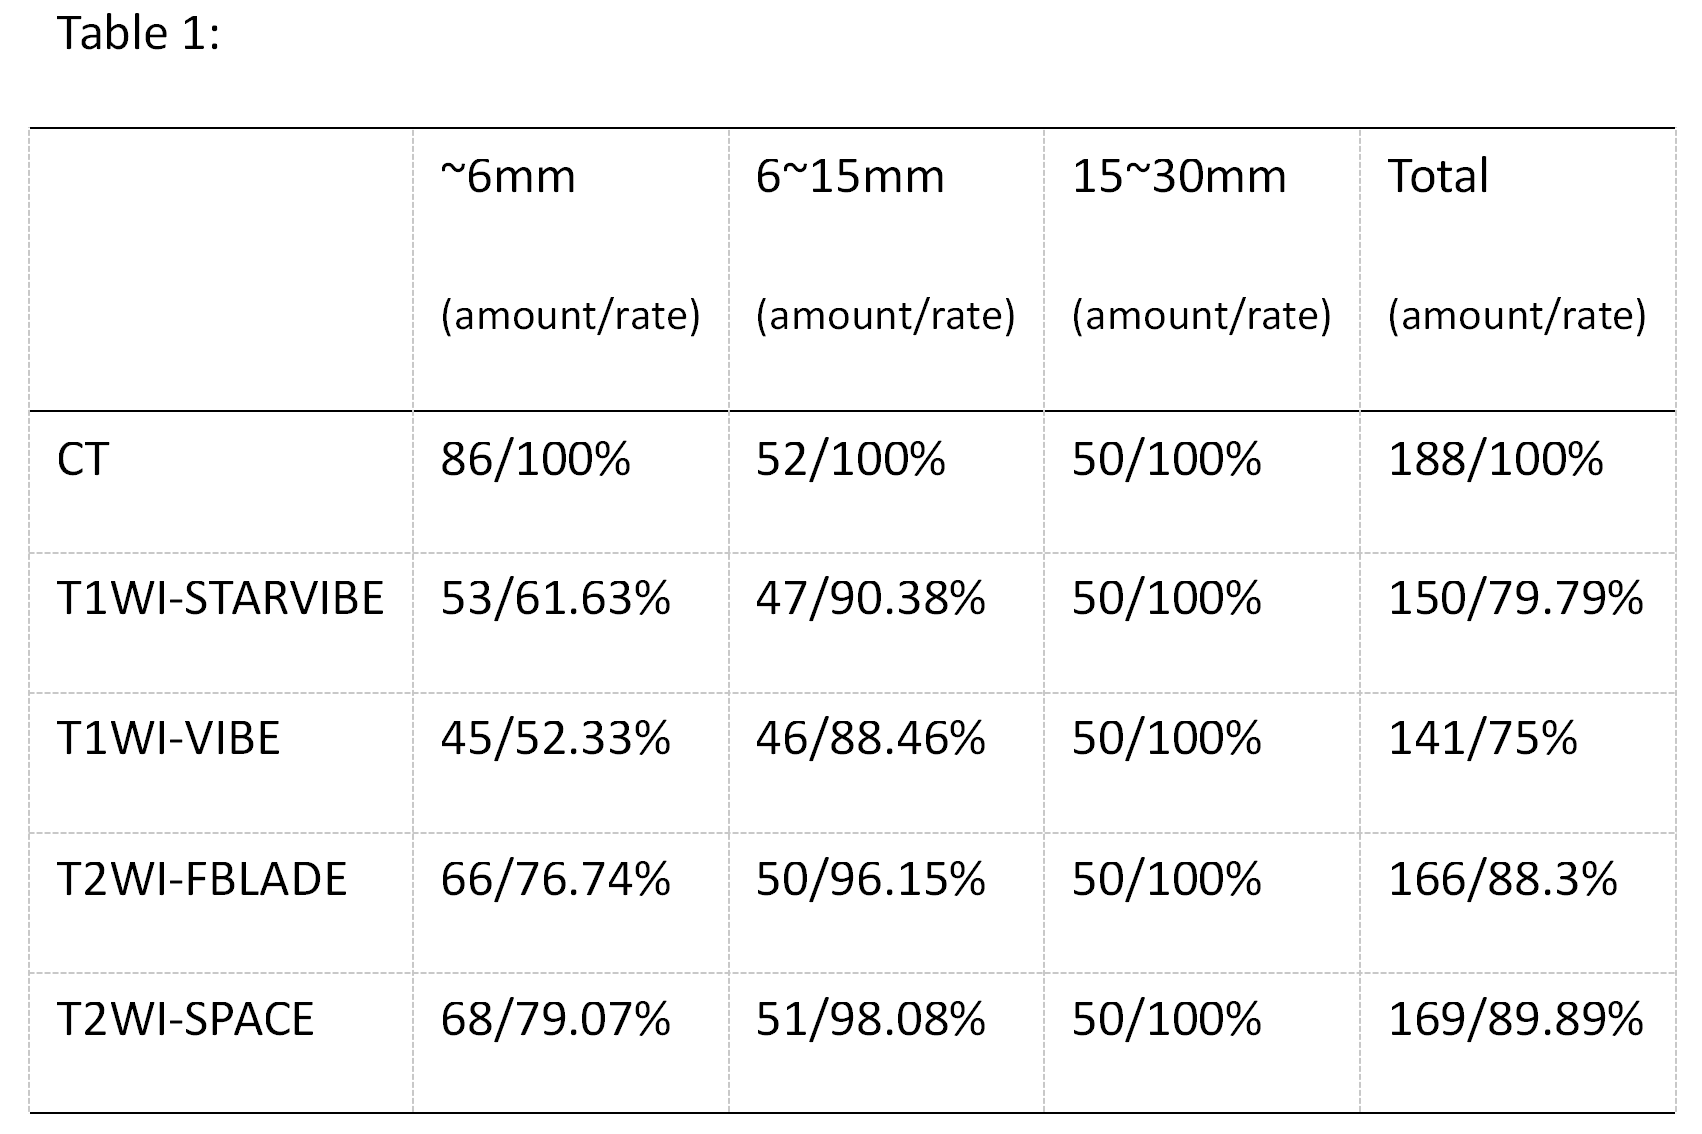
Table-1
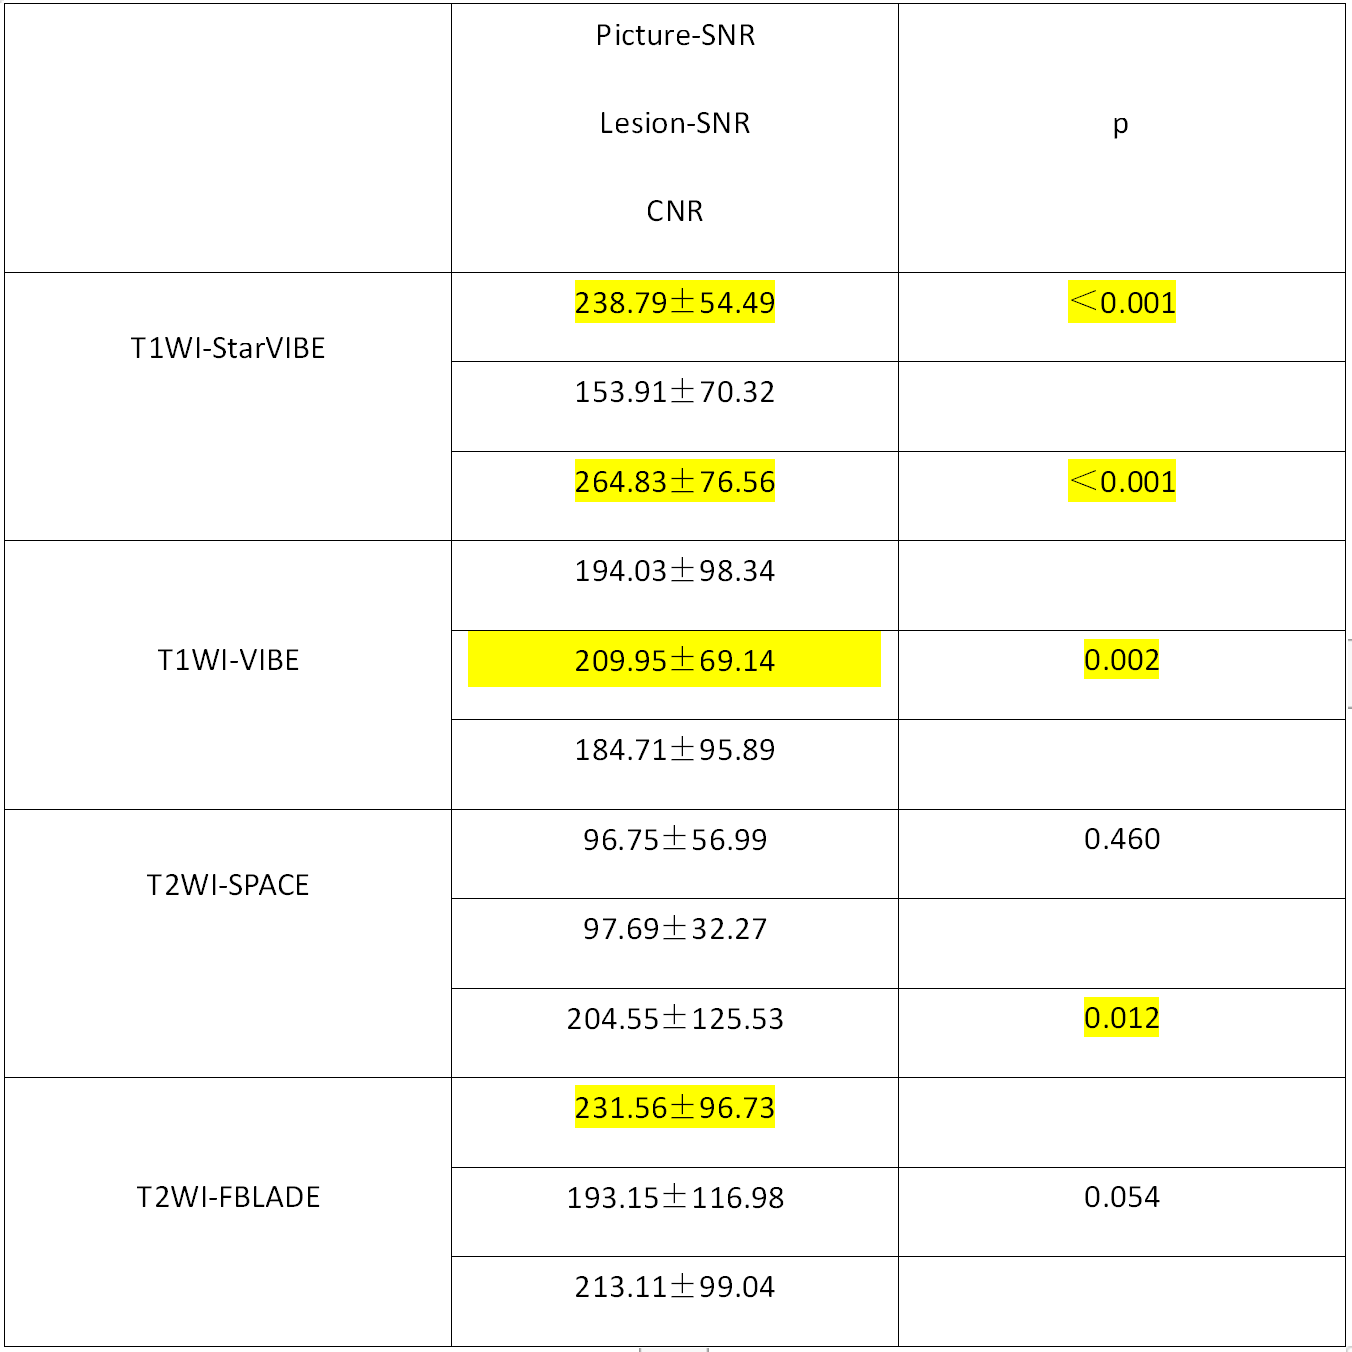
Table-2